163 Old Leicester Hwy · Woodfin, NC
Flood risk 1/10 · Minimal
- FEMA flood zone
- X (unshaded)
- Chance of flooding over 30 yrs
- 0.0%
- Est. flood insurance / yr
- $473 – $860
Fire risk 4/10 · Minor
- Est. fire insurance / yr
- $906 – $1,684
Heat risk 4/10 · Minor
- Hot days now (above 98°F)
- 7 days/yr
- Hot days in 30 yrs
- 19 days/yr
Wind risk 2/10 · Minimal
- Chance of severe wind over 30 yrs
- —
Air-quality risk 3/10 · Minor
- Unhealthy air days now
- 2 days/yr
- Unhealthy air days in 30 yrs
- 2 days/yr
Risk factors via First Street. Map © Google.
Why this score? — see what drove the C grade
The composite is a weighted blend of 9 inputs, each scored 0–100. Each bar is that input's sub-score; the figure is the points it added to the 100-point composite (weight × sub-score).
- Cash flow +17.9/30.0
- ARV discount +15.0/15.0
- DSCR +5.6/10.0
- 1% rule +4.8/10.0
- Schools +4.0/10.0
- Livability +3.0/5.0
- Rent growth +2.6/5.0
- Condition / age +2.5/5.0
- Appreciation +0.0/10.0
$219,500
🖨 Deal sheet 📄 Offer letter ✓ Due diligence
Listing remarks MLS
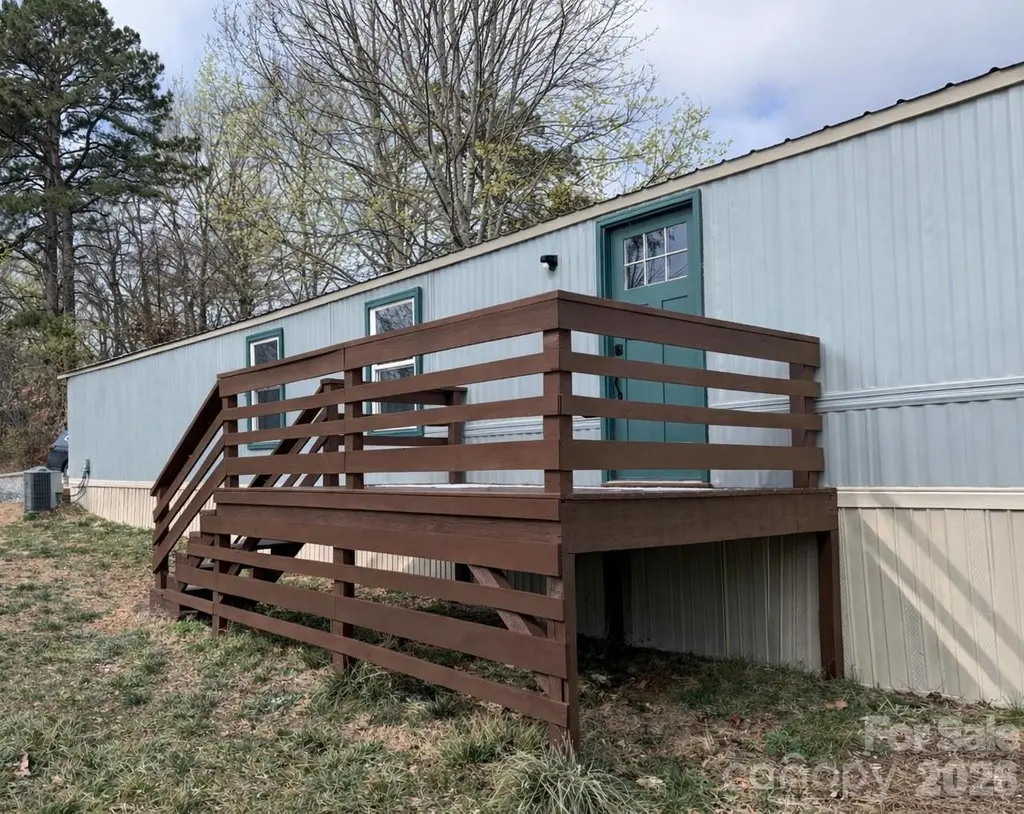
Fully renovated 1120 sqft home with 2 bedroom, 2 full bath located approximately 3.5 miles from downtown Asheville. Set on nearly half an acre with city water and private septic. Renovations include an updated kitchen and bathrooms, refreshed interior finishes, and central heat and air. Washer and dryer hookups installed. Convenient access to everyday amenities and the future Whitewater Park. Move-in ready with outdoor living space.
Key facts
- Central heat and air
- Convenient access
- Updated kitchen
Tags
Neighborhood map
What this means for you Summary
Snapshot
- This is a 2-bed/2.0-bath manufactured listed at $220k.
Deal economics
- At list price, monthly cash flow is $187 ($2k/yr) — positive.
- The deal already cash-flows at list — no discount required.
- To meet the 1% rule (rent ≥ 1% of price), the offer needs to be $216k (1.8% below list).
- Recommended offer: $200k (9.0% below list) — sets the bar for market timing.
- Cap rate 7.3% vs local median 2.7% in Woodfin — top-decile yield for the area; either an underpriced asset or a hidden risk that comps aren't pricing in. Stress-test before assuming the spread holds.
Location & tenants
- Location reads 59/100 on livability (#538 in NC) — a working-class tenant base; expect higher turnover. Strengths: housing A+, crime A-, cost of living B; Watch: schools F, amenities F, commute F.
- Buncombe County Schools (suburban): math 45% / reading 50% proficiency, ranked #72 of 178 in NC (top 40%) — families likely to look elsewhere, expect single-tenant / working-renter base with shorter leases.
- Market conditions: Rents flat; 373 active listings in the ZIP; 5 comparable units currently listed for rent nearby; rentals lingering (median 44d on market — plan ~5-8 weeks vacancy on turnover, expect pricing pressure); 80% of comp listings sitting > 30 days — soft ceiling on asking rent; solid renter incomes; 3,305 units permitted in Buncombe County in 2024 (1,855 in 5+ unit buildings).
Forward outlook
- Local home prices are declining (-3.0%/yr); year-one equity from $2k of loan paydown is wiped out by about $7k of value loss. Plan a longer hold.
- Buncombe County population projected at +24% by 2050 — long-run rental-demand tailwind backs the buy-and-hold thesis.
Negotiation context
- It's been on market 111 days — a 9% lower offer ($200k) is reasonable based on typical stale-listing flexibility.
- Current owner paid $145k; list at $220k implies a 51% gain — meaningful room to come down on a strong offer.
Questions for the listing agent
- It's been on market 111 days. Have you received any prior offers? Is the seller open to a 9% concession, seller financing, or rate buy-down credit?
- Why hasn't it sold? Are there any deal-killer items the seller is aware of (foundation, flood, title, zoning, code violations)?
- Is there a deadline driving the sale (1031 exchange, divorce, estate, relocation)? That informs how much negotiation room exists.
- Schools are F-rated, which usually means shorter tenancies and higher turnover. Who's the typical renter profile here, and what's been the actual vacancy rate?
- What's the average days-on-market for RENTAL listings here right now (not sales)? A rising rental-DOM trend means longer vacancies and softer asking-rent achievability than the comps imply.
- What's the recent tenant-quality profile in this submarket — average credit score on applications, eviction rate, late-payment / NSF rate, and stable-employment percentage? A property-management company in the area should have these aggregated.
- How much new for-sale + rental construction is in the pipeline within 1–3 miles? Heavy new supply typically softens prices + rents 12–24 months out; constrained supply supports both.
Investment metrics
- 1% rule
- 0.98% ✗
- Cap rate
- 7.31%
- Cash-on-cash
- 3.65%
- DSCR
- 1.16
- GRM
- 8.5
CMA / ARV
- ARV (median comp)
- $382,719
- List price
- $219,500
- Delta
- -42.65%
- Verdict
- UNDERPRICED
- Comps
- 20 within 1.0 mi
Projected returns pro-forma
-3.0% appreciation · 0.46% rent growth · sell at horizon
- IRR
- -13.5%
- Equity multiple
- 0.53×
- Total profit
- $-29,017
- Equity at exit
- $32,728
- IRR
- -9.1%
- Equity multiple
- 0.50×
- Total profit
- $-30,782
- Equity at exit
- $18,978
Cash invested: $61,460 (down + closing). Projections, not guarantees.
Landlord ↔ Tenant lean methodology
- Overall (STATE)
- 85 Strongly Landlord-Friendly
- State North Carolina
- 85 Strongly Landlord-Friendly · R+3
- County
- — inherits STATE
- City
- — inherits STATE
ZIP-level market 28804
- Rents YoY
- 0.5%
- Active inventory
- 373
- Price-to-rent
- 8.5×
Monthly cashflow live
- Estimated rent
- $2,157 high interval (Pro) →
- Mortgage (P&I)
- −$1,151
- Tax est. 1.5%
- −$274 /mo · $3,292/yr
- Insurance
- −$91
- HOA
- −$0
- Vacancy / Maint / Mgmt
- −$453
- Net cashflow
- $187
Break-even live
UW: 25.0% down · 7.5% · 30yr · 1.5% tax · 5.0% vac · 8.0% maint · 8.0% mgmt
Financing live
Cash to close
- Down payment
- $54,875
- Closing costs
- $6,585
- Reserves months
- —
- Total cash needed
- —
Loan-product check · same deal, 3 products live
Conventional
25% down · 7.5% · 30yr
- Down + closing
- —
- Monthly P&I
- —
- Monthly cashflow
- —
- DSCR
- —
- Eligible?
- —
Personal DTI + credit; lowest rate.
DSCR
20% down · 8.5% · 30yr
- Down + closing
- —
- Monthly P&I
- —
- Monthly cashflow
- —
- DSCR
- —
- Eligible?
- —
No personal income docs; deal must DSCR.
Hard money
10% down · 12.0% · 12mo
- Down + closing
- —
- Monthly P&I
- —
- Monthly cashflow
- —
- DSCR
- —
- Eligible?
- —
Short-term bridge; refi at stabilization.
Rent comps 5 comps
| Address | Beds | Baths | Sqft | Rent | $/sqft | DOM | Units | Dist |
|---|---|---|---|---|---|---|---|---|
| 5 Frankie Ln Asheville, NC | 3.0 | 1.0 | 912 | $2,500 | $2.74 | 43d | 1 | 0.51mi |
| 46 Celebration Pl Asheville, NC | 2.0 | 2.0 | 840 | $1,950 | $2.32 | 43d | 1 | 0.89mi |
| 42 Celebration Pl Asheville, NC | 3.0 | 2.0 | 1336 | $2,500 | $1.87 | 43d | 1 | 0.90mi |
| 13 Kilkenny Dr Asheville, NC | 3.0 | 1.0 | 1155 | $1,850 | $1.60 | 13d | 1 | 0.97mi |
| 33 Skyland Cir Asheville, NC | 3.0 | 1.5 | 1224 | $2,800 | $2.29 | 43d | 1 | 1.50mi |
Listing history 19 events
-
2026-06-18days on market $219,500 Active 111 DOM
-
2026-06-17days on market $219,500 Active 110 DOM
-
2026-06-16days on market $219,500 Active 109 DOM
-
2026-06-15days on market $219,500 Active 108 DOM
-
2026-06-14days on market $219,500 Active 106 DOM
-
2026-06-10days on market $219,500 Active 103 DOM
-
2026-06-09days on market $219,500 Active 102 DOM
-
2026-06-08days on market $219,500 Active 101 DOM
-
2026-06-07days on market $219,500 Active 100 DOM
-
2026-06-03days on market $219,500 Active 96 DOM
-
2026-06-02days on market $219,500 Active 95 DOM
-
2026-06-01days on market $219,500 Active 94 DOM
-
2026-05-31days on market $219,500 Active 93 DOM
-
2026-05-30days on market $219,500 Active 92 DOM
-
2026-03-16price $226,000 436-char remark
Show marketing remark (436 chars)
Fully renovated 1120 sqft home with 2 bedroom, 2 full bath located approximately 3.5 miles from downtown Asheville. Set on nearly half an acre with city water and private septic. Renovations include an updated kitchen and bathrooms, refreshed interior finishes, and central heat and air. Washer and dryer hookups installed. Convenient access to everyday amenities and the future Whitewater Park. Move-in ready with outdoor living space.
-
2026-02-27$232,500 Active 436-char remark
Show marketing remark (436 chars)
Fully renovated 1120 sqft home with 2 bedroom, 2 full bath located approximately 3.5 miles from downtown Asheville. Set on nearly half an acre with city water and private septic. Renovations include an updated kitchen and bathrooms, refreshed interior finishes, and central heat and air. Washer and dryer hookups installed. Convenient access to everyday amenities and the future Whitewater Park. Move-in ready with outdoor living space.
-
2025-09-16soldstatus $145,000
-
2012-01-05soldstatus $70,000
-
2007-02-16soldstatus $40,000
ⓘ Source: listings_history table (triggers on properties + properties_extension) + one-shot
backfill from property_details.listing_events for pre-trigger history.
Climate risk First Street
- Flood 1/10 Low FEMA zone X (unshaded) · 0% chance over 30 yrs
- Wildfire 4/10 Moderate
- Heat 4/10 Moderate 7 d/yr ≥98°F today · 19 d/yr by 30 yrs out
- Wind 2/10 Low
- Air quality 3/10 Moderate 2 unhealthy d/yr today · 2 by 30 yrs out
Nearby sold comps map
Loading sold comps map…
Walkable amenities ~0.75 mi
Loading nearby amenities…
Taxation est. · year 1
- Rental income
- $25,878
- − Mortgage interest
- −$12,295
- − Property taxes
- −$3,292
- − Insurance
- −$1,098
- − Repairs & maintenance
- −$2,070
- − Management
- −$2,070
- − Depreciation
- −$6,385
- Taxable loss
- −$1,333
- Est. tax savings @ 24.0%
- +$320
- After-tax cash flow
- $2,561/yr
For passive investors: Depreciation is non-cash, so a rental often shows a tax loss while cash-flowing — sheltering income. Rental losses are passive: they offset passive income freely, and up to $25,000/yr can offset ordinary (W-2) income if you actively participate and your MAGI is under $100k (phasing out to $0 by $150k); unused losses carry forward. On sale, claimed depreciation is recaptured at up to 25%, and gains may owe capital-gains tax (a 1031 exchange can defer both). Figures are a year-1 estimate at your 24.0% rate — not tax advice; consult a CPA.
Schools (NCES district)
- District
- Buncombe County Schools
- NCES district ID
- 3700450
- Math proficiency
- 45% ▬ 0.00%
- Reading proficiency
- 50% ▲ 2.00%
- Median HH income
- $45,981
- Composite
- 40.32/100
- National rank
- #3749
- State rank
- #72 of 178 in NC
Livability — Woodfin
- Score
- 59/100
- State rank
- #538
- US rank
- #19731
Category grades
Schools grade is shown separately in the Schools card above.
Census & demographics
- Census place
- Woodfin, NC
- County
- Buncombe County · 241,085 people
- Metro
- Asheville, NC
- Population (ZIP)
- 25,776
- Household income
- $88,312
- Rent vs Own
- Severe rent burden
- 396.0
Population outlook (Buncombe County) Hauer SSP2
- Today (2025)
- 286,475 people
- By 2030
- 302,237 · +5.5%
- By 2040
- 330,687 · +15.4%
- By 2050
- 356,370 · +24.4%
- By 2075
- 409,383 · +42.9%
- By 2100
- 437,270 · +52.6%
Race, ethnicity, and origin ACS 2023
- Neighborhood character
- Predominantly White (82%)
- Race & ethnicity
- White 82% Two or more races 9% Hispanic / Latino 8% Black 4% Asian 2%
- Hispanic origin (detail)
- Mexican 4%
- Common ancestry
- Slovak 5% Lithuanian 4% Serbian 3%
- Foreign-born
- 7% · Canada, Jamaica
- Languages at home
- 91% English-only · Spanish 6% French/Haitian/Cajun 1%
Political lean MEDSL · Buncombe
- 2024 margin
- Strong D (+24.8) · D 61.7% · R 36.9% · Other 1.4%
- 2008→2024 swing
- +10.9pp toward D · 2008: 13.9pp · 2024: 24.8pp
- All cycles
- 2024: D+24.8 2020: D+21.1 2016: D+14.6 2012: D+12.4 2008: D+13.9
Not yet ingested
- Civics
- —
Market trends
- HPI YoY
- ▼ -410.50%
- Current HPI
- 333.3821
- Rent YoY
- ▲ 0.46%
- Metro
- Asheville, NC
- State GDP YoY
- ▲ 3.28%
- F500 in state
- 26
Industry mix (Fortune 500 HQ in NC)
| Industry | F500 HQs | Revenue |
|---|---|---|
| Financial Services | 2 | $213B |
|
||
| Retail | 2 | $95B |
|
||
| Industrial Conglomerate | 1 | $38B |
|
||
| Metals / Steel | 1 | $35B |
|
||
| Utilities | 1 | $30B |
|
||
| Industrial Machinery | 1 | $19B |
|
||
Price history
+465.0% since first listed5 events — show timeline
- 2026-03-16 Price Changed $226,000 CANOPYMLS as Distributed by MLS Grid
- 2026-02-27 Listed $232,500 CANOPYMLS as Distributed by MLS Grid
- 2025-09-16 Sold (Public Records) $145,000 Public Records
- 2012-01-05 Sold (Public Records) $70,000 Public Records
- 2007-02-16 Sold (Public Records) $40,000 Public Records
Property tax history
-4.7%/yrLatest (2025): $349 · -2.9% YoY. Source: county tax records.
Cash-flow waterfall
monthlySold comps — $/sqft
last 12 mo · ≤1 miLoading sold comps…