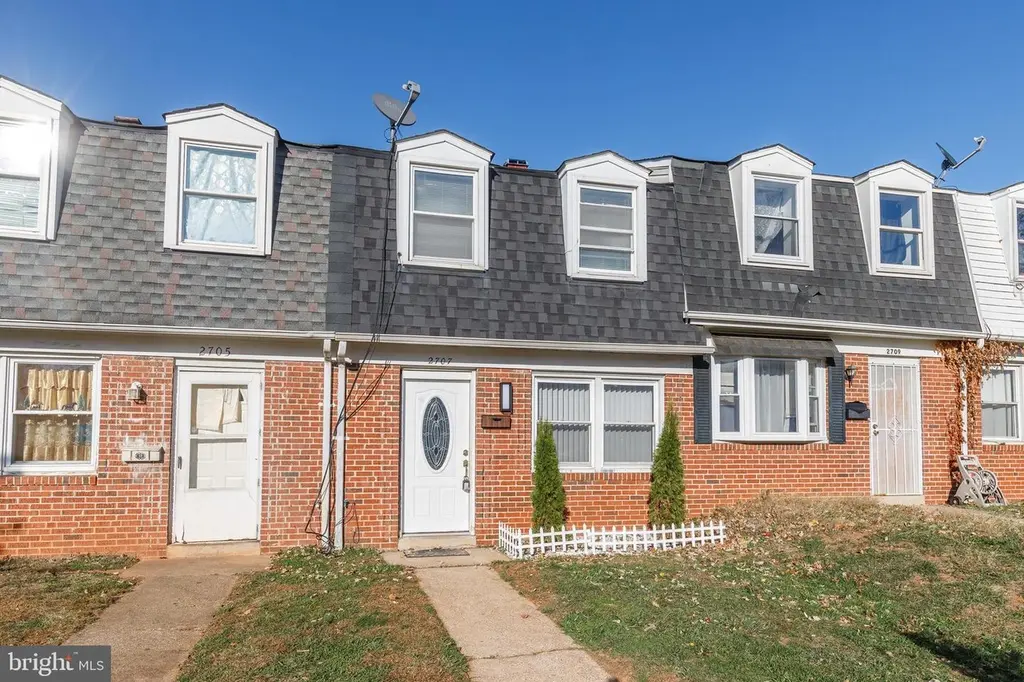
2707 Marbourne Ave · Baltimore, MD
Flood risk 1/10 · Minimal
- FEMA flood zone
- X (unshaded)
- Chance of flooding over 30 yrs
- 0.0%
- Est. flood insurance / yr
- $507 – $1,088
Fire risk 1/10 · Minimal
- Est. fire insurance / yr
- $755 – $1,403
Heat risk 8/10 · Major
- Hot days now (above 103°F)
- 7 days/yr
- Hot days in 30 yrs
- 15 days/yr
Wind risk 6/10 · Moderate
- Chance of severe wind over 30 yrs
- 27.0%
Air-quality risk 4/10 · Minor
- Unhealthy air days now
- 6 days/yr
- Unhealthy air days in 30 yrs
- 7 days/yr
Risk factors via First Street. Map © Google.
Why this score? — see what drove the D+ grade
The composite is a weighted blend of 9 inputs, each scored 0–100. Each bar is that input's sub-score; the figure is the points it added to the 100-point composite (weight × sub-score).
- Cash flow +23.5/30.0
- DSCR +7.6/10.0
- 1% rule +5.8/10.0
- Livability +3.8/5.0
- Condition / age +2.5/5.0
- ARV discount +2.4/15.0
- Rent growth +2.2/5.0
- Schools +1.0/10.0
- Appreciation +0.0/10.0
$169,900
🖨 Deal sheet 📄 Offer letter ✓ Due diligence
Listing remarks
The house was recently appraised at 176,500. A copy of the appraisal can be emailed at your request. Title work has also been completed by Swan Title. Welcome to 2707 Marbourne Ave, a charming brick townhome in Baltimore’s Lakeland community. This well-maintained home features three spacious bedrooms and a fully renovated bathroom on the upper level. Enjoy peace of mind with a new roof, new refrigerator, new stove, and new water heater — all recently updated for your convenience. Located directly across from Lakeland Elementary and Middle School, this home offers a wonderful neighborhood feel with easy access to parks, shopping, and major commuter routes. Move right in and start
Key facts
- Brick townhome
- New stove
- New water heater
Tags
Neighborhood map
What this means for you Summary
Snapshot
- This is a 3-bed/1.0-bath townhouse listed at $170k.
Deal economics
- At list price, monthly cash flow is $318 ($4k/yr) — positive.
- The deal already cash-flows at list — no discount required.
- Meets the 1% rule at list price ($2k rent vs $170k).
- Recommended offer: $167k (1.5% below list) — sets the bar for market timing.
- Cap rate 8.5% vs local median 6.0% in Baltimore — top-decile yield for the area; either an underpriced asset or a hidden risk that comps aren't pricing in. Stress-test before assuming the spread holds.
Location & tenants
- Location reads 76/100 on livability (#90 in MD, #3,396 nationally) — a middle-class / working-renter tenant base. Strengths: amenities A+, commute A+, housing A+; Watch: schools D, crime F.
- Baltimore City Public Schools (urban): math 7% / reading 16% proficiency, ranked #24 of 24 in MD (top 100%) — low school quality limits family demand, transient renter base, plan for 1-2y turnover; 79% free/reduced lunch — lower-income household profile, screen leases tightly.
- Market conditions: Rents soft (-1.0%/yr); 362 active listings in the ZIP; 19 comparable units currently listed for rent nearby; rentals at typical pace (median 18d on market — plan ~3-4 weeks tenant-placement turnaround); solid renter incomes; 1,273 units permitted in Baltimore city in 2024 (1,104 in 5+ unit buildings).
Forward outlook
- Local home prices are declining (-3.0%/yr); year-one equity from $1k of loan paydown is wiped out by about $5k of value loss. Plan a longer hold.
- Baltimore County population projected to shrink 4% by 2050 — rents likely to lag national; underwrite the cash flow, not the appreciation.
Negotiation context
- It's been on market 23 days — a 2% lower offer ($167k) is reasonable based on typical stale-listing flexibility.
- 4 sale attempts since 10y ago with the ask held roughly flat each time — persistent listings suggest the price (not the market) is what's stuck; bring a comps-based counter.
- Current owner paid $30k; list at $170k implies a 464% gain — meaningful room to come down on a strong offer.
Risks & watch-outs
- Climate carrying-cost: major wind risk, 27% chance of damaging wind over 30y; extreme-heat days projected 7→15/yr by 2055 (HVAC capex compounding) — expect insurance premiums to compound above CPI over the hold.
Questions for the listing agent
- Built in 1961 — when were the roof, HVAC, electrical panel, plumbing, and water heater last replaced?
- Is there a deadline driving the sale (1031 exchange, divorce, estate, relocation)? That informs how much negotiation room exists.
- Schools are D-rated, which usually means shorter tenancies and higher turnover. Who's the typical renter profile here, and what's been the actual vacancy rate?
- Crime grade is F in this area — have there been break-ins, vandalism, or insurance claims at this property in the last 3 years? What carrier currently insures it and at what premium?
- The area grade is low — what's the realistic commute time and amenity access for the typical tenant pool here? Any planned neighborhood developments (good or bad) we should know about?
- What's the average days-on-market for RENTAL listings here right now (not sales)? A rising rental-DOM trend means longer vacancies and softer asking-rent achievability than the comps imply.
- What's the recent tenant-quality profile in this submarket — average credit score on applications, eviction rate, late-payment / NSF rate, and stable-employment percentage? A property-management company in the area should have these aggregated.
- How much new for-sale + rental construction is in the pipeline within 1–3 miles? Heavy new supply typically softens prices + rents 12–24 months out; constrained supply supports both.
Investment metrics
- 1% rule
- 1.08% ✓
- Cap rate
- 8.54%
- Cash-on-cash
- 8.02%
- DSCR
- 1.36
- GRM
- 7.7
CMA / ARV
- ARV (on-the-fly)
- $152,576
- Comps found
- 12
Show comp detail 12 sales within ~0.75 mi
| Address | Dist | Beds/Ba | Sqft | Sold | Price | $/sf | Match |
|---|---|---|---|---|---|---|---|
| 2707 Marbourne Ave | 0.00mi | 3/1.0 | 1,024 (0%) | 1mo | $176,500 | $172 | 99 |
| 2839 Hinsdale Dr | 0.21mi | 3/1.0 | 1,024 (0%) | 4mo | $152,000 | $148 | 86 |
| 2557 Southdene Ave | 0.23mi | 3/1.0 | 1,024 (0%) | 6mo | $155,000 | $151 | 84 |
| 2628 Northshire Dr | 0.27mi | 3/1.0 | 1,024 (0%) | 4mo | $175,000 | $171 | 84 |
| 2619 Northshire Dr | 0.31mi | 3/1.0 | 1,024 (0%) | 2mo | $145,000 | $142 | 84 |
| 3025 Mallview Rd | 0.14mi | 3/2.0 | 1,024 (0%) | 7mo | $138,500 | $135 | 83 |
| 2704 Marbourne Ave | 0.03mi | 4/2.5 (+1) | 1,024 (0%) | 6mo | $240,000 | $234 | 83 |
| 2639 Northshire Dr | 0.29mi | 3/2.0 | 1,024 (0%) | 5mo | $120,000 | $117 | 78 |
| 3034 Lorena Ave | 0.53mi | 3/1.0 | 1,024 (0%) | 1mo | $153,000 | $149 | 74 |
| 2630 Alaska St | 0.66mi | 3/1.5 | 1,008 (-2%) | 7mo | $85,000 | $84 | 58 |
| 2521 S Paca St | 0.69mi | 3/1.5 | 1,152 (+12%) | 1mo | $30,000 | $26 | 44 |
| 2439 Ridgely St | 0.68mi | 4/2.5 (+1) | 1,152 (+12%) | 4mo | $222,000 | $193 | 33 |
Match score weights: distance 35% · size 25% · config 20% · recency 20%. Top-matched comps best support the ARV.
Projected returns pro-forma
-3.0% appreciation · 0.0% rent growth · sell at horizon
- IRR
- -7.4%
- Equity multiple
- 0.73×
- Total profit
- $-12,659
- Equity at exit
- $25,333
- IRR
- -2.0%
- Equity multiple
- 0.88×
- Total profit
- $-5,733
- Equity at exit
- $14,690
Cash invested: $47,572 (down + closing). Projections, not guarantees.
Landlord ↔ Tenant lean methodology
- Overall (CITY)
- 12 Strongly Tenant-Friendly
- State Maryland
- 27 Tenant-Leaning · D+14
- County
- — inherits STATE
- City Baltimore
- 12 Strongly Tenant-Friendly · D+58
ZIP-level market 21230
- Rents YoY
- -1.0%
- Active inventory
- 362
- Price-to-rent
- 7.7×
Monthly cashflow live
- Estimated rent
- $1,836 high interval (Pro) →
- Mortgage (P&I)
- −$891
- Tax from tax record
- −$171 /mo · $2,049/yr
- Insurance
- −$71
- HOA
- −$0
- Vacancy / Maint / Mgmt
- −$386
- Net cashflow
- $318
Break-even live
UW: 25.0% down · 7.5% · 30yr · 1.5% tax · 5.0% vac · 8.0% maint · 8.0% mgmt
Financing live
Cash to close
- Down payment
- $42,475
- Closing costs
- $5,097
- Reserves months
- —
- Total cash needed
- —
Loan-product check · same deal, 3 products live
Conventional
25% down · 7.5% · 30yr
- Down + closing
- —
- Monthly P&I
- —
- Monthly cashflow
- —
- DSCR
- —
- Eligible?
- —
Personal DTI + credit; lowest rate.
DSCR
20% down · 8.5% · 30yr
- Down + closing
- —
- Monthly P&I
- —
- Monthly cashflow
- —
- DSCR
- —
- Eligible?
- —
No personal income docs; deal must DSCR.
Hard money
10% down · 12.0% · 12mo
- Down + closing
- —
- Monthly P&I
- —
- Monthly cashflow
- —
- DSCR
- —
- Eligible?
- —
Short-term bridge; refi at stabilization.
Rent comps 19 comps
| Address | Beds | Baths | Sqft | Rent | $/sqft | DOM | Units | Dist |
|---|---|---|---|---|---|---|---|---|
| 2200 W Patapsco Ave Baltimore, MD | 3.0 | 1.0 | 890 | $1,569 | $1.76 | 43d | 1 | 0.16mi |
| 3004 Elizabeth Ave Unit 1 Baltimore, MD | 3.0 | 1.0 | 1024 | $1,395 | $1.36 | 4d | 1 | 0.42mi |
| 2600 W Patapsco Ave Baltimore, MD | 1.0–2.0 | 1.0 | 856 | $1,309 | $1.53 | 2d | 24 | 0.43mi |
| 3017 Janice Ave Baltimore, MD | 3.0 | 1.0 | 1024 | $1,995 | $1.95 | 23d | 1 | 0.45mi |
| 2056 Griffis Ave Baltimore, MD | 3.0 | 1.5 | 1230 | $1,495 | $1.22 | 21d | 1 | 0.94mi |
| 2745 Round Rd Brooklyn, MD | 2.0 | 2.0 | 756 | $1,800 | $2.38 | 43d | 1 | 0.94mi |
| 2454 Terra Firma Rd Brooklyn, MD | 3.0 | 1.0 | 1024 | $1,650 | $1.61 | 14d | 1 | 1.01mi |
| 902 Catawba Ct Halethorpe, MD | 3.0 | 1.0 | 906 | $1,495 | $1.65 | 21d | 1 | 1.04mi |
| 1931 Griffis Ave Baltimore, MD | 2.0 | 1.0 | 912 | $1,349 | $1.48 | 3d | 1 | 1.06mi |
| 3111 Bero Rd Halethorpe, MD | 3.0 | 2.0 | 1024 | $1,750 | $1.71 | 43d | 1 | 1.09mi |
| 3010 Alabama Ave Halethorpe, MD | 2.0 | 1.0 | 900 | $2,200 | $2.44 | 17d | 1 | 1.11mi |
| 607 Cheraton Rd Brooklyn, MD | 3.0 | 3.0 | 1200 | $1,750 | $1.46 | 14d | 1 | 1.12mi |
| 1708 Hall Ave Unit 2 Halethorpe, MD | 2.0 | 1.0 | 845 | $1,625 | $1.92 | 11d | 1 | 1.29mi |
| 2715 Hammonds Ferry Rd Halethorpe, MD | 2.0 | 1.0 | 992 | $1,500 | $1.51 | 43d | 1 | 1.29mi |
| 2868 Potee St Baltimore, MD | 1.0–3.0 | 1.0 | 720 | $1,599 | $2.22 | 2d | 22 | 1.41mi |
| 4369 Hollins Ferry Rd Halethorpe, MD | 3.0 | 1.0 | 1152 | $1,900 | $1.65 | 43d | 1 | 1.42mi |
| 3167 Ryerson Cir Halethorpe, MD | 3.0 | 1.5 | 1116 | $1,995 | $1.79 | 4d | 1 | 1.43mi |
| 3269 Ryerson Cir Halethorpe, MD | 3.0 | 2.0 | 1303 | $1,700 | $1.30 | 10d | 1 | 1.44mi |
| 511 Seagull Ave Brooklyn, MD | 2.0 | 1.0 | 756 | $1,550 | $2.05 | 23d | 1 | 1.45mi |
Listing history 15 events
-
2026-04-10status Pending
-
2026-04-02price $169,900
-
2026-03-18$173,000 Active
-
2026-02-19status Pending
-
2026-02-19historical
-
2026-01-06$170,000 Active
-
2026-01-06historical
-
2025-12-01price $179,000
-
2025-11-18$185,000 Active
-
2025-11-13historical
-
2016-12-15soldstatus $30,150
-
2016-12-07soldstatus $30,150 Sold
-
2016-11-07status Contract
-
2016-10-28$27,000 Active
-
1988-01-07soldstatus $37,000
ⓘ Source: listings_history table (triggers on properties + properties_extension) + one-shot
backfill from property_details.listing_events for pre-trigger history.
Tax reassessment forecast MD · Partial reset (capped growth)
- Current annual tax
- $2,049 · $171/mo
- Projected year-2 tax
- $2,049 · $171/mo
- Expected delta
- $0/yr ($0/mo · 0.0%)
ⓘ Screening estimate from a state-policy table — verify with the county assessor before closing.
Climate risk First Street
- Flood 1/10 Low FEMA zone X (unshaded) · 0% chance over 30 yrs
- Wildfire 1/10 Low
- Heat 8/10 Severe 7 d/yr ≥103°F today · 15 d/yr by 30 yrs out
- Wind 6/10 Major 27% chance of damaging wind over 30 yrs
- Air quality 4/10 Moderate 6 unhealthy d/yr today · 7 by 30 yrs out
Nearby sold comps map
Loading sold comps map…
Walkable amenities ~0.75 mi
Loading nearby amenities…
Taxation est. · year 1
- Rental income
- $22,032
- − Mortgage interest
- −$9,517
- − Property taxes
- −$2,049
- − Insurance
- −$850
- − Repairs & maintenance
- −$1,763
- − Management
- −$1,763
- − Depreciation
- −$4,943
- Taxable income
- $1,149
- Est. tax owed @ 24.0%
- −$276
- After-tax cash flow
- $3,540/yr
For passive investors: Depreciation is non-cash, so a rental often shows a tax loss while cash-flowing — sheltering income. Rental losses are passive: they offset passive income freely, and up to $25,000/yr can offset ordinary (W-2) income if you actively participate and your MAGI is under $100k (phasing out to $0 by $150k); unused losses carry forward. On sale, claimed depreciation is recaptured at up to 25%, and gains may owe capital-gains tax (a 1031 exchange can defer both). Figures are a year-1 estimate at your 24.0% rate — not tax advice; consult a CPA.
Schools (NCES district)
- District
- Baltimore City Public Schools
- NCES district ID
- 2400090
- Math proficiency
- 7% ▼ -9.00%
- Reading proficiency
- 16% ▼ -5.00%
- Median HH income
- $42,108
- Composite
- 10.08/100
- National rank
- #9805
- State rank
- #24 of 24 in MD
Livability — Baltimore
- Score
- 76/100
- State rank
- #90
- US rank
- #3396
Category grades
Schools grade is shown separately in the Schools card above.
Census & demographics
- Census place
- Baltimore, MD
- County
- Baltimore City · 558,601 people
- City population
- 588,727
- Metro
- Baltimore-Columbia-Towson, MD
- Population (ZIP)
- 32,977
- Household income
- $91,842
- Rent vs Own
- Severe rent burden
- 1463.0
Population outlook (Baltimore County) Hauer SSP2
- Today (2025)
- 624,249 people
- By 2030
- 621,541 · -0.4%
- By 2040
- 609,756 · -2.3%
- By 2050
- 597,249 · -4.3%
- By 2075
- 552,236 · -11.5%
- By 2100
- 513,934 · -17.7%
Race, ethnicity, and origin ACS 2023
- Neighborhood character
- Diverse neighborhood (Simpson 0.63)
- Race & ethnicity
- White 55% Black 23% Hispanic / Latino 13% Two or more races 6% Asian 4%
- Hispanic origin (detail)
- Mexican 1% Puerto Rican 1%
- Common ancestry
- Romanian 5% Lithuanian 2% Italian 2%
- Foreign-born
- 10% · Canada, China
- Languages at home
- 85% English-only · Spanish 9% Other Indo-European 1% Other Asian/Pacific 1%
Political lean MEDSL · Baltimore
- 2024 margin
- Solid D (+73.0) · D 85.2% · R 12.2% · Other 2.6%
- 2008→2024 swing
- -2.5pp toward R · 2008: 75.5pp · 2024: 73.0pp
- All cycles
- 2024: D+73.0 2020: D+76.6 2016: D+74.6 2012: D+76.4 2008: D+75.5
Not yet ingested
- Civics
- —
Market trends
- HPI YoY
- ▼ -311.43%
- Current HPI
- 284.338
- Rent YoY
- ▼ -1.00%
- Metro
- Baltimore-Columbia-Towson, MD
- State GDP YoY
- ▲ 2.97%
- F500 in state
- 12
Industry mix (Fortune 500 HQ in MD)
| Industry | F500 HQs | Revenue |
|---|---|---|
| Aerospace / Defense | 1 | $71B |
|
||
| Utilities | 1 | $25B |
|
||
| Hotels | 1 | $24B |
|
||
| Consumer Goods | 1 | $7B |
|
||
| Real Estate | 1 | $6B |
|
||
| Chemicals | 1 | $2B |
|
||
Price history
+359.2% since first listed15 events — show timeline
- 2026-04-10 Pending — BRIGHT MLS
- 2026-04-02 Price Changed $169,900 BRIGHT MLS
- 2026-03-18 Listed $173,000 BRIGHT MLS
- 2026-02-19 Pending — BRIGHT MLS
- 2026-02-19 Listing Removed — BRIGHT MLS
- 2026-01-06 Listing Removed — BRIGHT MLS
- 2026-01-06 Listed $170,000 BRIGHT MLS
- 2025-12-01 Price Changed $179,000 BRIGHT MLS
- 2025-11-18 Listed $185,000 BRIGHT MLS
- 2025-11-13 Coming Soon — BRIGHT MLS
- 2016-12-15 Sold (MLS) $30,150 BRIGHT MLS
- 2016-12-07 Sold (MLS) $30,150 MRIS
- 2016-11-07 Pending — MRIS
- 2016-10-28 Listed $27,000 MRIS
- 1988-01-07 Sold (Public Records) $37,000 Public Records
Property tax history
+0.3%/yrLatest (2025): $2,049 · +8.3% YoY. Source: county tax records.
Cash-flow waterfall
monthlySold comps — $/sqft
last 12 mo · ≤1 miLoading sold comps…