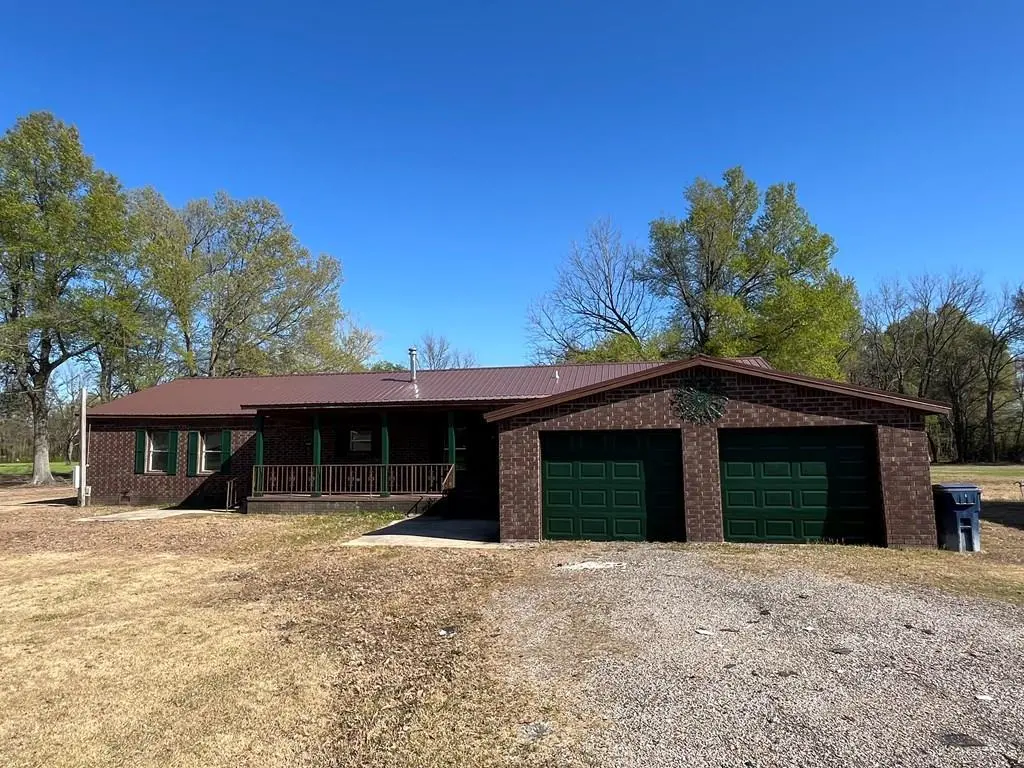
719 Jackson St · Madison, AR
Flood risk 7/10 · Major
- FEMA flood zone
- X
- Chance of flooding over 30 yrs
- 0.76%
- Est. flood insurance / yr
- $507 – $1,088
Fire risk 2/10 · Minimal
- Est. fire insurance / yr
- $1,499 – $2,785
Heat risk 6/10 · Moderate
- Hot days now (above 109°F)
- 7 days/yr
- Hot days in 30 yrs
- 21 days/yr
Wind risk 4/10 · Minor
- Chance of severe wind over 30 yrs
- 15.0%
Air-quality risk 1/10 · Minimal
- Unhealthy air days now
- 0 days/yr
- Unhealthy air days in 30 yrs
- 0 days/yr
Risk factors via First Street. Map © Google.
Why this score? — see what drove the C- grade
The composite is a weighted blend of 9 inputs, each scored 0–100. Each bar is that input's sub-score; the figure is the points it added to the 100-point composite (weight × sub-score).
- Cash flow +16.7/30.0
- ARV discount +15.0/15.0
- DSCR +5.2/10.0
- Appreciation +5.0/10.0
- 1% rule +3.2/10.0
- Livability +3.0/5.0
- Rent growth +2.5/5.0
- Condition / age +2.5/5.0
- Schools +0.9/10.0
$140,000
🖨 Deal sheet 📄 Offer letter ✓ Due diligence
Listing remarks MLS
Welcome to this spacious and beautifully maintained brick home, perfectly situated on 2.5 peaceful acres in a quiet neighborhood. With over 2,000 square feet of living space, this one-story gem offers a thoughtful layout designed for comfort and versatility. Inside, you'll find three generously sized bedrooms and three full bathrooms, providing ample space for family or guests. The home features a formal dining room, a cozy living area, a den, and a versatile bonus room—ideal for a home office, playroom, or guest suite. Luxury vinyl plank flooring adds a modern touch throughout. The large two-car garage offers added convenience, while the expansive yard and charming gazebo create a perfect setting for outdoor dining, entertaining, or simply relaxing in the serene surroundings. Don't miss the opportunity to make this property your own—schedule your private showing today!
Key facts
- 2.5 peaceful acres
- Formal dining room
- Cozy living area
Tags
Neighborhood map
What this means for you Summary
Snapshot
- This is a 3-bed/2.0-bath manufactured listed at $140k.
Deal economics
- At list price, monthly cash flow is $22 ($258/yr) — positive.
- The deal already cash-flows at list — no discount required.
- To meet the 1% rule (rent ≥ 1% of price), the offer needs to be $115k (17.5% below list).
- Recommended offer: $115k (17.5% below list) — sets the bar for 1% rule.
Location & tenants
- Location reads 59/100 on livability (#307 in AR) — a working-class tenant base; expect higher turnover. Strengths: cost of living A+; Watch: housing D+, schools F, amenities F.
- Forrest City School District (town): math 12% / reading 11% proficiency, ranked #230 of 238 in AR (top 97%) — low school quality limits family demand, transient renter base, plan for 1-2y turnover; 93% free/reduced lunch — lower-income household profile, screen leases tightly.
- Market conditions: 1 active listings in the ZIP; 3 units permitted in St. Francis County in 2024 (0 in 5+ unit buildings).
Forward outlook
- In year one you build about $5k of equity ($968 loan paydown + $4k appreciation (3.0% local appreciation)).
- St. Francis County population projected at -21% by 2050 — secular population decline; favor cash flow + early exit over multi-decade hold.
- At projected returns (3.0% appreciation + 3.0% rent growth), your $39k cash investment doubles in ~6 years — after that, you're playing with house money.
- By year 7, paydown + projected appreciation supports a ~$33k cash-out refi (75% LTV) — recoverable capital for the next deal without selling this one.
Negotiation context
- It's been on market 319 days — a 12% lower offer ($123k) is reasonable based on typical stale-listing flexibility.
- 4 sale attempts since 2y ago with the ask held roughly flat each time — persistent listings suggest the price (not the market) is what's stuck; bring a comps-based counter.
Risks & watch-outs
- Watch-outs: flood insurance adds $66/mo.
- Climate carrying-cost: major flood risk; extreme-heat days projected 7→21/yr by 2055 (HVAC capex compounding) — expect insurance premiums to compound above CPI over the hold.
Questions for the listing agent
- It's been on market 319 days. Have you received any prior offers? Is the seller open to a 18% concession, seller financing, or rate buy-down credit?
- What's the actual annual flood-insurance premium (NFIP or private), and is the property in a SFHA with mandatory coverage?
- Why hasn't it sold? Are there any deal-killer items the seller is aware of (foundation, flood, title, zoning, code violations)?
- Is there a deadline driving the sale (1031 exchange, divorce, estate, relocation)? That informs how much negotiation room exists.
- Schools are F-rated, which usually means shorter tenancies and higher turnover. Who's the typical renter profile here, and what's been the actual vacancy rate?
- What's the average days-on-market for RENTAL listings here right now (not sales)? A rising rental-DOM trend means longer vacancies and softer asking-rent achievability than the comps imply.
- What's the recent tenant-quality profile in this submarket — average credit score on applications, eviction rate, late-payment / NSF rate, and stable-employment percentage? A property-management company in the area should have these aggregated.
- How much new for-sale + rental construction is in the pipeline within 1–3 miles? Heavy new supply typically softens prices + rents 12–24 months out; constrained supply supports both.
Investment metrics
- 1% rule
- 0.82% ✗
- Cap rate
- 7.05%
- Cash-on-cash
- 2.69%
- DSCR
- 1.12
- GRM
- 10.1
CMA / ARV
- ARV (median comp)
- $227,072
- List price
- $140,000
- Delta
- -38.35%
- Verdict
- UNDERPRICED
- Comps
- 7 within 2.0 mi
Projected returns pro-forma
3.0% appreciation · 3.0% rent growth · sell at horizon
- IRR
- 8.1%
- Equity multiple
- 1.46×
- Total profit
- $18,206
- Equity at exit
- $62,950
- IRR
- 10.7%
- Equity multiple
- 2.60×
- Total profit
- $62,871
- Equity at exit
- $97,014
Cash invested: $39,200 (down + closing). Projections, not guarantees.
Landlord ↔ Tenant lean methodology
- Overall (STATE)
- 92 Strongly Landlord-Friendly
- State Arkansas
- 92 Strongly Landlord-Friendly · R+14
- County
- — inherits STATE
- City
- — inherits STATE
ZIP-level market 72359
- Active inventory
- 1
- Price-to-rent
- 10.1×
Monthly cashflow live
- Estimated rent
- $1,155 medium interval (Pro) →
- Mortgage (P&I)
- −$734
- Tax from tax record
- −$32 /mo · $380/yr
- Insurance
- −$58
- Flood insurance flood zone
- −$66 /mo · $798/yr
- HOA
- −$0
- Vacancy / Maint / Mgmt
- −$242
- Net cashflow
- $22
Break-even live
UW: 25.0% down · 7.5% · 30yr · 1.5% tax · 5.0% vac · 8.0% maint · 8.0% mgmt
Financing live
Cash to close
- Down payment
- $35,000
- Closing costs
- $4,200
- Reserves months
- —
- Total cash needed
- —
Loan-product check · same deal, 3 products live
Conventional
25% down · 7.5% · 30yr
- Down + closing
- —
- Monthly P&I
- —
- Monthly cashflow
- —
- DSCR
- —
- Eligible?
- —
Personal DTI + credit; lowest rate.
DSCR
20% down · 8.5% · 30yr
- Down + closing
- —
- Monthly P&I
- —
- Monthly cashflow
- —
- DSCR
- —
- Eligible?
- —
No personal income docs; deal must DSCR.
Hard money
10% down · 12.0% · 12mo
- Down + closing
- —
- Monthly P&I
- —
- Monthly cashflow
- —
- DSCR
- —
- Eligible?
- —
Short-term bridge; refi at stabilization.
Listing history 24 events
-
2026-06-19days on market $140,000 Active 319 DOM
-
2026-06-18days on market $140,000 Active 318 DOM
-
2026-06-17days on market $140,000 Active 317 DOM
-
2026-06-16days on market $140,000 Active 316 DOM
-
2026-06-15days on market $140,000 Active 315 DOM
-
2026-06-14days on market $140,000 Active 313 DOM
-
2026-06-12days on market $140,000 Active 312 DOM
-
2026-06-09days on market $140,000 Active 309 DOM
-
2026-06-08days on market $140,000 Active 308 DOM
-
2026-06-07days on market $140,000 Active 307 DOM
-
2026-06-07days on market $140,000 Active 306 DOM
-
2026-06-04days on market $140,000 Active 303 DOM
-
2026-06-02days on market $140,000 Active 302 DOM
-
2026-06-01days on market $140,000 Active 301 DOM
-
2026-05-31days on market $140,000 Active 300 DOM
-
2026-05-31days on market $140,000 Active 299 DOM
-
2025-08-04$140,000 Active 894-char remark
Show marketing remark (894 chars)
Welcome to this spacious and beautifully maintained brick home, perfectly situated on 2.5 peaceful acres in a quiet neighborhood. With over 2,000 square feet of living space, this one-story gem offers a thoughtful layout designed for comfort and versatility. Inside, you'll find three generously sized bedrooms and three full bathrooms, providing ample space for family or guests. The home features a formal dining room, a cozy living area, a den, and a versatile bonus room—ideal for a home office, playroom, or guest suite. Luxury vinyl plank flooring adds a modern touch throughout. The large two-car garage offers added convenience, while the expansive yard and charming gazebo create a perfect setting for outdoor dining, entertaining, or simply relaxing in the serene surroundings. Don't miss the opportunity to make this property your own—schedule your private showing today!
-
2025-05-16status Active
-
2025-03-16status Pending
-
2024-11-24price $140,000
-
2024-11-19$150,000 Active
-
2024-06-28price $150,000
-
2024-06-07price $171,000
-
2024-04-07$180,000 Active
ⓘ Source: listings_history table (triggers on properties + properties_extension) + one-shot
backfill from property_details.listing_events for pre-trigger history.
Tax reassessment forecast AR · Resets to sale price
- Current annual tax
- $380 · $32/mo
- Projected year-2 tax
- $896 · $75/mo
- Expected delta
- +$516/yr (+$43/mo · 135.6%)
ⓘ Screening estimate from a state-policy table — verify with the county assessor before closing.
Climate risk First Street
- Flood 7/10 Severe FEMA zone X · 76% chance over 30 yrs
- Wildfire 2/10 Low
- Heat 6/10 Major 7 d/yr ≥109°F today · 21 d/yr by 30 yrs out
- Wind 4/10 Moderate 15% chance of damaging wind over 30 yrs
- Air quality 1/10 Low 0 unhealthy d/yr today · 0 by 30 yrs out
Nearby sold comps map
Loading sold comps map…
Walkable amenities ~0.75 mi
Loading nearby amenities…
Taxation est. · year 1
- Rental income
- $13,856
- − Mortgage interest
- −$7,842
- − Property taxes
- −$380
- − Insurance
- −$1,498
- − Repairs & maintenance
- −$1,108
- − Management
- −$1,108
- − Depreciation
- −$4,073
- Taxable loss
- −$2,154
- Est. tax savings @ 24.0%
- +$517
- After-tax cash flow
- $775/yr
For passive investors: Depreciation is non-cash, so a rental often shows a tax loss while cash-flowing — sheltering income. Rental losses are passive: they offset passive income freely, and up to $25,000/yr can offset ordinary (W-2) income if you actively participate and your MAGI is under $100k (phasing out to $0 by $150k); unused losses carry forward. On sale, claimed depreciation is recaptured at up to 25%, and gains may owe capital-gains tax (a 1031 exchange can defer both). Figures are a year-1 estimate at your 24.0% rate — not tax advice; consult a CPA.
Schools (NCES district)
- District
- Forrest City School District
- NCES district ID
- 0506270
- Math proficiency
- 12% ▼ -8.00%
- Reading proficiency
- 11% ▼ -7.00%
- Median HH income
- $31,153
- Composite
- 9.07/100
- National rank
- #9871
- State rank
- #230 of 238 in AR
Livability — Madison
- Score
- 59/100
- State rank
- #307
- US rank
- #20578
Category grades
Schools grade is shown separately in the Schools card above.
Census & demographics
- Census place
- Madison, AR
- City population
- 201
- Population (ZIP)
- 201
Population outlook (St. Francis County) Hauer SSP2
- Today (2025)
- 24,387 people
- By 2030
- 23,269 · -4.6%
- By 2040
- 21,122 · -13.4%
- By 2050
- 19,281 · -20.9%
- By 2075
- 15,222 · -37.6%
- By 2100
- 11,449 · -53.1%
Race, ethnicity, and origin ACS 2023
- Neighborhood character
- Predominantly Black (96%)
- Race & ethnicity
- Black 96% Hispanic / Latino 4%
- Foreign-born
- 4% · Canada
Political lean MEDSL · St. Francis
- 2024 margin
- Toss-up / Even · D 49.4% · R 48.6% · Other 2.0%
- 2008→2024 swing
- -15.8pp toward R · 2008: 16.5pp · 2024: 0.7pp
- All cycles
- 2024: D+0.7 2020: D+5.1 2016: D+11.3 2012: D+17.0 2008: D+16.5
Not yet ingested
- Civics
- —
Market trends
- HPI YoY
- —
- Current HPI
- —
- Rent YoY
- —
- Metro
- —
- State GDP YoY
- ▲ 3.80%
- F500 in state
- 10
Industry mix (Fortune 500 HQ in AR)
| Industry | F500 HQs | Revenue |
|---|---|---|
| Retail | 1 | $681B |
|
||
| Food / Agriculture | 1 | $53B |
|
||
| Retail / Energy | 1 | $22B |
|
||
| Transportation / Logistics | 1 | $12B |
|
||
| Energy | 1 | $4B |
|
||
Price history
-22.2% since first listed8 events — show timeline
- 2025-08-04 Listed $140,000 EARA
- 2025-05-16 Relisted — EARA
- 2025-03-16 Pending — EARA
- 2024-11-24 Price Changed $140,000 EARA
- 2024-11-19 Listed $150,000 EARA
- 2024-06-28 Price Changed $150,000 EARA
- 2024-06-07 Price Changed $171,000 EARA
- 2024-04-07 Listed $180,000 EARA
Property tax history
+26.8%/yrLatest (2025): $380 · -2.1% YoY. Source: county tax records.
Cash-flow waterfall
monthlySold comps — $/sqft
last 12 mo · ≤1 miLoading sold comps…