 🏷️ Likely Rental
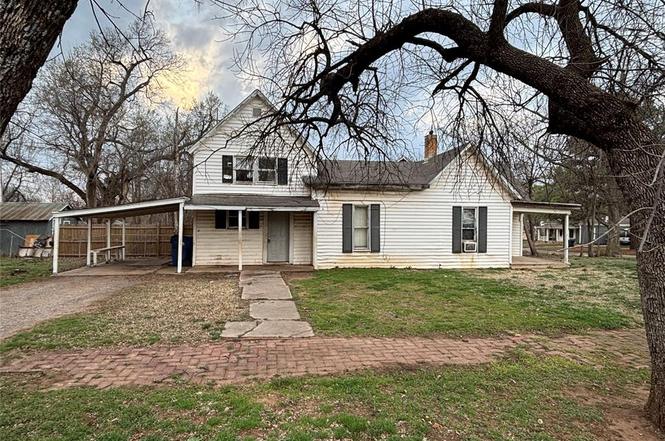
521 E Vilas Ave · Guthrie, OK
Flood risk 1/10 · Minimal
- FEMA flood zone
- X (unshaded)
- Chance of flooding over 30 yrs
- 0.0%
- Est. flood insurance / yr
- $507 – $1,088
Fire risk 5/10 · Moderate
- Est. fire insurance / yr
- $2,463 – $4,575
Heat risk 6/10 · Moderate
- Hot days now (above 109°F)
- 7 days/yr
- Hot days in 30 yrs
- 19 days/yr
Wind risk 2/10 · Minimal
- Chance of severe wind over 30 yrs
- 3.0%
Air-quality risk 2/10 · Minimal
- Unhealthy air days now
- 2 days/yr
- Unhealthy air days in 30 yrs
- 2 days/yr
Risk factors via First Street. Map © Google.
Why this score? — see what drove the B grade
The composite is a weighted blend of 9 inputs, each scored 0–100. Each bar is that input's sub-score; the figure is the points it added to the 100-point composite (weight × sub-score).
- Cash flow +30.0/30.0
- 1% rule +10.0/10.0
- DSCR +10.0/10.0
- ARV discount +7.5/15.0
- Rent growth +5.0/5.0
- Livability +3.7/5.0
- Condition / age +2.5/5.0
- Schools +2.1/10.0
- Appreciation +0.0/10.0
$67,000
🖨 Deal sheet (PDF) 📄 Offer letter ✓ Due diligence
Listing remarks
Long term investment property. Tenant moved out. come look at your next investment / flip opportunity!
Key facts
- 8,712 sq ft lot
- Built 1930
- Listed 100 days
Property features AI
Finance
- Other: Homestead exempt; Vacant and ready for occupancy; Corner lot approximately 0.2 acre; Directions: Traveling North on Division turn right onto E Springer Ave. Travel a few blocks and turn left onto Elm St. Property will be on left hand side.
- Financial info: Property is not assumable; Loan qualification unknown; Taxes reported (amount provided to agents only)
- HOA & community: No mandatory association dues
Exterior
- Parking: No parking details provided
- Security: No security features listed
- Utilities: No specific utility provider details listed
- Home design: Single family residence; Two levels; Residential property; Existing construction
- Construction: Frame construction; Composition roof; Combination foundation; Built (existing) — year not provided
- Exterior features: Covered porch; Corner lot
Interior
- Kitchen: No kitchen appliance details provided
- Bedrooms: 3 bedrooms
- Flooring: Floor furnace heating (affects flooring areas)
- Bathrooms: 1 full bathroom
- Heating & cooling: Floor furnace heating; Window AC units
- Interior features: Living area; Dining area; No fireplace
- Laundry & utility: No laundry details provided
Neighborhood map
What this means for you Summary
Snapshot
- This is a 3-bed/1.0-bath single-family listed at $67k.
Deal economics
- At list price, monthly cash flow is $815 ($10k/yr) — positive.
- The deal already cash-flows at list — no discount required.
- Meets the 1% rule at list price ($2k rent vs $67k).
- Recommended offer: $61k (9.0% below list) — sets the bar for market timing.
- Cap rate 20.9% vs local median 3.1% in Guthrie — top-decile yield for the area; either an underpriced asset or a hidden risk that comps aren't pricing in. Stress-test before assuming the spread holds.
Location & tenants
- Location reads 74/100 on livability (#15 in OK, #4,696 nationally) — a middle-class / working-renter tenant base. Strengths: cost of living A+, housing A+, health & safety A+; Watch: amenities F, commute F.
- Guthrie (town): math 24% / reading 24% proficiency, ranked #119 of 270 in OK (top 44%) — low school quality limits family demand, transient renter base, plan for 1-2y turnover.
- Zoned schools: Central Es (math 12% / reading 8%, grade F, #711 of 845 statewide, top 87%, 278 students, 0% FRL); Guthrie Jhs (math 23% / reading 19%, grade F, #149 of 345 statewide, top 44%, 496 students, 0% FRL); Guthrie Hs (math 22% / reading 32%, grade F, #125 of 447 statewide, top 31%, 1,025 students, 0% FRL) — zoned schools average 0% FRL vs 55% district-wide (55 pts lower); this property's tenant base skews higher-income than the district average.
- Market conditions: Rents rising fast (+12.2%/yr); 851 active listings in the ZIP; 6 comparable units currently listed for rent nearby; rentals leasing fast (median 13d on market — plan ~1-2 weeks tenant-placement turnaround); 102 units permitted in Logan County in 2024 (0 in 5+ unit buildings).
Forward outlook
- Local home prices are declining (-3.0%/yr); year-one equity from $463 of loan paydown is wiped out by about $2k of value loss. Plan a longer hold.
- Logan County population projected at +36% by 2050 — long-run rental-demand tailwind backs the buy-and-hold thesis.
- At projected returns (-3.0% appreciation + 8.0% rent growth), your $19k cash investment doubles in ~3 years — after that, you're playing with house money.
Negotiation context
- It's been on market 100 days — a 9% lower offer ($61k) is reasonable based on typical stale-listing flexibility.
Risks & watch-outs
- Watch-outs: built in 1930 — expect roof / HVAC / electrical / plumbing capex.
- Climate carrying-cost: moderate wildfire risk; extreme-heat days projected 7→19/yr by 2055 (HVAC capex compounding) — expect insurance premiums to compound above CPI over the hold.
Questions for the listing agent
- It's been on market 100 days. Have you received any prior offers? Is the seller open to a 9% concession, seller financing, or rate buy-down credit?
- Built in 1930 — when were the roof, HVAC, electrical panel, plumbing, and water heater last replaced?
- Why hasn't it sold? Are there any deal-killer items the seller is aware of (foundation, flood, title, zoning, code violations)?
- Is there a deadline driving the sale (1031 exchange, divorce, estate, relocation)? That informs how much negotiation room exists.
- Schools are F-rated, which usually means shorter tenancies and higher turnover. Who's the typical renter profile here, and what's been the actual vacancy rate?
- What's the average days-on-market for RENTAL listings here right now (not sales)? A rising rental-DOM trend means longer vacancies and softer asking-rent achievability than the comps imply.
- What's the recent tenant-quality profile in this submarket — average credit score on applications, eviction rate, late-payment / NSF rate, and stable-employment percentage? A property-management company in the area should have these aggregated.
- How much new for-sale + rental construction is in the pipeline within 1–3 miles? Heavy new supply typically softens prices + rents 12–24 months out; constrained supply supports both.
Investment metrics
- 1% rule
- 2.31% ✓
- Cap rate
- 20.89%
- Cash-on-cash
- 52.13%
- DSCR
- 3.32
- GRM
- 3.6
CMA / ARV
- ARV (on-the-fly)
- $169,880
- Comps found
- 12
Show comp detail 12 sales within ~0.75 mi
| Address | Dist | Beds/Ba | Sqft | Sold | Price | $/sf | Match |
|---|---|---|---|---|---|---|---|
| 515 E Harrison Ave | 0.08mi | 4/2.0 (+1) | 1,270 (+2%) | 2mo | $172,000 | $135 | 81 |
| 1004 E Noble | 0.45mi | 3/1.0 | 1,248 (+1%) | 4mo | $140,000 | $112 | 74 |
| 805 E Harrison Ave | 0.19mi | 3/2.0 | 1,150 (-7%) | 3mo | $185,000 | $161 | 72 |
| 517 N Wentz St | 0.58mi | 3/1.0 | 1,210 (-2%) | 2mo | $220,000 | $182 | 68 |
| 622 S Ash St | 0.27mi | 3/2.0 | 1,140 (-8%) | 3mo | $154,000 | $135 | 67 |
| 620 S Ash St | 0.27mi | 3/2.0 | 1,140 (-8%) | 5mo | $155,000 | $136 | 66 |
| 624 S Ash St | 0.28mi | 3/2.0 | 1,140 (-8%) | 5mo | $159,999 | $140 | 65 |
| 410 S 1st St | 0.41mi | 3/2.0 | 1,306 (+5%) | 6mo | $200,000 | $153 | 63 |
| 402 S 2nd St | 0.46mi | 2/2.0 (-1) | 1,316 (+6%) | 3mo | $113,000 | $86 | 57 |
| 802 N Ash St | 0.69mi | 3/2.0 | 1,382 (+12%) | 2mo | $235,000 | $170 | 43 |
| 1320 E Cleveland Ave | 0.63mi | 3/2.0 | 1,422 (+15%) | 2mo | $195,000 | $137 | 41 |
| 1316 E Cleveland Ave | 0.62mi | 3/2.0 | 1,422 (+15%) | 2mo | $195,000 | $137 | 41 |
Match score weights: distance 35% · size 25% · config 20% · recency 20%. Top-matched comps best support the ARV.
Projected returns pro-forma
-3.0% appreciation · 8.0% rent growth · sell at horizon
- IRR
- 55.4%
- Equity multiple
- 3.62×
- Total profit
- $49,202
- Equity at exit
- $9,990
- IRR
- 62.3%
- Equity multiple
- 8.82×
- Total profit
- $146,793
- Equity at exit
- $5,793
Cash invested: $18,760 (down + closing). Projections, not guarantees.
Landlord ↔ Tenant lean methodology
- Overall (STATE)
- 83 Strongly Landlord-Friendly
- State Oklahoma
- 83 Strongly Landlord-Friendly · R+20
- County
- — inherits STATE
- City
- — inherits STATE
ZIP-level market 73044
- Home prices YoY
- -25.9%
- Rents YoY
- 12.2%
- Active inventory
- 851
- Price-to-rent
- 3.6×
Monthly cashflow live
- Estimated rent
- $1,545 high interval (Pro) →
- Mortgage (P&I)
- −$351
- Tax from tax record
- −$26 /mo · $315/yr
- Insurance
- −$28
- HOA
- −$0
- Vacancy / Maint / Mgmt
- −$324
- Net cashflow
- $815
Break-even live
Sensitivity live
| Price | -10% $853 | -5% $834 | +0% $815 | +5% $796 | +10% $777 |
|---|---|---|---|---|---|
| Rent | -10% $693 | -5% $754 | +0% $815 | +5% $876 | +10% $937 |
| Rate | -1.0pp $849 | -0.5pp $832 | base $815 | +0.5pp $798 | +1.0pp $780 |
UW: 25.0% down · 7.5% · 30yr · 1.5% tax · 5.0% vac · 8.0% maint · 8.0% mgmt
Financing live
Cash to close
- Down payment
- $16,750
- Closing costs
- $2,010
- Reserves months
- —
- Total cash needed
- —
Loan-product check · same deal, 3 products live
Conventional
25% down · 7.5% · 30yr
- Down + closing
- —
- Monthly P&I
- —
- Monthly cashflow
- —
- DSCR
- —
- Eligible?
- —
Personal DTI + credit; lowest rate.
DSCR
20% down · 8.5% · 30yr
- Down + closing
- —
- Monthly P&I
- —
- Monthly cashflow
- —
- DSCR
- —
- Eligible?
- —
No personal income docs; deal must DSCR.
Hard money
10% down · 12.0% · 12mo
- Down + closing
- —
- Monthly P&I
- —
- Monthly cashflow
- —
- DSCR
- —
- Eligible?
- —
Short-term bridge; refi at stabilization.
Rent comps 6 comps
| Address | Beds | Baths | Sqft | Rent | $/sqft | DOM | Units | Dist |
|---|---|---|---|---|---|---|---|---|
| 520 E Springer Ave Guthrie, OK | 2.0 | 2.0 | 1092 | $1,300 | $1.19 | 25d | 1 | 0.06mi |
| 406 S Pine St Guthrie, OK | 4.0 | 1.0 | 1272 | $1,400 | $1.10 | 3d | 1 | 0.66mi |
| 1211 Clydesdale Dr Guthrie, OK | 3.0 | 2.0 | 1273 | $1,625 | $1.28 | 3d | 1 | 0.76mi |
| 1201 Stallion Dr Guthrie, OK | 4.0 | 2.0 | 1459 | $2,000 | $1.37 | 13d | 1 | 0.88mi |
| 1221 Colt Dr Guthrie, OK | 3.0 | 2.0 | 1051 | $1,645 | $1.57 | 5d | 1 | 0.89mi |
| 409 E Hill Dr Guthrie, OK | 3.0 | 2.0 | 1305 | $1,445 | $1.11 | 12d | 1 | 0.96mi |
Listing history 21 events
-
2026-06-21days on market $67,000 Active 100 DOM
-
2026-06-18days on market $67,000 Active 97 DOM
-
2026-06-17days on market $67,000 Active 96 DOM
-
2026-06-16days on market $67,000 Active 95 DOM
-
2026-06-15days on market $67,000 Active 94 DOM
-
2026-06-13days on market $67,000 Active 92 DOM
-
2026-06-13days on market $67,000 Active 91 DOM
-
2026-06-09days on market $67,000 Active 88 DOM
-
2026-06-08days on market $67,000 Active 87 DOM
-
2026-06-07days on market $67,000 Active 86 DOM
-
2026-06-05days on market $67,000 Active 83 DOM
-
2026-06-03days on market $67,000 Active 82 DOM
-
2026-06-02days on market $67,000 Active 81 DOM
-
2026-06-02price $67,000 Active 80 DOM
-
2026-06-01days on market $74,000 Active 80 DOM
-
2026-05-31days on market $74,000 Active 79 DOM
-
2026-05-01price $74,000
-
2026-04-07price $79,000
-
2026-03-26price $84,000
-
2026-03-13$89,000 Active
-
2005-07-13soldstatus $600,000
ⓘ Source: listings_history table (triggers on properties + properties_extension) + one-shot
backfill from property_details.listing_events for pre-trigger history.
Tax reassessment forecast OK · Resets to sale price
- Current annual tax
- $315 · $26/mo
- Projected year-2 tax
- $603 · $50/mo
- Expected delta
- +$288/yr (+$24/mo · 91.4%)
ⓘ Screening estimate from a state-policy table — verify with the county assessor before closing.
Climate risk First Street
- Flood 1/10 Low FEMA zone X (unshaded) · 0% chance over 30 yrs
- Wildfire 5/10 Major
- Heat 6/10 Major 7 d/yr ≥109°F today · 19 d/yr by 30 yrs out
- Wind 2/10 Low 3% chance of damaging wind over 30 yrs
- Air quality 2/10 Low 2 unhealthy d/yr today · 2 by 30 yrs out
Nearby sold comps map
Loading sold comps map…
Walkable amenities ~0.75 mi
Loading nearby amenities…
Taxation est. · year 1
- Rental income
- $18,539
- − Mortgage interest
- −$3,753
- − Property taxes
- −$315
- − Insurance
- −$335
- − Repairs & maintenance
- −$1,483
- − Management
- −$1,483
- − Depreciation
- −$1,949
- Taxable income
- $9,221
- Est. tax owed @ 24.0%
- −$2,213
- After-tax cash flow
- $7,567/yr
For passive investors: Depreciation is non-cash, so a rental often shows a tax loss while cash-flowing — sheltering income. Rental losses are passive: they offset passive income freely, and up to $25,000/yr can offset ordinary (W-2) income if you actively participate and your MAGI is under $100k (phasing out to $0 by $150k); unused losses carry forward. On sale, claimed depreciation is recaptured at up to 25%, and gains may owe capital-gains tax (a 1031 exchange can defer both). Figures are a year-1 estimate at your 24.0% rate — not tax advice; consult a CPA.
Schools (NCES district)
- District
- Guthrie
- NCES district ID
- 4013560
- Math proficiency
- 24% ▼ -7.00%
- Reading proficiency
- 24% ▼ -2.00%
- Median HH income
- $45,370
- Composite
- 20.79/100
- National rank
- #8513
- State rank
- #119 of 270 in OK
Livability — Guthrie
- Score
- 74/100
- State rank
- #15
- US rank
- #4696
Category grades
Schools grade is shown separately in the Schools card above.
Census & demographics
- Census place
- Guthrie, OK
- County
- Logan County · 25,398 people
- City population
- 25,398
- Metro
- Oklahoma City, OK
- Population (ZIP)
- 25,398
- Household income
- $72,288
- Rent vs Own
- Severe rent burden
- 397.0
Population outlook (Logan County) Hauer SSP2
- Today (2025)
- 55,683 people
- By 2030
- 60,011 · +7.8%
- By 2040
- 68,071 · +22.2%
- By 2050
- 75,815 · +36.2%
- By 2075
- 94,749 · +70.2%
- By 2100
- 108,057 · +94.1%
Race, ethnicity, and origin ACS 2023
- Neighborhood character
- Predominantly White (77%)
- Race & ethnicity
- White 77% Two or more races 10% Hispanic / Latino 8% Black 6% Native American 3%
- Hispanic origin (detail)
- Mexican 7%
- Common ancestry
- Slovak 3% Lithuanian 3% Italian 2%
- Foreign-born
- 3% · Canada
- Languages at home
- 94% English-only · Spanish 6%
Political lean MEDSL · Logan
- 2024 margin
- Solid R (+49.0) · D 24.4% · R 73.5% · Other 2.1%
- 2008→2024 swing
- -11.6pp toward R · 2008: -37.4pp · 2024: -49.0pp
- All cycles
- 2024: R+49.0 2020: R+47.1 2016: R+49.5 2012: R+44.8 2008: R+37.4
Not yet ingested
- Civics
- —
Market trends
- HPI YoY
- ▼ -86.90%
- Current HPI
- 247.9481
- Rent YoY
- ▲ 12.22%
- Metro
- Oklahoma City, OK
- State GDP YoY
- ▲ 1.55%
- F500 in state
- 6
Industry mix (Fortune 500 HQ in OK)
| Industry | F500 HQs | Revenue |
|---|---|---|
| Energy | 3 | $48B |
|
||
Price history
-87.7% since first listed5 events — show timeline
- 2026-05-01 Price Changed $74,000 MLSOK
- 2026-04-07 Price Changed $79,000 MLSOK
- 2026-03-26 Price Changed $84,000 MLSOK
- 2026-03-13 Listed $89,000 MLSOK
- 2005-07-13 Sold (Public Records) $600,000 Public Records
Property tax history
+3.4%/yrLatest (2025): $315 · +6.4% YoY. Source: county tax records.
Cash-flow waterfall
monthlySold comps — $/sqft
last 12 mo · ≤1 miLoading sold comps…