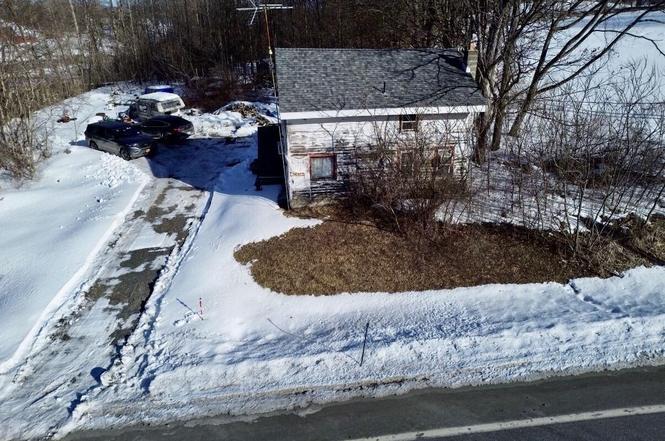
5021 State Route 149 · North Granville, NY
Flood risk 1/10 · Minimal
- FEMA flood zone
- X
- Chance of flooding over 30 yrs
- 0.0%
- Est. flood insurance / yr
- $473 – $860
Fire risk 4/10 · Minor
- Est. fire insurance / yr
- $691 – $1,283
Heat risk 3/10 · Minor
- Hot days now (above 91°F)
- 7 days/yr
- Hot days in 30 yrs
- 17 days/yr
Wind risk 2/10 · Minimal
- Chance of severe wind over 30 yrs
- 4.0%
Air-quality risk 2/10 · Minimal
- Unhealthy air days now
- 0 days/yr
- Unhealthy air days in 30 yrs
- 1 days/yr
Risk factors via First Street. Map © Google.
Why this score? — see what drove the B+ grade
The composite is a weighted blend of 9 inputs, each scored 0–100. Each bar is that input's sub-score; the figure is the points it added to the 100-point composite (weight × sub-score).
- Cash flow +30.0/30.0
- 1% rule +10.0/10.0
- DSCR +10.0/10.0
- ARV discount +7.5/15.0
- Appreciation +6.5/10.0
- Schools +4.6/10.0
- Rent growth +2.5/5.0
- Livability +2.5/5.0
- Condition / age +2.5/5.0
$40,000
🖨 Deal sheet 📄 Offer letter ✓ Due diligence
Listing remarks
Opportunity awaits at 5021 State Route 149 in Hartford! This fixer-upper rehab property sits on nearly an acre of land with beautiful surrounding views, offering the perfect setting for your next renovation project. The home features 2 bedrooms and 1.5 baths and includes a drilled well and a newer roof, giving you a solid starting point to bring your vision to life. Whether you're an investor looking for your next project or a buyer ready to roll up your sleeves and create your dream country retreat, this property offers great potential. Conveniently located with easy access to the Adirondack region and Vermont, it's an ideal spot for those who enjoy outdoor recreation and scenic surroundin
Key facts
- Easy access
- Nearly an acre
- Newer roof
Tags
Property features AI
Exterior
- Parking: Driveway; Total of 4 parking spaces
- Security: Smoke detectors; Carbon monoxide detectors
- Utilities: Cesspool sewage; Cable available
- Home design: Single family residence; Fixer condition
- Construction: Wood siding
- Exterior features: Shingle roof; Rolling slope lot with road frontage and views
Interior
- Kitchen: Range; Refrigerator
- Bedrooms: Two bedrooms on the second level; One bedroom on the first level (living room currently used as a bedroom); One additional room currently used as a bedroom (originally listed as living room/dining use noted)
- Flooring: Wood floors
- Bathrooms: One full bathroom on the second level; One half bathroom on the first level
- Heating & cooling: Wood stove heating
- Interior features: High speed internet; Wood burning stove (fireplace)
- Laundry & utility: Washer; Laundry closet on the main level; Exterior-entry basement
Neighborhood map
What this means for you Summary
Snapshot
- This is a 2-bed/1.5-bath single-family listed at $40k.
Deal economics
- At list price, monthly cash flow is $569 ($7k/yr) — positive.
- The deal already cash-flows at list — no discount required.
- Meets the 1% rule at list price ($1k rent vs $40k).
- Recommended offer: $39k (3.0% below list) — sets the bar for market timing.
Location & tenants
- Location reads: area grade B — affects rentability + tenant quality, not the cash-flow math above.
- Hartford Central School District (rural): math 61% / reading 40% proficiency, ranked #430 of 755 in NY (top 57%) — acceptable for families but not a draw, mixed tenant base, ~2y average lease.
- Market conditions: 5 active listings in the ZIP; 106 units permitted in Washington County in 2024 (0 in 5+ unit buildings).
Forward outlook
- In year one you build about $1k of equity ($277 loan paydown + $1k appreciation (3.0% local appreciation)).
- Washington County population projected at -20% by 2050 — secular population decline; favor cash flow + early exit over multi-decade hold.
- At projected returns (3.0% appreciation + 3.0% rent growth), your $11k cash investment doubles in ~2 years — after that, you're playing with house money.
Negotiation context
- It's been on market 55 days — a 3% lower offer ($39k) is reasonable based on typical stale-listing flexibility.
Risks & watch-outs
- Watch-outs: built in 1900 — expect roof / HVAC / electrical / plumbing capex.
Questions for the listing agent
- It's been on market 55 days. Have you received any prior offers? Is the seller open to a 3% concession, seller financing, or rate buy-down credit?
- Built in 1900 — when were the roof, HVAC, electrical panel, plumbing, and water heater last replaced?
- Is there a deadline driving the sale (1031 exchange, divorce, estate, relocation)? That informs how much negotiation room exists.
- What's the average days-on-market for RENTAL listings here right now (not sales)? A rising rental-DOM trend means longer vacancies and softer asking-rent achievability than the comps imply.
- What's the recent tenant-quality profile in this submarket — average credit score on applications, eviction rate, late-payment / NSF rate, and stable-employment percentage? A property-management company in the area should have these aggregated.
- How much new for-sale + rental construction is in the pipeline within 1–3 miles? Heavy new supply typically softens prices + rents 12–24 months out; constrained supply supports both.
Investment metrics
- 1% rule
- 2.67% ✓
- Cap rate
- 23.36%
- Cash-on-cash
- 60.94%
- DSCR
- 3.71
- GRM
- 3.1
CMA / ARV
- ARV (on-the-fly)
- $275,352
- Comps found
- 1
Show comp detail 1 sale within ~0.75 mi
| Address | Dist | Beds/Ba | Sqft | Sold | Price | $/sf | Match |
|---|---|---|---|---|---|---|---|
| 65 Skyview Meadows Ln | 0.70mi | 3/1.0 (+1) | 1,007 (+9%) | 2mo | $300,000 | $298 | 44 |
Match score weights: distance 35% · size 25% · config 20% · recency 20%. Top-matched comps best support the ARV.
Projected returns pro-forma
2.98% appreciation · 3.0% rent growth · sell at horizon
- IRR
- 65.8%
- Equity multiple
- 4.66×
- Total profit
- $41,013
- Equity at exit
- $17,936
- IRR
- 65.3%
- Equity multiple
- 9.51×
- Total profit
- $95,321
- Equity at exit
- $27,602
Cash invested: $11,200 (down + closing). Projections, not guarantees.
Landlord ↔ Tenant lean methodology
- Overall (STATE)
- 15 Strongly Tenant-Friendly
- State New York
- 15 Strongly Tenant-Friendly · D+10
- County
- — inherits STATE
- City
- — inherits STATE
ZIP-level market 12838
- Home prices YoY
- 0.8%
- Active inventory
- 5
- Price-to-rent
- 3.1×
Monthly cashflow live
- Estimated rent
- $1,070 medium interval (Pro) →
- Mortgage (P&I)
- −$210
- Tax est. 1.5%
- −$50 /mo · $600/yr
- Insurance
- −$17
- HOA
- −$0
- Vacancy / Maint / Mgmt
- −$225
- Net cashflow
- $569
Break-even live
UW: 25.0% down · 7.5% · 30yr · 1.5% tax · 5.0% vac · 8.0% maint · 8.0% mgmt
Financing live
Cash to close
- Down payment
- $10,000
- Closing costs
- $1,200
- Reserves months
- —
- Total cash needed
- —
Loan-product check · same deal, 3 products live
Conventional
25% down · 7.5% · 30yr
- Down + closing
- —
- Monthly P&I
- —
- Monthly cashflow
- —
- DSCR
- —
- Eligible?
- —
Personal DTI + credit; lowest rate.
DSCR
20% down · 8.5% · 30yr
- Down + closing
- —
- Monthly P&I
- —
- Monthly cashflow
- —
- DSCR
- —
- Eligible?
- —
No personal income docs; deal must DSCR.
Hard money
10% down · 12.0% · 12mo
- Down + closing
- —
- Monthly P&I
- —
- Monthly cashflow
- —
- DSCR
- —
- Eligible?
- —
Short-term bridge; refi at stabilization.
Listing history 3 events
-
2026-04-30status Pending
-
2026-04-17price $40,000
-
2026-03-05$45,000 Active
ⓘ Source: listings_history table (triggers on properties + properties_extension) + one-shot
backfill from property_details.listing_events for pre-trigger history.
Climate risk First Street
- Flood 1/10 Low FEMA zone X · 0% chance over 30 yrs
- Wildfire 4/10 Moderate
- Heat 3/10 Moderate 7 d/yr ≥91°F today · 17 d/yr by 30 yrs out
- Wind 2/10 Low 4% chance of damaging wind over 30 yrs
- Air quality 2/10 Low 0 unhealthy d/yr today · 1 by 30 yrs out
Nearby sold comps map
Loading sold comps map…
Walkable amenities ~0.75 mi
Loading nearby amenities…
Taxation est. · year 1
- Rental income
- $12,839
- − Mortgage interest
- −$2,241
- − Property taxes
- −$600
- − Insurance
- −$200
- − Repairs & maintenance
- −$1,027
- − Management
- −$1,027
- − Depreciation
- −$1,164
- Taxable income
- $6,580
- Est. tax owed @ 24.0%
- −$1,579
- After-tax cash flow
- $5,246/yr
For passive investors: Depreciation is non-cash, so a rental often shows a tax loss while cash-flowing — sheltering income. Rental losses are passive: they offset passive income freely, and up to $25,000/yr can offset ordinary (W-2) income if you actively participate and your MAGI is under $100k (phasing out to $0 by $150k); unused losses carry forward. On sale, claimed depreciation is recaptured at up to 25%, and gains may owe capital-gains tax (a 1031 exchange can defer both). Figures are a year-1 estimate at your 24.0% rate — not tax advice; consult a CPA.
Schools (NCES district)
- District
- Hartford Central School District
- NCES district ID
- 3613830
- Math proficiency
- 61% ▲ 1.00%
- Reading proficiency
- 40% ▼ -2.00%
- Median HH income
- $58,733
- Composite
- 46.07/100
- National rank
- #5488
- State rank
- #430 of 755 in NY
Livability — North Granville
No livability data for this city. (Only ~50 U.S. cities are tracked.)
Census & demographics
- Population (ZIP)
- 699
Population outlook (Washington County) Hauer SSP2
- Today (2025)
- 59,576 people
- By 2030
- 57,618 · -3.3%
- By 2040
- 52,751 · -11.5%
- By 2050
- 47,514 · -20.2%
- By 2075
- 35,690 · -40.1%
- By 2100
- 24,807 · -58.4%
Race, ethnicity, and origin ACS 2023
- Neighborhood character
- Predominantly White (92%)
- Race & ethnicity
- White 92% Two or more races 5% Hispanic / Latino 3%
- Common ancestry
- Slovak 8% Lithuanian 4% Serbian 4%
- Foreign-born
- 3% · Canada, Dominican Republic
- Languages at home
- 99% English-only · German/W. Germanic 1%
Political lean MEDSL · Washington
- 2024 margin
- Strong R (+21.2) · D 39.4% · R 60.6%
- 2008→2024 swing
- -22.0pp toward R · 2008: 0.8pp · 2024: -21.2pp
- All cycles
- 2024: R+21.2 2020: R+15.6 2016: R+20.2 2012: D+1.6 2008: D+0.8
Not yet ingested
- Civics
- —
Market trends
- HPI YoY
- ▲ 2.98%
- Current HPI
- 356.8117
- Rent YoY
- —
- Metro
- —
- State GDP YoY
- ▲ 2.60%
- F500 in state
- 92
Industry mix (Fortune 500 HQ in NY)
| Industry | F500 HQs | Revenue |
|---|---|---|
| Financial Services | 10 | $950B |
|
||
| Consumer Goods | 9 | $162B |
|
||
| Insurance | 4 | $225B |
|
||
| Telecommunications | 2 | $144B |
|
||
| Pharmaceuticals | 2 | $112B |
|
||
| Media / Entertainment | 2 | $69B |
|
||
Price history
-11.1% since first listed3 events — show timeline
- 2026-04-30 Pending — Global MLS
- 2026-04-17 Price Changed $40,000 Global MLS
- 2026-03-05 Listed $45,000 Global MLS
Cash-flow waterfall
monthlySold comps — $/sqft
last 12 mo · ≤1 miLoading sold comps…