5100 Highway A1a Hwy Unit 20B · Indian River Shores, FL
Flood risk 6/10 · Moderate
- FEMA flood zone
- X (unshaded)
- Chance of flooding over 30 yrs
- 0.73%
- Est. flood insurance / yr
- $507 – $1,088
Fire risk 1/10 · Minimal
- Est. fire insurance / yr
- $947 – $1,759
Heat risk 10/10 · Severe
- Hot days now (above 105°F)
- 8 days/yr
- Hot days in 30 yrs
- 26 days/yr
Wind risk 10/10 · Severe
- Chance of severe wind over 30 yrs
- 99.0%
Air-quality risk 1/10 · Minimal
- Unhealthy air days now
- 0 days/yr
- Unhealthy air days in 30 yrs
- 0 days/yr
Risk factors via First Street. Map © Google.
Why this score? — see what drove the C- grade
The composite is a weighted blend of 9 inputs, each scored 0–100. Each bar is that input's sub-score; the figure is the points it added to the 100-point composite (weight × sub-score).
- Cash flow +18.0/30.0
- ARV discount +7.5/15.0
- 1% rule +7.0/10.0
- DSCR +5.6/10.0
- Rent growth +5.0/5.0
- Schools +4.2/10.0
- Livability +3.4/5.0
- Condition / age +2.5/5.0
- Appreciation +0.0/10.0
$450,000
🖨 Deal sheet (PDF) 📄 Offer letter ✓ Due diligence
Listing remarks
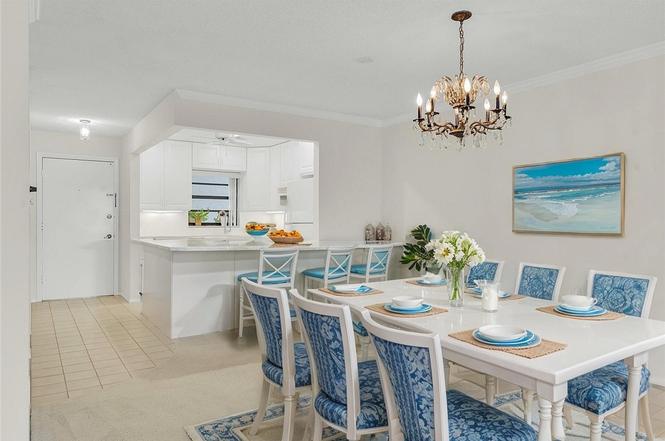
Located in Pebble Beach Villas, this rare 3-bedroom, 2-bath condo offers the beachside lifestyle you’ve been waiting for. Situated east of A1A with deeded beach access, it's just a short stroll to the sand and minutes from Ocean Drive’s shops and dining. Light, bright, and move-in ready, this end unit features generous living space and a 1-car garage. The community offers a pool, tennis, shuffleboard, and clubhouse—perfect for enjoying the best of Vero Beach living.
Key facts
- Deeded beach access
- Tennis
- Clubhouse
Tags
Property features AI
Finance
- Financial info: Pets allowed
- HOA & community: Association: Elliott Merrill; Monthly association fee of $963; HOA covers common areas, structure insurance, maintenance, sewer, trash and water; Community amenities include clubhouse, shuffleboard, sidewalks, tennis courts and pool
Exterior
- Parking: Driveway; Garage with garage door opener; One garage space
- Utilities: Public water; Public sewer; Electric service
- Home design: Two-story property; Faces west; Property is attached
- Construction: Block, concrete, and stucco construction; Metal roof
- Exterior features: Community pool; Beach access; Has a view; No additional exterior features listed
Interior
- Kitchen: Refrigerator; Range; Microwave; Dishwasher; Disposal; Pantry
- Bedrooms: Three bedrooms (15x14, 12x11, 15x14)
- Flooring: Carpet; Tile
- Bathrooms: Two full bathrooms
- Heating & cooling: Central heating (electric); Central air; Ceiling fans
- Interior features: Crown molding; Window treatments; Sliding doors; Pantry; Walk-in closets; Unfurnished
- Laundry & utility: Washer and dryer in unit; Laundry closet; Electric water heater
Neighborhood map
What this means for you Summary
Snapshot
- This is a 3-bed/2.0-bath condo listed at $450k.
Deal economics
- At list price, monthly cash flow is $385 ($5k/yr) — positive.
- The deal already cash-flows at list — no discount required.
- Meets the 1% rule at list price ($5k rent vs $450k).
- Recommended offer: $396k (12.0% below list) — sets the bar for market timing.
- Cap rate 7.3% vs local median 1.5% in Indian River Shores — top-decile yield for the area; either an underpriced asset or a hidden risk that comps aren't pricing in. Stress-test before assuming the spread holds.
Location & tenants
- Location reads 68/100 on livability (#517 in FL) — a middle-class / working-renter tenant base. Strengths: crime A+, employment A+, housing A-; Watch: schools C-, amenities F, commute F.
- Indian River (other): math 48% / reading 52% proficiency, ranked #35 of 73 in FL (top 48%) — acceptable for families but not a draw, mixed tenant base, ~2y average lease.
- Market conditions: Rents rising fast (+11.0%/yr); 498 active listings in the ZIP; 40 comparable units currently listed for rent nearby; rentals at typical pace (median 22d on market — plan ~3-4 weeks tenant-placement turnaround); high-income renter base; 564 units permitted in Indian River County in 2024 (281 in 5+ unit buildings).
- This rent runs 43% of the median local income ($150k/yr) — at the standard rent-burdened threshold; future hikes will face affordability resistance.
Forward outlook
- Local home prices are declining (-3.0%/yr); year-one equity from $3k of loan paydown is wiped out by about $14k of value loss. Plan a longer hold.
- Indian River County population projected at +18% by 2050 — long-run rental-demand tailwind backs the buy-and-hold thesis.
- At projected returns (-3.0% appreciation + 8.0% rent growth), your $126k cash investment doubles in ~9 years — after that, you're playing with house money.
Negotiation context
- It's been on market 330 days — a 12% lower offer ($396k) is reasonable based on typical stale-listing flexibility.
- Current owner paid $115k; list at $450k implies a 291% gain — meaningful room to come down on a strong offer.
Risks & watch-outs
- Climate carrying-cost: major flood risk; severe wind risk, 99% chance of damaging wind over 30y; extreme-heat days projected 8→26/yr by 2055 (HVAC capex compounding) — expect insurance premiums to compound above CPI over the hold.
Questions for the listing agent
- It's been on market 330 days. Have you received any prior offers? Is the seller open to a 12% concession, seller financing, or rate buy-down credit?
- Built in 1975 — when were the roof, HVAC, electrical panel, plumbing, and water heater last replaced?
- What does the HOA fee cover, when was the last increase, and are there any pending special assessments or reserve-fund shortfalls?
- Any open or pending special assessments — roof, HVAC, plumbing, elevator, façade? What's the per-unit balance and payoff schedule, and is the seller paying it off at close or rolling it to the buyer?
- Why hasn't it sold? Are there any deal-killer items the seller is aware of (foundation, flood, title, zoning, code violations)?
- Is there a deadline driving the sale (1031 exchange, divorce, estate, relocation)? That informs how much negotiation room exists.
- What's the average days-on-market for RENTAL listings here right now (not sales)? A rising rental-DOM trend means longer vacancies and softer asking-rent achievability than the comps imply.
- What's the recent tenant-quality profile in this submarket — average credit score on applications, eviction rate, late-payment / NSF rate, and stable-employment percentage? A property-management company in the area should have these aggregated.
- How much new apartment / multifamily construction is in the pipeline within 1–3 miles? Heavy new supply (>2% of stock underway) typically softens rents 12–24 months out; light construction supports rent growth.
Investment metrics
- 1% rule
- 1.20% ✓
- Cap rate
- 7.32%
- Cash-on-cash
- 3.66%
- DSCR
- 1.16
- GRM
- 6.9
CMA / ARV
No comps found within radius.
Projected returns pro-forma
-3.0% appreciation · 8.0% rent growth · sell at horizon
- IRR
- -3.9%
- Equity multiple
- 0.85×
- Total profit
- $-19,316
- Equity at exit
- $67,096
- IRR
- 11.6%
- Equity multiple
- 2.17×
- Total profit
- $146,889
- Equity at exit
- $38,908
Cash invested: $126,000 (down + closing). Projections, not guarantees.
Landlord ↔ Tenant lean methodology
- Overall (STATE)
- 87 Strongly Landlord-Friendly
- State Florida
- 87 Strongly Landlord-Friendly · R+3
- County
- — inherits STATE
- City
- — inherits STATE
ZIP-level market 32963
- Rents YoY
- 11.0%
- Active inventory
- 498
- Price-to-rent
- 6.9×
Monthly cashflow live
- Estimated rent
- $5,400 high interval (Pro) →
- Mortgage (P&I)
- −$2,360
- Tax from tax record
- −$371 /mo · $4,452/yr
- Insurance
- −$188
- HOA
- −$963
- Vacancy / Maint / Mgmt
- −$1,134
- Net cashflow
- $385
Break-even live
Sensitivity live
| Price | -10% $640 | -5% $512 | +0% $385 | +5% $257 | +10% $130 |
|---|---|---|---|---|---|
| Rent | -10% $-42 | -5% $172 | +0% $385 | +5% $598 | +10% $811 |
| Rate | -1.0pp $611 | -0.5pp $499 | base $385 | +0.5pp $268 | +1.0pp $150 |
UW: 25.0% down · 7.5% · 30yr · 1.5% tax · 5.0% vac · 8.0% maint · 8.0% mgmt
Financing live
Cash to close
- Down payment
- $112,500
- Closing costs
- $13,500
- Reserves months
- —
- Total cash needed
- —
Loan-product check · same deal, 3 products live
Conventional
25% down · 7.5% · 30yr
- Down + closing
- —
- Monthly P&I
- —
- Monthly cashflow
- —
- DSCR
- —
- Eligible?
- —
Personal DTI + credit; lowest rate.
DSCR
20% down · 8.5% · 30yr
- Down + closing
- —
- Monthly P&I
- —
- Monthly cashflow
- —
- DSCR
- —
- Eligible?
- —
No personal income docs; deal must DSCR.
Hard money
10% down · 12.0% · 12mo
- Down + closing
- —
- Monthly P&I
- —
- Monthly cashflow
- —
- DSCR
- —
- Eligible?
- —
Short-term bridge; refi at stabilization.
Rent comps 40 comps
| Address | Beds | Baths | Sqft | Rent | $/sqft | DOM | Units | Dist |
|---|---|---|---|---|---|---|---|---|
| 5100 Jimmy Buffett Memorial Hwy Unit 58G INDN RIV SHRS, FL | 2.0 | 2.0 | 1170 | $6,000 | $5.13 | 22d | 1 | 0.02mi |
| 5101 Highway A1A #109 Vero Beach, FL | 3.0 | 2.0 | 1848 | $5,500 | $2.98 | 22d | 1 | 0.20mi |
| 902 Tides Rd Vero Beach, FL | 3.0 | 3.0 | 1810 | $8,500 | $4.70 | 14d | 1 | 0.23mi |
| 5151 Jimmy Buffett Memorial Hwy Unit 512 Indian River Shores, FL | 2.0 | 2.0 | 1339 | $4,600 | $3.44 | 22d | 1 | 0.29mi |
| 5151 Jimmy Buffett Memorial Hwy Unit 305 Indian River Shores, FL | 2.0 | 2.0 | 1339 | $2,300 | $1.72 | 22d | 1 | 0.29mi |
| 907 Tropic Dr Vero Beach, FL | 3.0 | 2.0 | 1830 | $10,000 | $5.46 | 22d | 1 | 0.32mi |
| 5300 Jimmy Buffett Memorial Hwy Unit 214 Indian River Shores, FL | 2.0 | 2.0 | 1300 | $5,500 | $4.23 | 22d | 1 | 0.36mi |
| 5300 Jimmy Buffett Memorial Hwy Unit 408 Indian River Shores, FL | 2.0 | 2.0 | 1300 | $9,000 | $6.92 | 22d | 1 | 0.36mi |
| 5300 Jimmy Buffett Memorial Hwy Unit 314 Indian River Shores, FL | 2.0 | 2.0 | 1300 | $3,000 | $2.31 | 22d | 1 | 0.36mi |
| 5300 Jimmy Buffett Memorial Hwy Unit 305 Indian River Shores, FL | 2.0 | 2.0 | 1300 | $6,000 | $4.62 | 22d | 1 | 0.36mi |
| 5300 Jimmy Buffett Memorial Hwy #301 Indian River Shores, FL | 2.0 | 2.0 | 1300 | $7,000 | $5.38 | 22d | 1 | 0.37mi |
| 4890 Bethel Creek Dr #5 Vero Beach, FL | 2.0 | 2.5 | 1244 | $2,200 | $1.77 | 22d | 1 | 0.44mi |
| 4836 Bethel Creek Dr Unit 4836 Vero Beach, FL | 2.0 | 2.5 | 1650 | $3,000 | $1.82 | 14d | 1 | 0.46mi |
| 4834 Bethel Creek Dr Vero Beach, FL | 2.0 | 2.5 | 1500 | $2,900 | $1.93 | 22d | 1 | 0.46mi |
| 4800 Highway A1A #116 Vero Beach, FL | 2.0 | 2.0 | 1822 | $3,000 | $1.65 | 22d | 1 | 0.49mi |
| 4800 Highway A1A #207 Vero Beach, FL | 2.0 | 2.0 | 1850 | $7,000 | $3.78 | 22d | 1 | 0.49mi |
| 4800 Highway A1A #506 Vero Beach, FL | 2.0 | 2.0 | 1850 | $4,500 | $2.43 | 22d | 1 | 0.49mi |
| 5400 Jimmy Buffett Memorial Hwy Indian River Shores, FL | 2.0 | 2.0 | 1200 | $1,800 | $1.50 | 22d | 1 | 0.49mi |
| 131 Peppertree Dr #21 Vero Beach, FL | 2.0 | 2.0 | 1787 | $3,300 | $1.85 | 14d | 1 | 0.55mi |
| 5536 Jimmy Buffett Memorial Hwy Unit 211 Vero Beach, FL | 2.0 | 2.5 | 1632 | $6,000 | $3.68 | 22d | 1 | 0.61mi |
| 4601 Highway A1A #103 Vero Beach, FL | 2.0 | 2.0 | 1600 | $2,500 | $1.56 | 22d | 1 | 0.63mi |
| 4601 Highway A1A #202 Vero Beach, FL | 2.0 | 2.0 | 1440 | $3,250 | $2.26 | 22d | 1 | 0.63mi |
| 5554 Jimmy Buffett Memorial Hwy Unit 202 Indian River Shores, FL | 2.0 | 2.5 | 1632 | $12,000 | $7.35 | 22d | 1 | 0.64mi |
| 5554 Jimmy Buffett Memorial Hwy Unit 201 Indian River Shores, FL | 2.0 | 2.0 | 1632 | $12,000 | $7.35 | 22d | 1 | 0.64mi |
| 4600 Highway A1A #507 Vero Beach, FL | 2.0 | 2.0 | 1400 | $5,000 | $3.57 | 22d | 1 | 0.66mi |
| 4600 Highway A1A #409 Vero Beach, FL | 2.0 | 2.0 | 1725 | $7,500 | $4.35 | 22d | 1 | 0.66mi |
| 4450 Florida A1A Unit 102 Vero Beach, FL | 2.0 | 2.0 | 1000 | $3,900 | $3.90 | 22d | 1 | 0.71mi |
| 4450 Highway A1A #404 Vero Beach, FL | 2.0 | 2.0 | 1080 | $3,499 | $3.24 | 14d | 1 | 0.71mi |
| 4450 Highway A1A #303 Vero Beach, FL | 2.0 | 2.0 | 1080 | $3,500 | $3.24 | 22d | 1 | 0.71mi |
| 219 Park Shores Cir Unit 219B Vero Beach, FL | 2.0 | 2.5 | 1583 | $3,000 | $1.90 | 14d | 1 | 0.83mi |
| 4150 Highway A1A #111 Vero Beach, FL | 2.0 | 2.0 | 1300 | $2,600 | $2.00 | 22d | 1 | 0.92mi |
| 4141 Ocean Dr Vero Beach, FL | 2.0–3.0 | 2.0 | 1200 | $8,500 | $7.08 | 14d | 4 | 0.96mi |
| 4019 Silver Palm Dr #8 Vero Beach, FL | 2.0 | 2.5 | 1460 | $3,000 | $2.05 | 22d | 1 | 1.07mi |
| 4026 Silver Palm Dr Vero Beach, FL | 2.0 | 2.0 | 1200 | $3,500 | $2.92 | 14d | 1 | 1.08mi |
| 101 E Park Shores Cir Unit 2 Indian River Shores, FL | 2.0 | 2.0 | 1640 | $2,600 | $1.59 | 14d | 1 | 1.08mi |
| 4009 Silver Palm Dr #3 Vero Beach, FL | 2.0 | 2.5 | 1430 | $5,100 | $3.57 | 22d | 1 | 1.08mi |
| 133 E Park Shores Cir Unit 4E Vero Beach, FL | 2.0 | 2.0 | 1540 | $3,500 | $2.27 | 14d | 1 | 1.09mi |
| 133 E Park Shores Cir Unit 7E Vero Beach, FL | 2.0 | 2.0 | 1640 | $3,000 | $1.83 | 14d | 1 | 1.09mi |
| 4049 Ocean Dr Vero Beach, FL | 2.0 | 2.0 | 1250 | $3,750 | $3.00 | 22d | 2 | 1.10mi |
| 3939 Ocean Dr Unit B-407 Vero Beach, FL | 3.0 | 2.0 | 1700 | $7,000 | $4.12 | 22d | 1 | 1.15mi |
HOA detail condo
- Monthly dues
- $963 · $11,556/yr
- Likely covers
- pool
- Assessments
- None detected in remarks — confirm with the listing agent.
Listing history 24 events
-
2026-06-19days on market $450,000 Active 330 DOM
-
2026-06-18days on market $450,000 Active 329 DOM
-
2026-06-17days on market $450,000 Active 328 DOM
-
2026-06-16days on market $450,000 Active 327 DOM
-
2026-06-15days on market $450,000 Active 326 DOM
-
2026-06-14days on market $450,000 Active 324 DOM
-
2026-06-13days on market $450,000 Active 323 DOM
-
2026-06-10days on market $450,000 Active 321 DOM
-
2026-06-09days on market $450,000 Active 320 DOM
-
2026-06-08days on market $450,000 Active 319 DOM
-
2026-06-07days on market $450,000 Active 318 DOM
-
2026-06-05days on market $450,000 Active 315 DOM
-
2026-06-02days on market $450,000 Active 313 DOM
-
2026-06-01days on market $450,000 Active 312 DOM
-
2026-05-31days on market $450,000 Active 311 DOM
-
2026-05-30days on market $450,000 Active 310 DOM
-
2026-04-24price $450,000
-
2026-03-13price $470,000
-
2026-01-31price $480,000
-
2026-01-16price $495,000
-
2025-10-08price $525,000
-
2025-07-24$545,000 Active
-
1988-01-01soldstatus $115,000
-
1980-12-01soldstatus $88,000
ⓘ Source: listings_history table (triggers on properties + properties_extension) + one-shot
backfill from property_details.listing_events for pre-trigger history.
Tax reassessment forecast FL · Resets to sale price
- Current annual tax
- $4,452 · $371/mo
- Projected year-2 tax
- $4,452 · $371/mo
- Expected delta
- $0/yr ($0/mo · 0.0%)
ⓘ Screening estimate from a state-policy table — verify with the county assessor before closing.
Climate risk First Street
- Flood 6/10 Major FEMA zone X (unshaded) · 73% chance over 30 yrs
- Wildfire 1/10 Low
- Heat 10/10 Extreme 8 d/yr ≥105°F today · 26 d/yr by 30 yrs out
- Wind 10/10 Extreme 99% chance of damaging wind over 30 yrs
- Air quality 1/10 Low 0 unhealthy d/yr today · 0 by 30 yrs out
Nearby sold comps map
Loading sold comps map…
Walkable amenities ~0.75 mi
Loading nearby amenities…
Taxation est. · year 1
- Rental income
- $64,802
- − Mortgage interest
- −$25,207
- − Property taxes
- −$4,452
- − Insurance
- −$2,250
- − Repairs & maintenance
- −$5,184
- − Management
- −$5,184
- − HOA
- −$11,556
- − Depreciation
- −$13,091
- Taxable loss
- −$2,122
- Est. tax savings @ 24.0%
- +$509
- After-tax cash flow
- $5,127/yr
For passive investors: Depreciation is non-cash, so a rental often shows a tax loss while cash-flowing — sheltering income. Rental losses are passive: they offset passive income freely, and up to $25,000/yr can offset ordinary (W-2) income if you actively participate and your MAGI is under $100k (phasing out to $0 by $150k); unused losses carry forward. On sale, claimed depreciation is recaptured at up to 25%, and gains may owe capital-gains tax (a 1031 exchange can defer both). Figures are a year-1 estimate at your 24.0% rate — not tax advice; consult a CPA.
Schools (NCES district)
- District
- Indian River
- NCES district ID
- 1200930
- Math proficiency
- 48% ▼ -9.00%
- Reading proficiency
- 52% ▼ -3.00%
- Median HH income
- $46,597
- Composite
- 42.45/100
- National rank
- #3218
- State rank
- #35 of 73 in FL
Livability — Indian River Shores
- Score
- 68/100
- State rank
- #517
- US rank
- #9512
Category grades
Schools grade is shown separately in the Schools card above.
Census & demographics
- Census place
- Indian River Shores, FL
- County
- Indian River County · 143,738 people
- City population
- 15,008
- Metro
- Sebastian-Vero Beach, FL
- Population (ZIP)
- 15,008
- Household income
- $149,923
- Rent vs Own
- Severe rent burden
- 119.0
Population outlook (Indian River County) Hauer SSP2
- Today (2025)
- 165,104 people
- By 2030
- 172,869 · +4.7%
- By 2040
- 185,640 · +12.4%
- By 2050
- 194,465 · +17.8%
- By 2075
- 211,115 · +27.9%
- By 2100
- 211,781 · +28.3%
Race, ethnicity, and origin ACS 2023
- Neighborhood character
- Predominantly White (92%)
- Race & ethnicity
- White 92% Two or more races 5% Hispanic / Latino 4% Asian 2%
- Common ancestry
- Slovak 5% Lithuanian 4% Italian 3%
- Foreign-born
- 9% · Canada
- Languages at home
- 92% English-only · Spanish 3% Other Indo-European 1% German/W. Germanic 1%
Political lean MEDSL · Indian River
- 2024 margin
- Strong R (+27.4) · D 36.0% · R 63.4%
- 2008→2024 swing
- -12.5pp toward R · 2008: -14.8pp · 2024: -27.4pp
- All cycles
- 2024: R+27.4 2020: R+21.6 2016: R+24.5 2012: R+22.3 2008: R+14.8
Not yet ingested
- Civics
- —
Market trends
- HPI YoY
- ▼ -180.47%
- Current HPI
- 312.0326
- Rent YoY
- ▲ 11.04%
- Metro
- Sebastian-Vero Beach, FL
- State GDP YoY
- ▲ 3.28%
- F500 in state
- 36
Industry mix (Fortune 500 HQ in FL)
| Industry | F500 HQs | Revenue |
|---|---|---|
| Industrial Technology | 2 | $29B |
|
||
| Insurance | 2 | $17B |
|
||
| Retail | 1 | $60B |
|
||
| Technology Distribution | 1 | $58B |
|
||
| Homebuilding | 1 | $35B |
|
||
| Technology Manufacturing | 1 | $35B |
|
||
Price history
+411.4% since first listed8 events — show timeline
- 2026-04-24 Price Changed $450,000 RAIRCMLS
- 2026-03-13 Price Changed $470,000 RAIRCMLS
- 2026-01-31 Price Changed $480,000 RAIRCMLS
- 2026-01-16 Price Changed $495,000 RAIRCMLS
- 2025-10-08 Price Changed $525,000 RAIRCMLS
- 2025-07-24 Listed $545,000 RAIRCMLS
- 1988-01-01 Sold (Public Records) $115,000 Public Records
- 1980-12-01 Sold (Public Records) $88,000 Public Records
Property tax history
+6.5%/yrLatest (2025): $4,452 · +4.3% YoY. Source: county tax records.
Cash-flow waterfall
monthlySold comps — $/sqft
last 12 mo · ≤1 miLoading sold comps…