 Multi-family
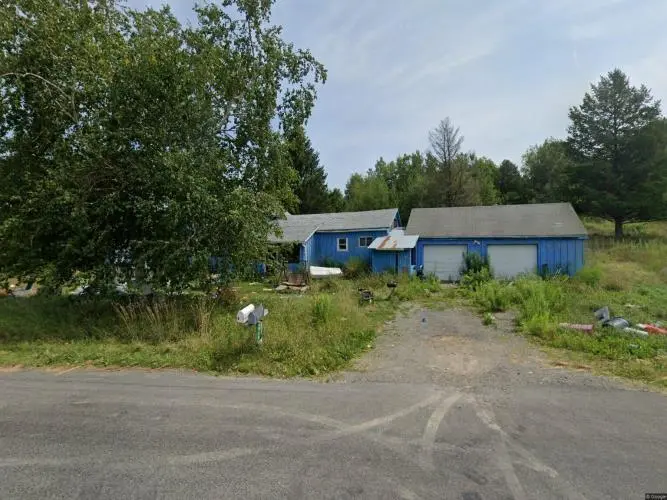
3438 S Hill Rd · McGraw, NY
Flood risk 1/10 · Minimal
- FEMA flood zone
- X (unshaded)
- Chance of flooding over 30 yrs
- 0.0%
- Est. flood insurance / yr
- $473 – $860
Fire risk 1/10 · Minimal
- Est. fire insurance / yr
- $691 – $1,283
Heat risk 1/10 · Minimal
- Hot days now (above 91°F)
- 7 days/yr
- Hot days in 30 yrs
- 14 days/yr
Wind risk 2/10 · Minimal
- Chance of severe wind over 30 yrs
- 1.0%
Air-quality risk 2/10 · Minimal
- Unhealthy air days now
- 0 days/yr
- Unhealthy air days in 30 yrs
- 1 days/yr
Risk factors via First Street. Map © Google.
Why this score? — see what drove the B+ grade
The composite is a weighted blend of 9 inputs, each scored 0–100. Each bar is that input's sub-score; the figure is the points it added to the 100-point composite (weight × sub-score).
- Cash flow +30.0/30.0
- 1% rule +10.0/10.0
- DSCR +10.0/10.0
- ARV discount +7.5/15.0
- Appreciation +7.4/10.0
- Schools +5.0/10.0
- Livability +3.6/5.0
- Rent growth +2.5/5.0
- Condition / age +2.5/5.0
$75,000
🖨 Deal sheet (PDF) 📄 Offer letter ✓ Due diligence
Multi-family units
County records classify this as Multi-Family (2-4 Unit). Listing-text estimate: 1 unit. estimate disagrees with records
Listing remarks MLS
This is a handyman special home, but with solid bones. Currently set up as a duplex, but could easily be made into a single family home. Nice rural setting, with all other houses nearby being nice. Has a 2 car garage. Great location with all neighbors having nice upkept homes.
Key facts
- 2 garage spots
- Built 1860
- Listed 70 days
Neighborhood map
What this means for you Summary
Snapshot
- This is a 5-bed/2.0-bath multifamily listed at $75k.
Deal economics
- At list price, monthly cash flow is $1k ($13k/yr) — positive.
- The deal already cash-flows at list — no discount required.
- Meets the 1% rule at list price ($2k rent vs $75k).
- Recommended offer: $70k (6.0% below list) — sets the bar for market timing.
Location & tenants
- Location reads 71/100 on livability (#411 in NY) — a middle-class / working-renter tenant base. Strengths: cost of living A+, housing A+, crime A-; Watch: schools C-, health & safety D, amenities F.
- Mcgraw Central School District (rural): math 57% / reading 61% proficiency, ranked #252 of 590 in NY (top 43%) — acceptable for families but not a draw, mixed tenant base, ~2y average lease.
- Market conditions: 13 active listings in the ZIP; 45 units permitted in Cortland County in 2024 (12 in 5+ unit buildings).
Forward outlook
- In year one you build about $4k of equity ($519 loan paydown + $4k appreciation (4.9% local appreciation)).
- Cortland County population projected at -15% by 2050 — secular population decline; favor cash flow + early exit over multi-decade hold.
- At projected returns (4.9% appreciation + 3.0% rent growth), your $21k cash investment doubles in ~2 years — after that, you're playing with house money.
- By year 8, paydown + projected appreciation supports a ~$31k cash-out refi (75% LTV) — recoverable capital for the next deal without selling this one.
Negotiation context
- It's been on market 70 days — a 6% lower offer ($70k) is reasonable based on typical stale-listing flexibility.
- Current owner paid $61k; 22% above their basis — modest negotiation headroom, anchor on the comps not their cost.
Risks & watch-outs
- Watch-outs: built in 1860 — expect roof / HVAC / electrical / plumbing capex.
Questions for the listing agent
- It's been on market 70 days. Have you received any prior offers? Is the seller open to a 6% concession, seller financing, or rate buy-down credit?
- Built in 1860 — when were the roof, HVAC, electrical panel, plumbing, and water heater last replaced?
- Why hasn't it sold? Are there any deal-killer items the seller is aware of (foundation, flood, title, zoning, code violations)?
- Is there a deadline driving the sale (1031 exchange, divorce, estate, relocation)? That informs how much negotiation room exists.
- What's the average days-on-market for RENTAL listings here right now (not sales)? A rising rental-DOM trend means longer vacancies and softer asking-rent achievability than the comps imply.
- What's the recent tenant-quality profile in this submarket — average credit score on applications, eviction rate, late-payment / NSF rate, and stable-employment percentage? A property-management company in the area should have these aggregated.
- How much new apartment / multifamily construction is in the pipeline within 1–3 miles? Heavy new supply (>2% of stock underway) typically softens rents 12–24 months out; light construction supports rent growth.
Investment metrics
- 1% rule
- 2.69% ✓
- Cap rate
- 23.47%
- Cash-on-cash
- 61.35%
- DSCR
- 3.73
- GRM
- 3.1
CMA / ARV
- ARV (median comp)
- $200,744
- List price
- $75,000
- Delta
- -62.64%
- Verdict
- UNDERPRICED
- Comps
- 6 within 2.0 mi
Projected returns pro-forma
4.86% appreciation · 3.0% rent growth · sell at horizon
- IRR
- 68.1%
- Equity multiple
- 5.05×
- Total profit
- $85,081
- Equity at exit
- $41,852
- IRR
- 66.1%
- Equity multiple
- 10.45×
- Total profit
- $198,452
- Equity at exit
- $71,700
Cash invested: $21,000 (down + closing). Projections, not guarantees.
Landlord ↔ Tenant lean methodology
- Overall (STATE)
- 15 Strongly Tenant-Friendly
- State New York
- 15 Strongly Tenant-Friendly · D+10
- County
- — inherits STATE
- City
- — inherits STATE
ZIP-level market 13101
- Home prices YoY
- 1.6%
- Active inventory
- 13
- Price-to-rent
- 6.2×
Monthly cashflow live
- Estimated rent
- $2,015 medium interval (Pro) →
- Mortgage (P&I)
- −$393
- Tax est. 1.5%
- −$94 /mo · $1,125/yr
- Insurance
- −$31
- HOA
- −$0
- Vacancy / Maint / Mgmt
- −$423
- Net cashflow
- $1,074
Break-even live
Sensitivity live
| Price | -10% $1,125 | -5% $1,099 | +0% $1,074 | +5% $1,048 | +10% $1,022 |
|---|---|---|---|---|---|
| Rent | -10% $914 | -5% $994 | +0% $1,074 | +5% $1,153 | +10% $1,233 |
| Rate | -1.0pp $1,111 | -0.5pp $1,093 | base $1,074 | +0.5pp $1,054 | +1.0pp $1,034 |
2-unit breakdown (identical units grouped — click to expand)
| Units | Beds | Baths | Est. rent |
|---|---|---|---|
| 2× units | 2 | 1 | $2,014 |
| #1 | 2 | 1 | $1,007 |
| #2 | 2 | 1 | $1,007 |
| Total (2 units) | $2,015 | ||
UW: 25.0% down · 7.5% · 30yr · 1.5% tax · 5.0% vac · 8.0% maint · 8.0% mgmt
Financing live
Cash to close
- Down payment
- $18,750
- Closing costs
- $2,250
- Reserves months
- —
- Total cash needed
- —
Loan-product check · same deal, 3 products live
Conventional
25% down · 7.5% · 30yr
- Down + closing
- —
- Monthly P&I
- —
- Monthly cashflow
- —
- DSCR
- —
- Eligible?
- —
Personal DTI + credit; lowest rate.
DSCR
20% down · 8.5% · 30yr
- Down + closing
- —
- Monthly P&I
- —
- Monthly cashflow
- —
- DSCR
- —
- Eligible?
- —
No personal income docs; deal must DSCR.
Hard money
10% down · 12.0% · 12mo
- Down + closing
- —
- Monthly P&I
- —
- Monthly cashflow
- —
- DSCR
- —
- Eligible?
- —
Short-term bridge; refi at stabilization.
Listing history 20 events
-
2026-06-19days on market $75,000 Active 70 DOM
-
2026-06-18days on market $75,000 Active 69 DOM
-
2026-06-17days on market $75,000 Active 68 DOM
-
2026-06-16days on market $75,000 Active 67 DOM
-
2026-06-15days on market $75,000 Active 66 DOM
-
2026-06-14days on market $75,000 Active 64 DOM
-
2026-06-12days on market $75,000 Active 63 DOM
-
2026-06-09days on market $75,000 Active 60 DOM
-
2026-06-08days on market $75,000 Active 59 DOM
-
2026-06-07days on market $75,000 Active 58 DOM
-
2026-06-05days on market $75,000 Active 55 DOM
-
2026-06-03days on market $75,000 Active 54 DOM
-
2026-06-02days on market $75,000 Active 53 DOM
-
2026-06-01days on market $75,000 Active 52 DOM
-
2026-05-31days on market $75,000 Active 51 DOM
-
2026-05-30days on market $75,000 Active 50 DOM
-
2026-04-06$75,000 Active 277-char remark
Show marketing remark (277 chars)
This is a handyman special home, but with solid bones. Currently set up as a duplex, but could easily be made into a single family home. Nice rural setting, with all other houses nearby being nice. Has a 2 car garage. Great location with all neighbors having nice upkept homes.
-
2025-01-30soldstatus $61,250
-
2008-12-23soldstatus $117,000
-
2002-06-20soldstatus $76,000
ⓘ Source: listings_history table (triggers on properties + properties_extension) + one-shot
backfill from property_details.listing_events for pre-trigger history.
Climate risk First Street
- Flood 1/10 Low FEMA zone X (unshaded) · 0% chance over 30 yrs
- Wildfire 1/10 Low
- Heat 1/10 Low 7 d/yr ≥91°F today · 14 d/yr by 30 yrs out
- Wind 2/10 Low 100% chance of damaging wind over 30 yrs
- Air quality 2/10 Low 0 unhealthy d/yr today · 1 by 30 yrs out
Nearby sold comps map
Loading sold comps map…
Walkable amenities ~0.75 mi
Loading nearby amenities…
Taxation est. · year 1
- Rental income
- $24,180
- − Mortgage interest
- −$4,201
- − Property taxes
- −$1,125
- − Insurance
- −$375
- − Repairs & maintenance
- −$1,934
- − Management
- −$1,934
- − Depreciation
- −$2,182
- Taxable income
- $12,428
- Est. tax owed @ 24.0%
- −$2,983
- After-tax cash flow
- $9,900/yr
For passive investors: Depreciation is non-cash, so a rental often shows a tax loss while cash-flowing — sheltering income. Rental losses are passive: they offset passive income freely, and up to $25,000/yr can offset ordinary (W-2) income if you actively participate and your MAGI is under $100k (phasing out to $0 by $150k); unused losses carry forward. On sale, claimed depreciation is recaptured at up to 25%, and gains may owe capital-gains tax (a 1031 exchange can defer both). Figures are a year-1 estimate at your 24.0% rate — not tax advice; consult a CPA.
Schools (NCES district)
- District
- Mcgraw Central School District
- NCES district ID
- 3618840
- Math proficiency
- 57% ▲ 7.00%
- Reading proficiency
- 61% ▲ 11.00%
- Median HH income
- $51,404
- Composite
- 50.37/100
- National rank
- #1875
- State rank
- #252 of 590 in NY
Livability — McGraw
- Score
- 71/100
- State rank
- #411
- US rank
- #7091
Category grades
Schools grade is shown separately in the Schools card above.
Census & demographics
- Population (ZIP)
- 2,221
Population outlook (Cortland County) Hauer SSP2
- Today (2025)
- 47,543 people
- By 2030
- 46,107 · -3.0%
- By 2040
- 43,122 · -9.3%
- By 2050
- 40,216 · -15.4%
- By 2075
- 34,717 · -27.0%
- By 2100
- 28,953 · -39.1%
Race, ethnicity, and origin ACS 2023
- Neighborhood character
- Predominantly White (94%)
- Race & ethnicity
- White 94% Two or more races 4% Hispanic / Latino 2%
- Common ancestry
- Romanian 3% Iranian 3% Serbian 2%
- Foreign-born
- 0% · Canada
- Languages at home
- 98% English-only · Spanish 1%
Political lean MEDSL · Cortland
- 2024 margin
- Lean R (+6.4) · D 46.8% · R 53.2%
- 2008→2024 swing
- -16.4pp toward R · 2008: 10.0pp · 2024: -6.4pp
- All cycles
- 2024: R+6.4 2020: R+1.9 2016: R+6.7 2012: D+8.8 2008: D+10.0
Not yet ingested
- Civics
- —
Market trends
- HPI YoY
- ▲ 4.86%
- Current HPI
- 305.3272
- Rent YoY
- —
- Metro
- —
- State GDP YoY
- ▲ 2.60%
- F500 in state
- 92
Industry mix (Fortune 500 HQ in NY)
| Industry | F500 HQs | Revenue |
|---|---|---|
| Financial Services | 10 | $950B |
|
||
| Consumer Goods | 9 | $162B |
|
||
| Insurance | 4 | $225B |
|
||
| Telecommunications | 2 | $144B |
|
||
| Pharmaceuticals | 2 | $112B |
|
||
| Media / Entertainment | 2 | $69B |
|
||
Price history
-1.3% since first listed4 events — show timeline
- 2026-04-06 Listed $75,000 Fizber.com
- 2025-01-30 Sold (Public Records) $61,250 Public Records
- 2008-12-23 Sold (Public Records) $117,000 Public Records
- 2002-06-20 Sold (Public Records) $76,000 Public Records
Property tax history
-1.9%/yrLatest (2025): $4,901 · +0.7% YoY. Source: county tax records.
Cash-flow waterfall
monthlySold comps — $/sqft
last 12 mo · ≤1 miLoading sold comps…