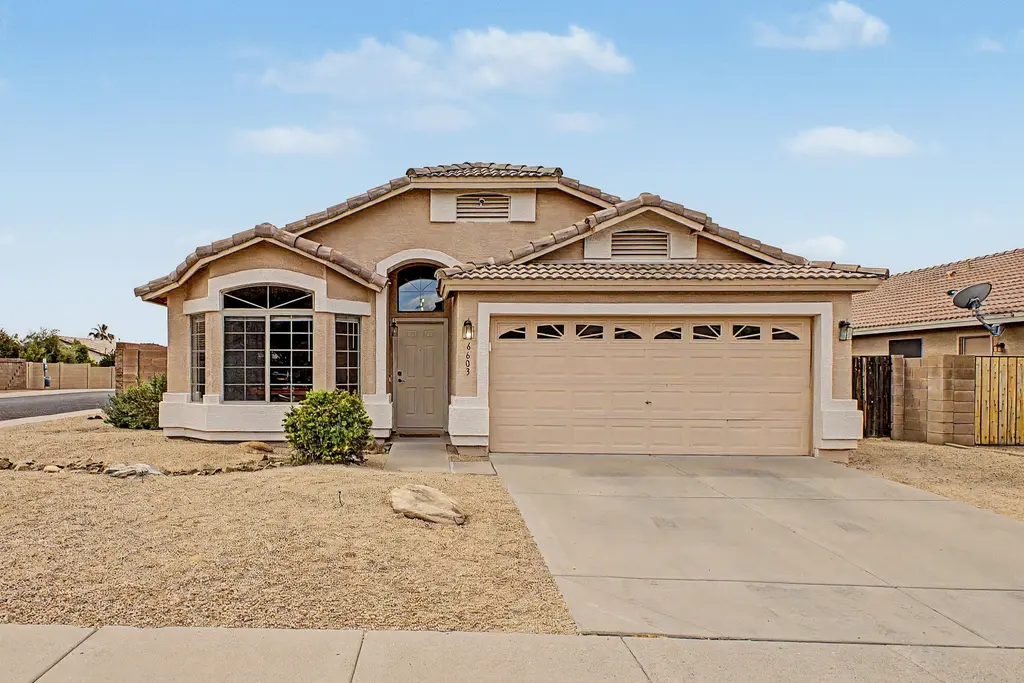
6603 W Prickly Pear Trl · Phoenix, AZ
Flood risk 1/10 · Minimal
- FEMA flood zone
- X (shaded)
- Chance of flooding over 30 yrs
- 0.0%
- Est. flood insurance / yr
- $507 – $1,088
Fire risk 5/10 · Moderate
- Est. fire insurance / yr
- $610 – $1,132
Heat risk 8/10 · Major
- Hot days now (above 111°F)
- 6 days/yr
- Hot days in 30 yrs
- 14 days/yr
Wind risk 1/10 · Minimal
- Chance of severe wind over 30 yrs
- —
Air-quality risk 2/10 · Minimal
- Unhealthy air days now
- 2 days/yr
- Unhealthy air days in 30 yrs
- 2 days/yr
Risk factors via First Street. Map © Google.
Why this score? — see what drove the D grade
The composite is a weighted blend of 9 inputs, each scored 0–100. Each bar is that input's sub-score; the figure is the points it added to the 100-point composite (weight × sub-score).
- Appreciation +10.0/10.0
- ARV discount +8.9/15.0
- Cash flow +6.7/30.0
- Schools +4.7/10.0
- Livability +3.8/5.0
- Rent growth +3.1/5.0
- Condition / age +2.5/5.0
- DSCR +0.9/10.0
- 1% rule +0.6/10.0
$475,000
🖨 Deal sheet (PDF) 📄 Offer letter ✓ Due diligence
Listing remarks MLS
Discover this beautifully updated 3-bedroom, 2-bath home perfectly situated on a desirable corner lot with mountain views. Offering 1,684 sq. ft. of bright, open living space, this home features soaring vaulted ceilings, leased solar, modern vinyl plank flooring, crisp neutral tones, and abundant natural light throughout. The stunning kitchen boasts quartz countertops, a custom backsplash, sleek stainless steel appliances, and white cabinetry. The generous primary suite offers a relaxing bay window, dual vanities, a separate soaking tub and shower, and a walk-in closet. Step outside to a serene covered patio and enjoy the low-maintenance backyard with artificial turf, extended pavers, a firepit, and mountain views. Ideally located with easy access to Loop 101 and I-17, and close to schools, parks, shopping, dining, and recreation areas. This move-in ready home won't last long!
Key facts
- 6,508 sq ft lot
- 2 garage spots
- Built 2000
Neighborhood map
What this means for you Summary
Snapshot
- This is a 3-bed/3.0-bath single-family listed at $475k.
Deal economics
- At list price, monthly cash flow is $-770 ($-9k/yr) — negative.
- To cash-flow at today's rent, offer at most $339k (28.6% below list).
- To meet the 1% rule (rent ≥ 1% of price), the offer needs to be $266k (44.0% below list).
- Recommended offer: $266k (44.0% below list) — sets the bar for 1% rule.
- Cap rate 4.3% vs local median 3.3% in Phoenix — top-decile yield for the area; either an underpriced asset or a hidden risk that comps aren't pricing in. Stress-test before assuming the spread holds.
Location & tenants
- Location reads 75/100 on livability (#16 in AZ, #3,924 nationally) — a middle-class / working-renter tenant base. Strengths: amenities A+, commute A+, housing A+; Watch: health & safety C-, crime F.
- Deer Valley Unified District (4246) (urban): math 50% / reading 55% proficiency, ranked #33 of 249 in AZ (top 13%) — acceptable for families but not a draw, mixed tenant base, ~2y average lease.
- Zoned schools: Las Brisas Elementary School (math 57% / reading 63%, grade B-, #146 of 1,109 statewide, top 13%, 476 students, 18% FRL); Hillcrest Middle School (math 49% / reading 60%, grade B-, #15 of 218 statewide, top 7%, 899 students, 14% FRL); Mountain Ridge High School (math 51% / reading 55%, grade C-, #29 of 381 statewide, top 8%, 2,771 students, 10% FRL).
- Market conditions: Rents rising (+2.3%/yr); 123 active listings in the ZIP; 31 comparable units currently listed for rent nearby; rentals at typical pace (median 17d on market — plan ~3-4 weeks tenant-placement turnaround); high-income renter base; 36,011 units permitted in Maricopa County in 2024 (12,801 in 5+ unit buildings).
Forward outlook
- In year one you build about $51k of equity ($3k loan paydown + $48k appreciation (10.0% local appreciation)).
- Maricopa County population projected at +38% by 2050 — long-run rental-demand tailwind backs the buy-and-hold thesis.
- By year 2, paydown + projected appreciation supports a ~$82k cash-out refi (75% LTV) — recoverable capital for the next deal without selling this one.
Negotiation context
- It's been on market 39 days — a 3% lower offer ($461k) is reasonable based on typical stale-listing flexibility.
- 5 sale attempts since 26y ago with the ask held roughly flat each time — persistent listings suggest the price (not the market) is what's stuck; bring a comps-based counter.
- Current owner paid $342k; 39% above their basis — modest negotiation headroom, anchor on the comps not their cost.
Risks & watch-outs
- Climate carrying-cost: moderate wildfire risk; extreme-heat days projected 6→14/yr by 2055 (HVAC capex compounding) — expect insurance premiums to compound above CPI over the hold.
Questions for the listing agent
- What do current leases actually rent for vs. the listed asking? Can we see a recent rent roll and the last 12 months of T-12 income?
- It's been on market 39 days. Have you received any prior offers? Is the seller open to a 44% concession, seller financing, or rate buy-down credit?
- What does the HOA fee cover, when was the last increase, and are there any pending special assessments or reserve-fund shortfalls?
- Is there a deadline driving the sale (1031 exchange, divorce, estate, relocation)? That informs how much negotiation room exists.
- Crime grade is F in this area — have there been break-ins, vandalism, or insurance claims at this property in the last 3 years? What carrier currently insures it and at what premium?
- The area grade is low — what's the realistic commute time and amenity access for the typical tenant pool here? Any planned neighborhood developments (good or bad) we should know about?
- What's the average days-on-market for RENTAL listings here right now (not sales)? A rising rental-DOM trend means longer vacancies and softer asking-rent achievability than the comps imply.
- What's the recent tenant-quality profile in this submarket — average credit score on applications, eviction rate, late-payment / NSF rate, and stable-employment percentage? A property-management company in the area should have these aggregated.
- How much new for-sale + rental construction is in the pipeline within 1–3 miles? Heavy new supply typically softens prices + rents 12–24 months out; constrained supply supports both.
Investment metrics
- 1% rule
- 0.56% ✗
- Cap rate
- 4.35%
- Cash-on-cash
- -6.95%
- DSCR
- 0.69
- GRM
- 14.9
CMA / ARV
- ARV (median comp)
- $490,013
- List price
- $475,000
- Delta
- -3.06%
- Verdict
- FAIR
- Comps
- 20 within 1.0 mi
Show comp detail 12 sales within ~0.75 mi
| Address | Dist | Beds/Ba | Sqft | Sold | Price | $/sf | Match |
|---|---|---|---|---|---|---|---|
| 6603 W Prickly Pear Trl | 0.00mi | 3/2.0 | 1,684 (0%) | 0mo | $475,000 | $282 | 96 |
| 6772 W Buckskin Trl | 0.46mi | 3/2.0 | 1,694 (+1%) | 5mo | $449,000 | $265 | 69 |
| 6614 W Desert Hollow Dr | 0.33mi | 3/2.0 | 1,571 (-7%) | 2mo | $480,000 | $306 | 68 |
| 6512 W Range Mule Dr | 0.16mi | 3/2.0 | 1,867 (+11%) | 5mo | $477,500 | $256 | 66 |
| 6792 W Tether Trl | 0.40mi | 3/2.0 | 1,565 (-7%) | 1mo | $459,900 | $294 | 65 |
| 26390 N 68th Dr | 0.44mi | 4/2.0 (+1) | 1,730 (+3%) | 1mo | $485,000 | $280 | 65 |
| 25841 N 66th Dr | 0.11mi | 4/2.0 (+1) | 1,884 (+12%) | 3mo | $479,000 | $254 | 64 |
| 6602 W West Wind Dr | 0.67mi | 3/2.5 | 1,695 (+1%) | 6mo | $485,000 | $286 | 61 |
| 6426 W Prickly Pear Trl | 0.18mi | 4/2.0 (+1) | 1,868 (+11%) | 6mo | $515,000 | $276 | 59 |
| 26806 N 65th Dr | 0.48mi | 3/2.0 | 1,845 (+10%) | 2mo | $480,000 | $260 | 56 |
| 6432 W Villa Linda Dr | 0.56mi | 3/2.0 | 1,554 (-8%) | 3mo | $419,900 | $270 | 55 |
| 6617 W Cavedale Dr | 0.47mi | 3/2.0 | 1,845 (+10%) | 4mo | $468,000 | $254 | 55 |
Match score weights: distance 35% · size 25% · config 20% · recency 20%. Top-matched comps best support the ARV.
Projected returns pro-forma
10.0% appreciation · 2.29% rent growth · sell at horizon
- IRR
- 19.2%
- Equity multiple
- 2.56×
- Total profit
- $207,561
- Equity at exit
- $427,918
- IRR
- 17.6%
- Equity multiple
- 5.85×
- Total profit
- $645,654
- Equity at exit
- $922,821
Cash invested: $133,000 (down + closing). Projections, not guarantees.
Landlord ↔ Tenant lean methodology
- Overall (STATE)
- 87 Strongly Landlord-Friendly
- State Arizona
- 87 Strongly Landlord-Friendly · R+3
- County
- — inherits STATE
- City
- — inherits STATE
ZIP-level market 85083
- Home prices YoY
- 5.4%
- Rents YoY
- 2.3%
- Active inventory
- 123
- Price-to-rent
- 14.9×
Monthly cashflow live
- Estimated rent
- $2,658 high interval (Pro) →
- Mortgage (P&I)
- −$2,491
- Tax from tax record
- −$156 /mo · $1,868/yr
- Insurance
- −$198
- HOA
- −$25
- Vacancy / Maint / Mgmt
- −$558
- Net cashflow
- $-770
Break-even live
Sensitivity live
| Price | -10% $-501 | -5% $-635 | +0% $-770 | +5% $-904 | +10% $-1,039 |
|---|---|---|---|---|---|
| Rent | -10% $-980 | -5% $-875 | +0% $-770 | +5% $-665 | +10% $-560 |
| Rate | -1.0pp $-531 | -0.5pp $-649 | base $-770 | +0.5pp $-893 | +1.0pp $-1,018 |
UW: 25.0% down · 7.5% · 30yr · 1.5% tax · 5.0% vac · 8.0% maint · 8.0% mgmt
Financing live
Cash to close
- Down payment
- $118,750
- Closing costs
- $14,250
- Reserves months
- —
- Total cash needed
- —
Loan-product check · same deal, 3 products live
Conventional
25% down · 7.5% · 30yr
- Down + closing
- —
- Monthly P&I
- —
- Monthly cashflow
- —
- DSCR
- —
- Eligible?
- —
Personal DTI + credit; lowest rate.
DSCR
20% down · 8.5% · 30yr
- Down + closing
- —
- Monthly P&I
- —
- Monthly cashflow
- —
- DSCR
- —
- Eligible?
- —
No personal income docs; deal must DSCR.
Hard money
10% down · 12.0% · 12mo
- Down + closing
- —
- Monthly P&I
- —
- Monthly cashflow
- —
- DSCR
- —
- Eligible?
- —
Short-term bridge; refi at stabilization.
Rent comps 31 comps
| Address | Beds | Baths | Sqft | Rent | $/sqft | DOM | Units | Dist |
|---|---|---|---|---|---|---|---|---|
| 6504 W Saddlehorn Rd Phoenix, AZ | 3.0 | 2.0 | 1258 | $2,245 | $1.78 | 6d | 1 | 0.31mi |
| 6424 W Saddlehorn Rd Phoenix, AZ | 4.0 | 2.0 | 1647 | $2,195 | $1.33 | 9d | 1 | 0.33mi |
| 6602 W Desert Hollow Dr Phoenix, AZ | 3.0 | 2.0 | 1571 | $2,150 | $1.37 | 20d | 1 | 0.35mi |
| 6602 W Desert Hollow Dr Phoenix, AZ | 3.0 | 2.0 | 1571 | $2,150 | $1.37 | 3d | 1 | 0.35mi |
| 6611 W Desert Hollow Dr Phoenix, AZ | 3.0 | 2.0 | 1571 | $2,350 | $1.50 | 26d | 1 | 0.39mi |
| 6853 W Remuda Dr Peoria, AZ | 4.0 | 2.0 | 2162 | $2,550 | $1.18 | 16d | 1 | 0.40mi |
| 25223 N 63rd Dr Phoenix, AZ | 3.0 | 2.5 | 2113 | $2,200 | $1.04 | 45d | 1 | 0.46mi |
| 6771 W Bronco Trl Peoria, AZ | 4.0 | 2.5 | 2101 | $2,500 | $1.19 | 45d | 1 | 0.47mi |
| 6889 W Paso Trl Peoria, AZ | 4.0 | 2.0 | 1854 | $2,450 | $1.32 | 14d | 1 | 0.47mi |
| 6933 W Remuda Dr Peoria, AZ | 3.0 | 2.0 | 2161 | $2,795 | $1.29 | 26d | 1 | 0.53mi |
| 25014 N 68th Ave Peoria, AZ | 3.0 | 2.0 | 1600 | $2,350 | $1.47 | 45d | 1 | 0.60mi |
| 6427 W Villa Linda Dr Glendale, AZ | 3.0 | 2.0 | 1532 | $2,150 | $1.40 | 45d | 1 | 0.61mi |
| 24616 N 65th Ave Glendale, AZ | 3.0 | 2.0 | 1576 | $2,300 | $1.46 | 0d | 1 | 0.75mi |
| 7103 W Jasmine Trl Peoria, AZ | 3.0 | 2.0 | 1962 | $2,700 | $1.38 | 26d | 1 | 0.78mi |
| 6102 W Fallen Leaf Ln Glendale, AZ | 4.0 | 3.0 | 2018 | $2,350 | $1.16 | 26d | 1 | 0.78mi |
| 7117 W Andrea Dr Peoria, AZ | 3.0 | 2.0 | 2012 | $2,550 | $1.27 | 45d | 1 | 0.83mi |
| 6124 W Whispering Wind Dr Glendale, AZ | 3.0 | 2.0 | 1305 | $2,295 | $1.76 | 45d | 1 | 0.90mi |
| 27383 N 69th Ln Peoria, AZ | 4.0 | 3.0 | 2084 | $2,995 | $1.44 | 9d | 1 | 0.91mi |
| 27383 N 69th Ln Peoria, AZ | 4.0 | 3.0 | 2084 | $2,995 | $1.44 | 14d | 1 | 0.91mi |
| 6964 W Buckhorn Trl Peoria, AZ | 4.0 | 3.0 | 2084 | $2,950 | $1.42 | 14d | 1 | 0.92mi |
| 6972 W Buckhorn Trl Peoria, AZ | 3.0 | 2.5 | 1989 | $2,850 | $1.43 | 4d | 1 | 0.93mi |
| 6101 W Whispering Wind Dr Glendale, AZ | 4.0 | 2.5 | 1938 | $2,950 | $1.52 | 20d | 1 | 0.95mi |
| 6991 W Pinnacle Vista Dr Peoria, AZ | 3.0 | 2.5 | 1989 | $2,850 | $1.43 | 16d | 1 | 0.96mi |
| 6999 W Pinnacle Vista Dr Peoria, AZ | 4.0 | 3.0 | 2084 | $2,950 | $1.42 | 1d | 1 | 0.96mi |
| 27513 N 63rd Dr Phoenix, AZ | 3.0 | 2.5 | 1866 | $2,395 | $1.28 | 16d | 1 | 1.12mi |
| 6458 W Blue Sky Dr Phoenix, AZ | 4.0 | 3.0 | 2230 | $2,095 | $0.94 | 16d | 1 | 1.17mi |
| 7378 W Buckhorn Trl Peoria, AZ | 4.0 | 3.0 | 2084 | $3,000 | $1.44 | 26d | 1 | 1.31mi |
| 5925 W Cielo Grande Glendale, AZ | 4.0 | 2.0 | 1886 | $2,695 | $1.43 | 20d | 1 | 1.42mi |
| 7297 W Blue Sky Dr Peoria, AZ | 3.0 | 2.5 | 1974 | $3,195 | $1.62 | 9d | 1 | 1.44mi |
| 7297 W Blue Sky Dr Peoria, AZ | 3.0 | 2.5 | 1974 | $3,195 | $1.62 | 16d | 1 | 1.44mi |
| 5310 W Chisum Trl Phoenix, AZ | 3.0 | 2.5 | 1719 | $2,195 | $1.28 | 1d | 1 | 1.45mi |
HOA detail
- Monthly dues
- $25 · $300/yr
Listing history 18 events
-
2026-05-13historical Under Contract Accepting Backups 890-char remark
Show marketing remark (890 chars)
Discover this beautifully updated 3-bedroom, 2-bath home perfectly situated on a desirable corner lot with mountain views. Offering 1,684 sq. ft. of bright, open living space, this home features soaring vaulted ceilings, leased solar, modern vinyl plank flooring, crisp neutral tones, and abundant natural light throughout. The stunning kitchen boasts quartz countertops, a custom backsplash, sleek stainless steel appliances, and white cabinetry. The generous primary suite offers a relaxing bay window, dual vanities, a separate soaking tub and shower, and a walk-in closet. Step outside to a serene covered patio and enjoy the low-maintenance backyard with artificial turf, extended pavers, a firepit, and mountain views. Ideally located with easy access to Loop 101 and I-17, and close to schools, parks, shopping, dining, and recreation areas. This move-in ready home won't last long!
-
2026-04-16$475,000 Active 890-char remark
Show marketing remark (890 chars)
Discover this beautifully updated 3-bedroom, 2-bath home perfectly situated on a desirable corner lot with mountain views. Offering 1,684 sq. ft. of bright, open living space, this home features soaring vaulted ceilings, leased solar, modern vinyl plank flooring, crisp neutral tones, and abundant natural light throughout. The stunning kitchen boasts quartz countertops, a custom backsplash, sleek stainless steel appliances, and white cabinetry. The generous primary suite offers a relaxing bay window, dual vanities, a separate soaking tub and shower, and a walk-in closet. Step outside to a serene covered patio and enjoy the low-maintenance backyard with artificial turf, extended pavers, a firepit, and mountain views. Ideally located with easy access to Loop 101 and I-17, and close to schools, parks, shopping, dining, and recreation areas. This move-in ready home won't last long!
-
2026-04-15historical $475,000 890-char remark
Show marketing remark (890 chars)
Discover this beautifully updated 3-bedroom, 2-bath home perfectly situated on a desirable corner lot with mountain views. Offering 1,684 sq. ft. of bright, open living space, this home features soaring vaulted ceilings, leased solar, modern vinyl plank flooring, crisp neutral tones, and abundant natural light throughout. The stunning kitchen boasts quartz countertops, a custom backsplash, sleek stainless steel appliances, and white cabinetry. The generous primary suite offers a relaxing bay window, dual vanities, a separate soaking tub and shower, and a walk-in closet. Step outside to a serene covered patio and enjoy the low-maintenance backyard with artificial turf, extended pavers, a firepit, and mountain views. Ideally located with easy access to Loop 101 and I-17, and close to schools, parks, shopping, dining, and recreation areas. This move-in ready home won't last long!
-
2020-11-02soldstatus $342,000 Closed 609-char remark
Show marketing remark (609 chars)
Single Level 3 Bed 2 Bath home w/ a 2 car garage on a corner lot! Newly renovated w/vaulted ceilings, newer waterproof laminate flooring throughout. Generously sized windows allowing great natural lighting. Kitchen is open to the family room & has white cabinets, quartz counters, stainless steel appliances w/ an island/bar. Built-in plant shelves offer space for your collections or greenery in the primary bedroom and kitchen. The primary ensuite includes a separate shower & tub, double sinks and a walk-in closet. Backyard has a covered patio, grass & pavers with breathtaking Mountain Views!
-
2020-11-02soldstatus $342,000
Show marketing remark (609 chars)
Single Level 3 Bed 2 Bath home w/ a 2 car garage on a corner lot! Newly renovated w/vaulted ceilings, newer waterproof laminate flooring throughout. Generously sized windows allowing great natural lighting. Kitchen is open to the family room & has white cabinets, quartz counters, stainless steel appliances w/ an island/bar. Built-in plant shelves offer space for your collections or greenery in the primary bedroom and kitchen. The primary ensuite includes a separate shower & tub, double sinks and a walk-in closet. Backyard has a covered patio, grass & pavers with breathtaking Mountain Views!
-
2020-10-02historical Under Contract Accepting Backups 609-char remark
Show marketing remark (609 chars)
Single Level 3 Bed 2 Bath home w/ a 2 car garage on a corner lot! Newly renovated w/vaulted ceilings, newer waterproof laminate flooring throughout. Generously sized windows allowing great natural lighting. Kitchen is open to the family room & has white cabinets, quartz counters, stainless steel appliances w/ an island/bar. Built-in plant shelves offer space for your collections or greenery in the primary bedroom and kitchen. The primary ensuite includes a separate shower & tub, double sinks and a walk-in closet. Backyard has a covered patio, grass & pavers with breathtaking Mountain Views!
-
2020-09-30$345,000 Active 609-char remark
Show marketing remark (609 chars)
Single Level 3 Bed 2 Bath home w/ a 2 car garage on a corner lot! Newly renovated w/vaulted ceilings, newer waterproof laminate flooring throughout. Generously sized windows allowing great natural lighting. Kitchen is open to the family room & has white cabinets, quartz counters, stainless steel appliances w/ an island/bar. Built-in plant shelves offer space for your collections or greenery in the primary bedroom and kitchen. The primary ensuite includes a separate shower & tub, double sinks and a walk-in closet. Backyard has a covered patio, grass & pavers with breathtaking Mountain Views!
-
2019-06-21soldstatus $289,000 Closed
-
2019-06-21soldstatus $289,000
-
2019-05-25historical Under Contract Accepting Backups
-
2019-05-18status Active
-
2019-04-25historical Under Contract Accepting Backups
-
2019-04-12$293,500 Active
-
2004-09-09soldstatus $209,900
-
2001-01-26soldstatus $132,000
-
2001-01-26soldstatus $138,533
-
2000-12-20historical
-
2000-09-13$142,965
ⓘ Source: listings_history table (triggers on properties + properties_extension) + one-shot
backfill from property_details.listing_events for pre-trigger history.
Tax reassessment forecast AZ · Resets to sale price
- Current annual tax
- $1,868 · $156/mo
- Projected year-2 tax
- $3,135 · $261/mo
- Expected delta
- +$1,267/yr (+$106/mo · 67.8%)
ⓘ Screening estimate from a state-policy table — verify with the county assessor before closing.
Climate risk First Street
- Flood 1/10 Low FEMA zone X (shaded) · 0% chance over 30 yrs
- Wildfire 5/10 Major
- Heat 8/10 Severe 6 d/yr ≥111°F today · 14 d/yr by 30 yrs out
- Wind 1/10 Low
- Air quality 2/10 Low 2 unhealthy d/yr today · 2 by 30 yrs out
Nearby sold comps map
Loading sold comps map…
Walkable amenities ~0.75 mi
Loading nearby amenities…
Taxation est. · year 1
- Rental income
- $31,893
- − Mortgage interest
- −$26,607
- − Property taxes
- −$1,868
- − Insurance
- −$2,375
- − Repairs & maintenance
- −$2,551
- − Management
- −$2,551
- − HOA
- −$300
- − Depreciation
- −$13,818
- Taxable loss
- −$18,179
- Est. tax savings @ 24.0%
- +$4,363
- After-tax cash flow
- $-4,876/yr
For passive investors: Depreciation is non-cash, so a rental often shows a tax loss while cash-flowing — sheltering income. Rental losses are passive: they offset passive income freely, and up to $25,000/yr can offset ordinary (W-2) income if you actively participate and your MAGI is under $100k (phasing out to $0 by $150k); unused losses carry forward. On sale, claimed depreciation is recaptured at up to 25%, and gains may owe capital-gains tax (a 1031 exchange can defer both). Figures are a year-1 estimate at your 24.0% rate — not tax advice; consult a CPA.
Schools (NCES district)
- District
- Deer Valley Unified District (4246)
- NCES district ID
- 0407750
- Math proficiency
- 50% ▼ -9.00%
- Reading proficiency
- 55% ▼ -6.00%
- Median HH income
- $72,516
- Composite
- 47.0/100
- National rank
- #2346
- State rank
- #33 of 249 in AZ
Livability — Phoenix
- Score
- 75/100
- State rank
- #16
- US rank
- #3924
Category grades
Schools grade is shown separately in the Schools card above.
Census & demographics
- Census place
- Phoenix, AZ
- County
- Maricopa County · 4,537,380 people
- City population
- 1,500,198
- Metro
- Phoenix-Mesa-Chandler, AZ
- Population (ZIP)
- 21,022
- Household income
- $149,087
- Rent vs Own
- Severe rent burden
- 81.0
Population outlook (Maricopa County) Hauer SSP2
- Today (2025)
- 4,979,203 people
- By 2030
- 5,378,229 · +8.0%
- By 2040
- 6,156,598 · +23.6%
- By 2050
- 6,872,376 · +38.0%
- By 2075
- 8,401,270 · +68.7%
- By 2100
- 9,247,439 · +85.7%
Race, ethnicity, and origin ACS 2023
- Neighborhood character
- Predominantly White (74%)
- Race & ethnicity
- White 74% Asian 10% Hispanic / Latino 10% Two or more races 6% Black 2%
- Hispanic origin (detail)
- Mexican 8%
- Common ancestry
- Portuguese 3% Lithuanian 2% Scandinavian 2%
- Foreign-born
- 14% · Canada, China, Vietnam
- Languages at home
- 83% English-only · Other Indo-European 7% Other Asian/Pacific 3% Spanish 3%
Political lean MEDSL · Maricopa
- 2024 margin
- Toss-up / Even · D 47.7% · R 51.2% · Other 1.1%
- 2008→2024 swing
- +7.1pp toward D · 2008: -10.6pp · 2024: -3.5pp
- All cycles
- 2024: R+3.5 2020: D+2.2 2016: R+3.5 2012: R+12.0 2008: R+10.6
Not yet ingested
- Civics
- —
Market trends
- HPI YoY
- ▲ 14.78%
- Current HPI
- 289.2128
- Rent YoY
- ▲ 2.29%
- Metro
- Phoenix-Mesa-Chandler, AZ
- State GDP YoY
- ▲ 4.54%
- F500 in state
- 20
Industry mix (Fortune 500 HQ in AZ)
| Industry | F500 HQs | Revenue |
|---|---|---|
| Technology | 2 | $13B |
|
||
| Mining / Metals | 1 | $23B |
|
||
| Environmental Services | 1 | $16B |
|
||
| Metals / Steel | 1 | $14B |
|
||
| Technology Distribution | 1 | $9B |
|
||
| Homebuilding | 1 | $8B |
|
||
Price history
+232.2% since first listed18 events — show timeline
- 2026-05-13 Contingent — ARMLS
- 2026-04-16 Listed $475,000 ARMLS
- 2026-04-15 Coming Soon $475,000 ARMLS
- 2020-11-02 Sold (Public Records) $342,000 Public Records
- 2020-11-02 Sold (MLS) $342,000 ARMLS
- 2020-10-02 Contingent — ARMLS
- 2020-09-30 Listed $345,000 ARMLS
- 2019-06-21 Sold (Public Records) $289,000 Public Records
- 2019-06-21 Sold (MLS) $289,000 ARMLS
- 2019-05-25 Contingent — ARMLS
- 2019-05-18 Relisted — ARMLS
- 2019-04-25 Contingent — ARMLS
- 2019-04-12 Listed $293,500 ARMLS
- 2004-09-09 Sold (Public Records) $209,900 Public Records
- 2001-01-26 Sold (Public Records) $138,533 Public Records
- 2001-01-26 Sold (MLS) $132,000 ARMLS
- 2000-12-20 Listing Removed — ARMLS
- 2000-09-13 Listed $142,965 ARMLS
Property tax history
+0.9%/yrLatest (2025): $1,868 · +1.0% YoY. Source: county tax records.
Cash-flow waterfall
monthlySold comps — $/sqft
last 12 mo · ≤1 miLoading sold comps…