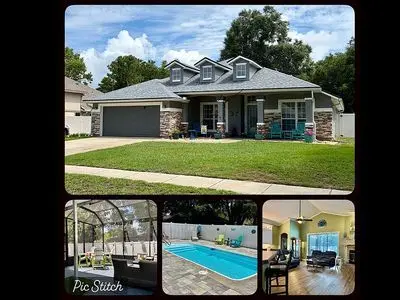
86299 Evergreen Pl · Yulee, FL
Flood risk 1/10 · Minimal
- FEMA flood zone
- X (unshaded)
- Chance of flooding over 30 yrs
- 0.0%
- Est. flood insurance / yr
- $507 – $1,088
Fire risk 6/10 · Moderate
- Est. fire insurance / yr
- $947 – $1,759
Heat risk 9/10 · Severe
- Hot days now (above 106°F)
- 7 days/yr
- Hot days in 30 yrs
- 21 days/yr
Wind risk 9/10 · Severe
- Chance of severe wind over 30 yrs
- 99.0%
Air-quality risk 5/10 · Moderate
- Unhealthy air days now
- 6 days/yr
- Unhealthy air days in 30 yrs
- 7 days/yr
Risk factors via First Street. Map © Google.
Why this score? — see what drove the D+ grade
The composite is a weighted blend of 9 inputs, each scored 0–100. Each bar is that input's sub-score; the figure is the points it added to the 100-point composite (weight × sub-score).
- ARV discount +15.0/15.0
- Appreciation +10.0/10.0
- Cash flow +6.2/30.0
- Schools +6.0/10.0
- Livability +3.3/5.0
- Rent growth +3.2/5.0
- Condition / age +2.5/5.0
- 1% rule +0.7/10.0
- DSCR +0.5/10.0
$475,000
🖨 Deal sheet 📄 Offer letter ✓ Due diligence
Listing remarks MLS
Welcome to this lovely 4/3 Hickory Village home built by Coppenbarger. The formal living and dining area leads into an oversized great room with a wood burning fireplace. Spacious kitchen has upgraded 42 inch Hickory cabinets and NEW stainless steel dishwasher, stove and microwave. NEW Mohawk flooring, SolidTech vinyl plank in the central living areas and carpet in bedrooms and formal living room. The private hallway leads to 2 bedrooms connected with a Jack & Jill bathroom. Separate 4th bedroom and bath would be perfect for teen or guest suite. Large screened in lanai with triple sliding glass doors opens to a paver patio and a private fenced in backyard. Loads of extras such as: Hardie Board Siding, freshly painted exterior, paver walkway & front porch, and wired for surround sound. Fantastic family home that won't last long! Close to schools and I-95.
Key facts
- Custom paver patio
- Inground pool
- Hickory cabinets
Tags
Neighborhood map
What this means for you Summary
Snapshot
- This is a 4-bed/3.0-bath single-family listed at $475k.
Deal economics
- At list price, monthly cash flow is $-872 ($-10k/yr) — negative.
- To cash-flow at today's rent, offer at most $321k (32.4% below list).
- To meet the 1% rule (rent ≥ 1% of price), the offer needs to be $269k (43.3% below list).
- Recommended offer: $269k (43.3% below list) — sets the bar for 1% rule.
- Cap rate 4.1% vs local median 3.4% in Yulee — meaningfully above typical; check what's discounted (condition, days-on-market, listing class) to confirm the premium yield is real.
Location & tenants
- Location reads 66/100 on livability (#605 in FL) — a middle-class / working-renter tenant base. Strengths: housing A+, cost of living A-, crime B+; Watch: amenities F, commute F, health & safety F.
- Nassau (town): math 74% / reading 65% proficiency, ranked #4 of 73 in FL (top 6%) — acceptable for families but not a draw, mixed tenant base, ~2y average lease.
- Market conditions: Rents rising (+2.9%/yr); 596 active listings in the ZIP; 5 comparable units currently listed for rent nearby; rentals at typical pace (median 24d on market — plan ~3-4 weeks tenant-placement turnaround); solid renter incomes; 953 units permitted in Nassau County in 2024 (24 in 5+ unit buildings).
- This rent runs 35% of the median local income ($93k/yr) — at the standard rent-burdened threshold; future hikes will face affordability resistance.
Forward outlook
- In year one you build about $51k of equity ($3k loan paydown + $48k appreciation (10.0% local appreciation)).
- Nassau County population projected at +17% by 2050 — long-run rental-demand tailwind backs the buy-and-hold thesis.
- By year 2, paydown + projected appreciation supports a ~$82k cash-out refi (75% LTV) — recoverable capital for the next deal without selling this one.
Negotiation context
- Only 4 days on market — expect competitive offers; lowballing is unlikely to land.
- 4 sale attempts since 18y ago with the ask held roughly flat each time — persistent listings suggest the price (not the market) is what's stuck; bring a comps-based counter.
- Current owner paid $266k; list at $475k implies a 79% gain — meaningful room to come down on a strong offer.
Risks & watch-outs
- Climate carrying-cost: severe wind risk, 99% chance of damaging wind over 30y; major wildfire risk; extreme-heat days projected 7→21/yr by 2055 (HVAC capex compounding) — expect insurance premiums to compound above CPI over the hold.
Questions for the listing agent
- What do current leases actually rent for vs. the listed asking? Can we see a recent rent roll and the last 12 months of T-12 income?
- Is there a deadline driving the sale (1031 exchange, divorce, estate, relocation)? That informs how much negotiation room exists.
- Schools are B-rated — typically a magnet for longer-tenancy family renters. What's the average tenant stay here, and is there a school-zone premium baked into asking?
- The area grade is low — what's the realistic commute time and amenity access for the typical tenant pool here? Any planned neighborhood developments (good or bad) we should know about?
- What's the average days-on-market for RENTAL listings here right now (not sales)? A rising rental-DOM trend means longer vacancies and softer asking-rent achievability than the comps imply.
- What's the recent tenant-quality profile in this submarket — average credit score on applications, eviction rate, late-payment / NSF rate, and stable-employment percentage? A property-management company in the area should have these aggregated.
- How much new for-sale + rental construction is in the pipeline within 1–3 miles? Heavy new supply typically softens prices + rents 12–24 months out; constrained supply supports both.
Investment metrics
- 1% rule
- 0.57% ✗
- Cap rate
- 4.09%
- Cash-on-cash
- -7.86%
- DSCR
- 0.65
- GRM
- 14.7
CMA / ARV
- ARV (on-the-fly)
- $575,508
- Comps found
- 12
Show comp detail 12 sales within ~0.75 mi
| Address | Dist | Beds/Ba | Sqft | Sold | Price | $/sf | Match |
|---|---|---|---|---|---|---|---|
| 86092 Knotted Oak Way | 0.13mi | 4/3.0 | 2,414 (+1%) | 2mo | $395,000 | $164 | 91 |
| 86173 Maple Leaf Pl | 0.15mi | 4/3.0 | 2,415 (+1%) | 1mo | $440,000 | $182 | 90 |
| 86007 Evergreen Pl | 0.22mi | 4/3.0 | 2,404 (+1%) | 3mo | $460,000 | $191 | 86 |
| 86178 Sand Hickory Trl | 0.26mi | 4/3.0 | 2,423 (+2%) | 2mo | $415,000 | $171 | 84 |
| 85342 Sandy Ridge Loop | 0.24mi | 4/3.0 | 2,123 (-11%) | 1mo | $530,000 | $250 | 69 |
| 85342 Sandy Ridge Loop #0038 | 0.24mi | 4/3.0 | 2,123 (-11%) | 1mo | $530,000 | $250 | 69 |
| 85949 Miner Pines Ct | 0.47mi | 4/3.0 | 2,531 (+6%) | 0mo | $755,000 | $298 | 68 |
| 85305 Sandy Ridge Loop #0076 | 0.18mi | 4/3.0 | 2,077 (-13%) | 4mo | $499,900 | $241 | 67 |
| 85305 Sandy Ridge Loop | 0.18mi | 4/3.0 | 2,077 (-13%) | 4mo | $499,900 | $241 | 67 |
| 85398 Sandy Ridge Loop #0044 | 0.29mi | 4/3.0 | 2,077 (-13%) | 1mo | $511,900 | $246 | 64 |
| 85398 Sandy Ridge Loop | 0.29mi | 4/3.0 | 2,077 (-13%) | 1mo | $511,900 | $246 | 64 |
| 86515 Rest Haven Ct | 0.73mi | 3/2.0 (-1) | 2,062 (-14%) | 1mo | $385,000 | $187 | 33 |
Match score weights: distance 35% · size 25% · config 20% · recency 20%. Top-matched comps best support the ARV.
Projected returns pro-forma
10.0% appreciation · 2.88% rent growth · sell at horizon
- IRR
- 18.7%
- Equity multiple
- 2.52×
- Total profit
- $202,721
- Equity at exit
- $427,918
- IRR
- 17.3%
- Equity multiple
- 5.81×
- Total profit
- $639,716
- Equity at exit
- $922,821
Cash invested: $133,000 (down + closing). Projections, not guarantees.
Landlord ↔ Tenant lean methodology
- Overall (STATE)
- 87 Strongly Landlord-Friendly
- State Florida
- 87 Strongly Landlord-Friendly · R+3
- County
- — inherits STATE
- City
- — inherits STATE
ZIP-level market 32097
- Home prices YoY
- 19.5%
- Rents YoY
- 2.9%
- Active inventory
- 596
- Price-to-rent
- 14.7×
Monthly cashflow live
- Estimated rent
- $2,691 medium interval (Pro) →
- Mortgage (P&I)
- −$2,491
- Tax from tax record
- −$309 /mo · $3,703/yr
- Insurance
- −$198
- HOA
- −$0
- Vacancy / Maint / Mgmt
- −$565
- Net cashflow
- $-872
Break-even live
UW: 25.0% down · 7.5% · 30yr · 1.5% tax · 5.0% vac · 8.0% maint · 8.0% mgmt
Financing live
Cash to close
- Down payment
- $118,750
- Closing costs
- $14,250
- Reserves months
- —
- Total cash needed
- —
Loan-product check · same deal, 3 products live
Conventional
25% down · 7.5% · 30yr
- Down + closing
- —
- Monthly P&I
- —
- Monthly cashflow
- —
- DSCR
- —
- Eligible?
- —
Personal DTI + credit; lowest rate.
DSCR
20% down · 8.5% · 30yr
- Down + closing
- —
- Monthly P&I
- —
- Monthly cashflow
- —
- DSCR
- —
- Eligible?
- —
No personal income docs; deal must DSCR.
Hard money
10% down · 12.0% · 12mo
- Down + closing
- —
- Monthly P&I
- —
- Monthly cashflow
- —
- DSCR
- —
- Eligible?
- —
Short-term bridge; refi at stabilization.
Rent comps 5 comps
| Address | Beds | Baths | Sqft | Rent | $/sqft | DOM | Units | Dist |
|---|---|---|---|---|---|---|---|---|
| 86092 Knotted Oak Way Unit Bedroom 1 Yulee, FL | 4.0 | 3.0 | 2414 | $825 | $0.34 | 17d | 1 | 0.09mi |
| 86467 Moonlit Walk Cir Yulee, FL | 4.0 | 3.0 | 2010 | $3,100 | $1.54 | 24d | 1 | 0.63mi |
| 86088 Meadowridge Ct Yulee, FL | 4.0 | 3.0 | 2175 | $2,600 | $1.20 | 24d | 1 | 0.92mi |
| 86040 Hopper Ln Yulee, FL | 3.0 | 2.0 | 1664 | $1,650 | $0.99 | 17d | 1 | 1.09mi |
| 86131 Hopper Ln Yulee, FL | 3.0 | 2.0 | 1664 | $1,650 | $0.99 | 24d | 1 | 1.10mi |
Listing history 5 events
-
2026-06-18days on market $475,000 Active 4 DOM
-
2026-06-17days on market $475,000 Active 3 DOM
-
2026-06-16days on market $475,000 Active 2 DOM
-
2026-06-15remarks 699-char remark
-
2026-06-15$475,000 Active 1 DOM
ⓘ Source: listings_history table (triggers on properties + properties_extension) + one-shot
backfill from property_details.listing_events for pre-trigger history.
Tax reassessment forecast FL · Resets to sale price
- Current annual tax
- $3,703 · $309/mo
- Projected year-2 tax
- $3,942 · $329/mo
- Expected delta
- +$239/yr (+$20/mo · 6.5%)
ⓘ Screening estimate from a state-policy table — verify with the county assessor before closing.
Climate risk First Street
- Flood 1/10 Low FEMA zone X (unshaded) · 0% chance over 30 yrs
- Wildfire 6/10 Major
- Heat 9/10 Extreme 7 d/yr ≥106°F today · 21 d/yr by 30 yrs out
- Wind 9/10 Extreme 99% chance of damaging wind over 30 yrs
- Air quality 5/10 Major 6 unhealthy d/yr today · 7 by 30 yrs out
Nearby sold comps map
Loading sold comps map…
Walkable amenities ~0.75 mi
Loading nearby amenities…
Taxation est. · year 1
- Rental income
- $32,291
- − Mortgage interest
- −$26,607
- − Property taxes
- −$3,703
- − Insurance
- −$2,375
- − Repairs & maintenance
- −$2,583
- − Management
- −$2,583
- − Depreciation
- −$13,818
- Taxable loss
- −$19,380
- Est. tax savings @ 24.0%
- +$4,651
- After-tax cash flow
- $-5,809/yr
For passive investors: Depreciation is non-cash, so a rental often shows a tax loss while cash-flowing — sheltering income. Rental losses are passive: they offset passive income freely, and up to $25,000/yr can offset ordinary (W-2) income if you actively participate and your MAGI is under $100k (phasing out to $0 by $150k); unused losses carry forward. On sale, claimed depreciation is recaptured at up to 25%, and gains may owe capital-gains tax (a 1031 exchange can defer both). Figures are a year-1 estimate at your 24.0% rate — not tax advice; consult a CPA.
Schools (NCES district)
- District
- Nassau
- NCES district ID
- 1201350
- Math proficiency
- 74% ▼ -2.00%
- Reading proficiency
- 65% ▼ -2.00%
- Median HH income
- $58,267
- Composite
- 59.79/100
- National rank
- #899
- State rank
- #4 of 73 in FL
Livability — Yulee
- Score
- 66/100
- State rank
- #605
- US rank
- #11615
Category grades
Schools grade is shown separately in the Schools card above.
Census & demographics
- Census place
- Yulee, FL
- County
- Nassau County · 67,729 people
- City population
- 26,700
- Metro
- Jacksonville, FL
- Population (ZIP)
- 26,700
- Household income
- $93,161
- Rent vs Own
- Severe rent burden
- 404.0
Population outlook (Nassau County) Hauer SSP2
- Today (2025)
- 88,419 people
- By 2030
- 92,679 · +4.8%
- By 2040
- 99,257 · +12.3%
- By 2050
- 103,378 · +16.9%
- By 2075
- 109,726 · +24.1%
- By 2100
- 107,006 · +21.0%
Race, ethnicity, and origin ACS 2023
- Neighborhood character
- Predominantly White (75%)
- Race & ethnicity
- White 75% Two or more races 9% Black 9% Hispanic / Latino 8% Asian 1% Native American 1%
- Hispanic origin (detail)
- Mexican 2% Puerto Rican 2%
- Common ancestry
- Lithuanian 4% Italian 3% Romanian 2%
- Foreign-born
- 4% · Canada, Vietnam
- Languages at home
- 93% English-only · Spanish 5% Vietnamese 1%
Political lean MEDSL · Nassau
- 2024 margin
- Solid R (+46.9) · D 26.1% · R 73.1%
- 2008→2024 swing
- -3.1pp toward R · 2008: -43.8pp · 2024: -46.9pp
- All cycles
- 2024: R+46.9 2020: R+45.9 2016: R+50.2 2012: R+48.6 2008: R+43.8
Not yet ingested
- Civics
- —
Market trends
- HPI YoY
- ▲ 49.35%
- Current HPI
- 301.9299
- Rent YoY
- ▲ 2.88%
- Metro
- Jacksonville, FL
- State GDP YoY
- ▲ 3.28%
- F500 in state
- 36
Industry mix (Fortune 500 HQ in FL)
| Industry | F500 HQs | Revenue |
|---|---|---|
| Industrial Technology | 2 | $29B |
|
||
| Insurance | 2 | $17B |
|
||
| Retail | 1 | $60B |
|
||
| Technology Distribution | 1 | $58B |
|
||
| Homebuilding | 1 | $35B |
|
||
| Technology Manufacturing | 1 | $35B |
|
||
Price history
+64.1% since first listed8 events — show timeline
- 2026-06-15 Listed $475,000 FSBO.com
- 2018-04-24 Sold (Public Records) $266,000 Public Records
- 2018-04-20 Sold (MLS) $266,000 AINCAR
- 2018-03-17 Listed $276,000 AINCAR
- 2009-11-28 Listing Removed — realMLS
- 2009-08-28 Listed $279,500 realMLS
- 2009-06-27 Listing Removed — realMLS
- 2008-09-29 Listed $289,500 realMLS
Property tax history
+5.9%/yrLatest (2025): $3,703 · +1.4% YoY. Source: county tax records.
Cash-flow waterfall
monthlySold comps — $/sqft
last 12 mo · ≤1 miLoading sold comps…