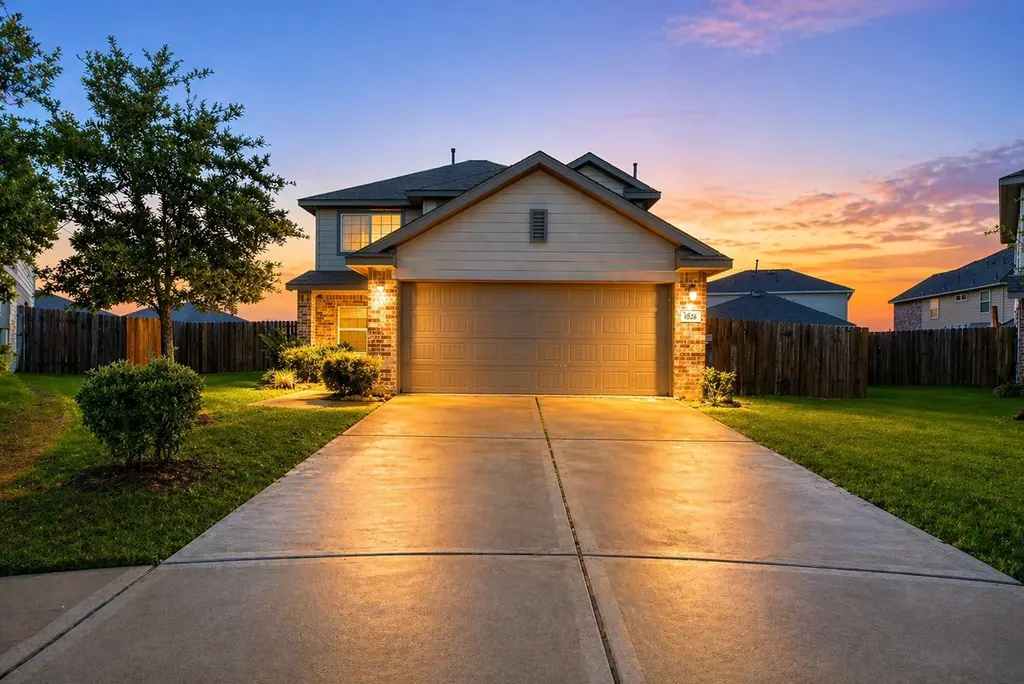
184 Kelly St · Angleton, TX
Flood risk 1/10 · Minimal
- FEMA flood zone
- X (unshaded)
- Chance of flooding over 30 yrs
- 0.0%
- Est. flood insurance / yr
- $507 – $1,088
Fire risk 5/10 · Moderate
- Est. fire insurance / yr
- $1,222 – $2,270
Heat risk 10/10 · Severe
- Hot days now (above 111°F)
- 7 days/yr
- Hot days in 30 yrs
- 25 days/yr
Wind risk 9/10 · Severe
- Chance of severe wind over 30 yrs
- 99.0%
Air-quality risk 2/10 · Minimal
- Unhealthy air days now
- 1 days/yr
- Unhealthy air days in 30 yrs
- 1 days/yr
Risk factors via First Street. Map © Google.
Why this score? — see what drove the C grade
The composite is a weighted blend of 9 inputs, each scored 0–100. Each bar is that input's sub-score; the figure is the points it added to the 100-point composite (weight × sub-score).
- Cash flow +17.1/30.0
- ARV discount +15.0/15.0
- 1% rule +6.0/10.0
- DSCR +5.3/10.0
- Condition / age +3.8/5.0
- Livability +3.7/5.0
- Schools +3.5/10.0
- Rent growth +2.5/5.0
- Appreciation +0.0/10.0
$199,900
🖨 Deal sheet 📄 Offer letter ✓ Due diligence
Listing remarks MLS
Welcome to Riverwood Ranch in Angleton, where modern comfort meets thoughtful design in this beautifully maintained 2021-built home. Offering 4 bedrooms and 2.5 bathrooms across 1,813 square feet, this residence features a desirable downstairs primary suite, providing privacy and convenience. The open-concept layout creates a natural flow between the living, dining, and kitchen areas, making it ideal for both everyday living and entertaining. The home sits on a 6,878 sq ft lot with a functional backyard space ready for personalization. This property presents a unique chance for buyers seeking value in a newer construction home within a growing community. Conveniently located near local schools, shopping, and commuter routes, this home combines location, layout, and potential. Don’t miss the opportunity to secure a like-new home in Riverwood Ranch.
Key facts
- Conveniently located
- Open-concept layout
- 6,878 sq ft lot
Tags
Neighborhood map
What this means for you Summary
Snapshot
- This is a 4-bed/2.5-bath single-family listed at $200k. Condition is rated good.
Deal economics
- At list price, monthly cash flow is $138 ($2k/yr) — positive.
- The deal already cash-flows at list — no discount required.
- Meets the 1% rule at list price ($2k rent vs $200k).
- Recommended offer: $194k (3.0% below list) — sets the bar for market timing.
- Cap rate 7.1% vs local median 4.0% in Angleton — top-decile yield for the area; either an underpriced asset or a hidden risk that comps aren't pricing in. Stress-test before assuming the spread holds.
Location & tenants
- Location reads 74/100 on livability (#171 in TX, #4,520 nationally) — a middle-class / working-renter tenant base. Strengths: cost of living A+, housing A+, employment A-; Watch: schools D, amenities F, commute F.
- Angleton ISD (suburban): math 36% / reading 44% proficiency, ranked #375 of 826 in TX (top 45%) — families likely to look elsewhere, expect single-tenant / working-renter base with shorter leases.
- Market conditions: 921 active listings in the ZIP; 5 comparable units currently listed for rent nearby; rentals lingering (median 44d on market — plan ~5-8 weeks vacancy on turnover, expect pricing pressure); 60% of comp listings sitting > 30 days — soft ceiling on asking rent; solid renter incomes; 3,960 units permitted in Brazoria County in 2024 (593 in 5+ unit buildings).
Forward outlook
- Local home prices are declining (-3.0%/yr); year-one equity from $1k of loan paydown is wiped out by about $6k of value loss. Plan a longer hold.
- Brazoria County population projected at +44% by 2050 — long-run rental-demand tailwind backs the buy-and-hold thesis.
Negotiation context
- It's been on market 53 days — a 3% lower offer ($194k) is reasonable based on typical stale-listing flexibility.
- 6 sale attempts since 5y ago; this cycle's ask has dropped $14k (7%) from the opening price — seller is motivated, your offer sets the floor, not the list.
Risks & watch-outs
- Watch-outs: property tax is 2.5% of price.
- Climate carrying-cost: severe wind risk, 99% chance of damaging wind over 30y; moderate wildfire risk; extreme-heat days projected 7→25/yr by 2055 (HVAC capex compounding) — expect insurance premiums to compound above CPI over the hold.
Questions for the listing agent
- It's been on market 53 days. Have you received any prior offers? Is the seller open to a 3% concession, seller financing, or rate buy-down credit?
- Property tax is high relative to price — has the assessment been appealed recently, and will the sale trigger a re-assessment?
- What does the HOA fee cover, when was the last increase, and are there any pending special assessments or reserve-fund shortfalls?
- Is there a deadline driving the sale (1031 exchange, divorce, estate, relocation)? That informs how much negotiation room exists.
- Schools are D-rated, which usually means shorter tenancies and higher turnover. Who's the typical renter profile here, and what's been the actual vacancy rate?
- What's the average days-on-market for RENTAL listings here right now (not sales)? A rising rental-DOM trend means longer vacancies and softer asking-rent achievability than the comps imply.
- What's the recent tenant-quality profile in this submarket — average credit score on applications, eviction rate, late-payment / NSF rate, and stable-employment percentage? A property-management company in the area should have these aggregated.
- How much new for-sale + rental construction is in the pipeline within 1–3 miles? Heavy new supply typically softens prices + rents 12–24 months out; constrained supply supports both.
Investment metrics
- 1% rule
- 1.10% ✓
- Cap rate
- 7.12%
- Cash-on-cash
- 2.96%
- DSCR
- 1.13
- GRM
- 7.6
CMA / ARV
- ARV (median comp)
- $257,673
- List price
- $199,900
- Delta
- -22.42%
- Verdict
- UNDERPRICED
- Comps
- 20 within 1.0 mi
Show comp detail 12 sales within ~0.75 mi
| Address | Dist | Beds/Ba | Sqft | Sold | Price | $/sf | Match |
|---|---|---|---|---|---|---|---|
| 423 Robin St | 0.28mi | 4/2.0 | 1,900 (+5%) | 2mo | $311,990 | $164 | 76 |
| 513 Robin St | 0.28mi | 4/2.0 | 1,900 (+5%) | 2mo | $309,990 | $163 | 75 |
| 729 Newman St | 0.61mi | 3/2.0 (-1) | 1,840 (+2%) | 1mo | $269,000 | $146 | 61 |
| 2837 Rimfire Dr | 0.67mi | 4/2.0 | 1,868 (+3%) | 1mo | $239,900 | $128 | 61 |
| 425 Robin St | 0.29mi | 4/2.0 | 2,060 (+14%) | 2mo | $332,990 | $162 | 60 |
| 1506 Gentle Wind Ct | 0.70mi | 4/2.0 | 1,670 (-8%) | 1mo | $275,990 | $165 | 52 |
| 1105 Isabella Blvd | 0.69mi | 3/2.0 (-1) | 1,704 (-6%) | 0mo | $263,900 | $155 | 51 |
| 2935 Summer Breeze Way | 0.70mi | 4/2.0 | 1,670 (-8%) | 2mo | $275,990 | $165 | 51 |
| 37 N Erik Dr | 0.42mi | 3/2.0 (-1) | 2,050 (+13%) | 1mo | $324,900 | $158 | 50 |
| 808 Manor Dr | 0.57mi | 3/2.0 (-1) | 1,603 (-12%) | 1mo | $249,500 | $156 | 46 |
| 2931 Summer Breeze Way | 0.69mi | 4/2.5 | 2,066 (+14%) | 2mo | $292,990 | $142 | 43 |
| 2943 Summer Breeze Way | 0.71mi | 4/2.5 | 2,066 (+14%) | 2mo | $292,990 | $142 | 42 |
Match score weights: distance 35% · size 25% · config 20% · recency 20%. Top-matched comps best support the ARV.
Projected returns pro-forma
-3.0% appreciation · 3.0% rent growth · sell at horizon
- IRR
- -11.5%
- Equity multiple
- 0.58×
- Total profit
- $-23,430
- Equity at exit
- $29,806
- IRR
- -2.2%
- Equity multiple
- 0.85×
- Total profit
- $-8,395
- Equity at exit
- $17,284
Cash invested: $55,972 (down + closing). Projections, not guarantees.
Landlord ↔ Tenant lean methodology
- Overall (STATE)
- 87 Strongly Landlord-Friendly
- State Texas
- 87 Strongly Landlord-Friendly · R+5
- County
- — inherits STATE
- City
- — inherits STATE
ZIP-level market 77515
- Home prices YoY
- -5.1%
- Active inventory
- 921
- Price-to-rent
- 7.6×
Monthly cashflow live
- Estimated rent
- $2,201 high interval (Pro) →
- Mortgage (P&I)
- −$1,048
- Tax from tax record
- −$419 /mo · $5,029/yr
- Insurance
- −$83
- HOA
- −$50
- Vacancy / Maint / Mgmt
- −$462
- Net cashflow
- $138
Break-even live
UW: 25.0% down · 7.5% · 30yr · 1.5% tax · 5.0% vac · 8.0% maint · 8.0% mgmt
Financing live
Cash to close
- Down payment
- $49,975
- Closing costs
- $5,997
- Reserves months
- —
- Total cash needed
- —
Loan-product check · same deal, 3 products live
Conventional
25% down · 7.5% · 30yr
- Down + closing
- —
- Monthly P&I
- —
- Monthly cashflow
- —
- DSCR
- —
- Eligible?
- —
Personal DTI + credit; lowest rate.
DSCR
20% down · 8.5% · 30yr
- Down + closing
- —
- Monthly P&I
- —
- Monthly cashflow
- —
- DSCR
- —
- Eligible?
- —
No personal income docs; deal must DSCR.
Hard money
10% down · 12.0% · 12mo
- Down + closing
- —
- Monthly P&I
- —
- Monthly cashflow
- —
- DSCR
- —
- Eligible?
- —
Short-term bridge; refi at stabilization.
Rent comps 5 comps
| Address | Beds | Baths | Sqft | Rent | $/sqft | DOM | Units | Dist |
|---|---|---|---|---|---|---|---|---|
| 513 Robin St Angleton, TX | 4.0 | 2.0 | 1900 | $2,495 | $1.31 | 21d | 1 | 0.30mi |
| 128 Dallas St Angleton, TX | 3.0 | 2.0 | 1390 | $1,900 | $1.37 | 43d | 1 | 0.62mi |
| 3 Dallas Ct #1 Angleton, TX | 3.0 | 3.0 | 1550 | $1,450 | $0.94 | 43d | 1 | 0.68mi |
| 152 Bastrop St Angleton, TX | 3.0 | 2.0 | 1639 | $1,745 | $1.06 | 43d | 1 | 0.77mi |
| 3606 Atlas Point Ln Angleton, TX | 3.0 | 2.0 | 1876 | $2,250 | $1.20 | 1d | 1 | 1.49mi |
HOA detail
- Monthly dues
- $50 · $600/yr
Listing history 40 events
-
2026-06-08statusdays on market $199,900 Pending 53 DOM
-
2026-06-07days on market $199,900 Active Under Contract 52 DOM
-
2026-06-04days on market $199,900 Active Under Contract 49 DOM
-
2026-06-03days on market $199,900 Active Under Contract 48 DOM
-
2026-06-02days on market $199,900 Active Under Contract 47 DOM
-
2026-06-01days on market $199,900 Active Under Contract 46 DOM
-
2026-05-31days on market $199,900 Active Under Contract 45 DOM
-
2026-05-12historical Active Under Contract 874-char remark
Show marketing remark (874 chars)
Welcome to Riverwood Ranch in Angleton, where modern comfort meets thoughtful design in this beautifully maintained 2021-built home. Offering 4 bedrooms and 2.5 bathrooms across 1,813 square feet, this residence features a desirable downstairs primary suite, providing privacy and convenience. The open-concept layout creates a natural flow between the living, dining, and kitchen areas, making it ideal for both everyday living and entertaining. The home sits on a 6,878 sq ft lot with a functional backyard space ready for personalization. This property presents a unique chance for buyers seeking value in a newer construction home within a growing community. Conveniently located near local schools, shopping, and commuter routes, this home combines location, layout, and potential. Don’t miss the opportunity to secure a like-new home in Riverwood Ranch.
-
2026-05-03price $199,900 874-char remark
Show marketing remark (874 chars)
Welcome to Riverwood Ranch in Angleton, where modern comfort meets thoughtful design in this beautifully maintained 2021-built home. Offering 4 bedrooms and 2.5 bathrooms across 1,813 square feet, this residence features a desirable downstairs primary suite, providing privacy and convenience. The open-concept layout creates a natural flow between the living, dining, and kitchen areas, making it ideal for both everyday living and entertaining. The home sits on a 6,878 sq ft lot with a functional backyard space ready for personalization. This property presents a unique chance for buyers seeking value in a newer construction home within a growing community. Conveniently located near local schools, shopping, and commuter routes, this home combines location, layout, and potential. Don’t miss the opportunity to secure a like-new home in Riverwood Ranch.
-
2026-04-16$214,000 Active 874-char remark
Show marketing remark (874 chars)
Welcome to Riverwood Ranch in Angleton, where modern comfort meets thoughtful design in this beautifully maintained 2021-built home. Offering 4 bedrooms and 2.5 bathrooms across 1,813 square feet, this residence features a desirable downstairs primary suite, providing privacy and convenience. The open-concept layout creates a natural flow between the living, dining, and kitchen areas, making it ideal for both everyday living and entertaining. The home sits on a 6,878 sq ft lot with a functional backyard space ready for personalization. This property presents a unique chance for buyers seeking value in a newer construction home within a growing community. Conveniently located near local schools, shopping, and commuter routes, this home combines location, layout, and potential. Don’t miss the opportunity to secure a like-new home in Riverwood Ranch.
-
2026-04-10historical
-
2026-01-08$279,900 Active
-
2024-07-25soldstatus
-
2024-07-19soldstatus Sold
-
2024-06-16status Pending
-
2024-06-08status Option Pending
-
2024-05-29price $260,000
-
2024-04-25price $270,000
-
2024-03-29$275,000 Active
-
2024-03-25historical $275,000
-
2023-05-31historical
-
2023-05-31historical
-
2023-04-26$270,000 Active
-
2023-04-26historical
-
2022-04-25soldstatus Sold
-
2022-03-28status Pending
-
2022-03-25price $269,000
-
2022-03-15price $267,000
-
2022-03-08price $265,000
-
2022-03-01price $262,000
-
2022-02-25price $261,000
-
2022-02-24price $260,990
-
2022-02-14price $269,990
-
2022-02-09price $268,990
-
2022-02-09status Active
-
2022-01-27status Pending
-
2022-01-24price $250,000
-
2022-01-21price $251,000
-
2022-01-14price $250,000
-
2021-12-10$266,990 Active
ⓘ Source: listings_history table (triggers on properties + properties_extension) + one-shot
backfill from property_details.listing_events for pre-trigger history.
Tax reassessment forecast TX · Resets to sale price
- Current annual tax
- $5,029 · $419/mo
- Projected year-2 tax
- $5,029 · $419/mo
- Expected delta
- $0/yr ($0/mo · 0.0%)
ⓘ Screening estimate from a state-policy table — verify with the county assessor before closing.
Climate risk First Street
- Flood 1/10 Low FEMA zone X (unshaded) · 0% chance over 30 yrs
- Wildfire 5/10 Major
- Heat 10/10 Extreme 7 d/yr ≥111°F today · 25 d/yr by 30 yrs out
- Wind 9/10 Extreme 99% chance of damaging wind over 30 yrs
- Air quality 2/10 Low 1 unhealthy d/yr today · 1 by 30 yrs out
Nearby sold comps map
Loading sold comps map…
Walkable amenities ~0.75 mi
Loading nearby amenities…
Taxation est. · year 1
- Rental income
- $26,411
- − Mortgage interest
- −$11,198
- − Property taxes
- −$5,029
- − Insurance
- −$1,000
- − Repairs & maintenance
- −$2,113
- − Management
- −$2,113
- − HOA
- −$600
- − Depreciation
- −$5,815
- Taxable loss
- −$1,456
- Est. tax savings @ 24.0%
- +$349
- After-tax cash flow
- $2,006/yr
For passive investors: Depreciation is non-cash, so a rental often shows a tax loss while cash-flowing — sheltering income. Rental losses are passive: they offset passive income freely, and up to $25,000/yr can offset ordinary (W-2) income if you actively participate and your MAGI is under $100k (phasing out to $0 by $150k); unused losses carry forward. On sale, claimed depreciation is recaptured at up to 25%, and gains may owe capital-gains tax (a 1031 exchange can defer both). Figures are a year-1 estimate at your 24.0% rate — not tax advice; consult a CPA.
Condition & rehab AI · 2 photos
This 2021-built home in Riverwood Ranch, Angleton, TX, is in good condition with a well-maintained exterior and interior. It offers a good investment opportunity with potential for minor updates to enhance its curb appeal and value.
Value-add opportunities
- Both Painting the exterior — Fresh paint can enhance curb appeal and property value.
- Both Landscaping improvements — Enhanced landscaping can improve curb appeal and attract more potential buyers/tenants.
- Both Interior touch-ups — Fresh paint and minor touch-ups can make the interior look more inviting and modern.
Renovation cost estimate screening
Value-add ROI direction
- Both Painting the exterior — Fresh paint can enhance curb appeal and property value. ↑
- Both Landscaping improvements — Enhanced landscaping can improve curb appeal and attract more potential buyers/tenants. ↑
- Both Interior touch-ups — Fresh paint and minor touch-ups can make the interior look more inviting and modern. ↑
ⓘ Cost ranges are severity-bucket heuristics (US national rule-of-thumb). Get contractor quotes + a written scope before underwriting a rehab budget.
Schools (NCES district)
- District
- Angleton ISD
- NCES district ID
- 4808310
- Math proficiency
- 36% ▼ -8.00%
- Reading proficiency
- 44% ▲ 1.00%
- Median HH income
- $55,670
- Composite
- 35.01/100
- National rank
- #5046
- State rank
- #375 of 826 in TX
Livability — Angleton
- Score
- 74/100
- State rank
- #171
- US rank
- #4520
Category grades
Schools grade is shown separately in the Schools card above.
Census & demographics
- Census place
- Angleton, TX
- County
- Brazoria County · 374,982 people
- City population
- 34,088
- Metro
- Houston-The Woodlands-Sugar Land, TX
- Population (ZIP)
- 34,088
- Household income
- $88,787
- Rent vs Own
- Severe rent burden
- 785.0
Population outlook (Brazoria County) Hauer SSP2
- Today (2025)
- 420,414 people
- By 2030
- 457,585 · +8.8%
- By 2040
- 532,232 · +26.6%
- By 2050
- 605,399 · +44.0%
- By 2075
- 779,358 · +85.4%
- By 2100
- 883,759 · +110.2%
Race, ethnicity, and origin ACS 2023
- Neighborhood character
- Diverse neighborhood (Simpson 0.58)
- Race & ethnicity
- White 55% Hispanic / Latino 33% Two or more races 18% Black 8% Asian 2%
- Hispanic origin (detail)
- Mexican 28%
- Common ancestry
- Lithuanian 3% Romanian 2% Slovak 1%
- Foreign-born
- 8% · Canada, Vietnam
- Languages at home
- 78% English-only · Spanish 20% Other Asian/Pacific 1%
Political lean MEDSL · Brazoria
- 2024 margin
- R (+19.7) · D 39.5% · R 59.2% · Other 1.3%
- 2008→2024 swing
- +9.9pp toward D · 2008: -29.6pp · 2024: -19.7pp
- All cycles
- 2024: R+19.7 2020: R+18.2 2016: R+24.6 2012: R+34.2 2008: R+29.6
Not yet ingested
- Civics
- —
Market trends
- HPI YoY
- ▼ -15.59%
- Current HPI
- 288.7286
- Rent YoY
- —
- Metro
- Houston-The Woodlands-Sugar Land, TX
- State GDP YoY
- ▲ 3.95%
- F500 in state
- 110
Industry mix (Fortune 500 HQ in TX)
| Industry | F500 HQs | Revenue |
|---|---|---|
| Energy | 16 | $1,198B |
|
||
| Technology | 5 | $198B |
|
||
| Engineering / Construction | 4 | $72B |
|
||
| Energy Services | 3 | $60B |
|
||
| Utilities | 3 | $41B |
|
||
| Healthcare | 2 | $330B |
|
||
Price history
-25.1% since first listed33 events — show timeline
- 2026-05-12 Contingent — HARMLS
- 2026-05-03 Price Changed $199,900 HARMLS
- 2026-04-16 Listed $214,000 HARMLS
- 2026-04-10 Listing Removed — HARMLS
- 2026-01-08 Listed $279,900 HARMLS
- 2024-07-25 Sold (Public Records) — Public Records
- 2024-07-19 Sold (MLS) — HARMLS
- 2024-06-16 Pending — HARMLS
- 2024-06-08 Pending — HARMLS
- 2024-05-29 Price Changed $260,000 HARMLS
- 2024-04-25 Price Changed $270,000 HARMLS
- 2024-03-29 Listed $275,000 HARMLS
- 2024-03-25 Coming Soon $275,000 HARMLS
- 2023-05-31 Rental Removed — HARMLS
- 2023-05-31 Listing Removed — HARMLS
- 2023-04-26 Listed $270,000 HARMLS
- 2023-04-26 Coming Soon — HARMLS
- 2022-04-25 Sold (MLS) — HARMLS
- 2022-03-28 Pending — HARMLS
- 2022-03-25 Price Changed $269,000 HARMLS
- 2022-03-15 Price Changed $267,000 HARMLS
- 2022-03-08 Price Changed $265,000 HARMLS
- 2022-03-01 Price Changed $262,000 HARMLS
- 2022-02-25 Price Changed $261,000 HARMLS
- 2022-02-24 Price Changed $260,990 HARMLS
- 2022-02-14 Price Changed $269,990 HARMLS
- 2022-02-09 Price Changed $268,990 HARMLS
- 2022-02-09 Relisted — HARMLS
- 2022-01-27 Pending — HARMLS
- 2022-01-24 Price Changed $250,000 HARMLS
- 2022-01-21 Price Changed $251,000 HARMLS
- 2022-01-14 Price Changed $250,000 HARMLS
- 2021-12-10 Listed $266,990 HARMLS
Property tax history
+7.3%/yrLatest (2025): $5,029 · +0.5% YoY. Source: county tax records.
Cash-flow waterfall
monthlySold comps — $/sqft
last 12 mo · ≤1 miLoading sold comps…