635 SW 20th St · Boynton Beach, FL
Flood risk 5/10 · Moderate
- FEMA flood zone
- X (unshaded)
- Chance of flooding over 30 yrs
- 0.65%
- Est. flood insurance / yr
- $507 – $1,088
Fire risk 1/10 · Minimal
- Est. fire insurance / yr
- $947 – $1,759
Heat risk 9/10 · Severe
- Hot days now (above 105°F)
- 6 days/yr
- Hot days in 30 yrs
- 22 days/yr
Wind risk 10/10 · Severe
- Chance of severe wind over 30 yrs
- 99.0%
Air-quality risk 2/10 · Minimal
- Unhealthy air days now
- 1 days/yr
- Unhealthy air days in 30 yrs
- 2 days/yr
Risk factors via First Street. Map © Google.
Why this score? — see what drove the B- grade
The composite is a weighted blend of 9 inputs, each scored 0–100. Each bar is that input's sub-score; the figure is the points it added to the 100-point composite (weight × sub-score).
- Cash flow +30.0/30.0
- DSCR +10.0/10.0
- 1% rule +8.9/10.0
- ARV discount +7.5/15.0
- Schools +4.3/10.0
- Livability +3.6/5.0
- Condition / age +2.8/5.0
- Rent growth +2.7/5.0
- Appreciation +0.0/10.0
$160,000
🖨 Deal sheet (PDF) 📄 Offer letter ✓ Due diligence
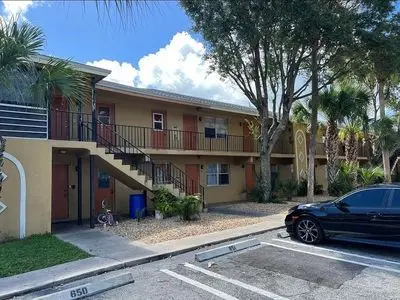
Listing remarks
Sell by owner. Please do not contact me unless you are a buyer (or have a buyer). Very nice 2bd 1 bath apartment with a new roof. Located near downtown Delray. Walking distance from many stores and right next to the bus station. Somewhat remodeled on the inside. Currently occupied by a long term tenant. AC is 5 years old.
Key facts
- Next to bus station
- Walking distance
- Ac is 5 years old
Tags
Neighborhood map
What this means for you Summary
Snapshot
- This is a 2-bed/1.0-bath other listed at $160k. Condition is rated average.
Deal economics
- At list price, monthly cash flow is $652 ($8k/yr) — positive.
- The deal already cash-flows at list — no discount required.
- Meets the 1% rule at list price ($2k rent vs $160k).
- Recommended offer: $158k (1.5% below list) — sets the bar for market timing.
- Cap rate 11.2% vs local median 4.3% in Boynton Beach — top-decile yield for the area; either an underpriced asset or a hidden risk that comps aren't pricing in. Stress-test before assuming the spread holds.
Location & tenants
- Location reads 72/100 on livability (#351 in FL) — a middle-class / working-renter tenant base. Strengths: housing A+, health & safety B+, cost of living B; Watch: amenities D+, crime D-, commute F.
- Palm Beach (suburban): math 46% / reading 53% proficiency, ranked #34 of 73 in FL (top 47%) — families likely to look elsewhere, expect single-tenant / working-renter base with shorter leases.
- Zoned schools: Galaxy Elementary School (math 36% / reading 39%, grade F, #1,596 of 2,144 statewide, top 75%, 617 students, 87% FRL); Congress Community Middle School (math 21% / reading 28%, grade F, #522 of 571 statewide, top 93%, 988 students, 72% FRL); Boynton Beach Community High (math 13% / reading 25%, grade F, #565 of 667 statewide, top 85%, 1,547 students, 65% FRL) — zoned schools average 75% FRL vs 52% district-wide (23 pts higher); higher-poverty schools than district average — tighter screening recommended.
- Zoned-school proficiency averages 27% at this address vs 50% district-wide (-22 pts) — the specific schools serving this property underperform the Palm Beach average; the district grade overstates school quality for this exact location.
- Market conditions: Rents flat; 232 active listings in the ZIP; 40 comparable units currently listed for rent nearby; rentals at typical pace (median 15d on market — plan ~3-4 weeks tenant-placement turnaround); 3,974 units permitted in Palm Beach County in 2024 (1,012 in 5+ unit buildings).
- This rent runs 36% of the median local income ($74k/yr) — at the standard rent-burdened threshold; future hikes will face affordability resistance.
Forward outlook
- Local home prices are declining (-3.0%/yr); year-one equity from $1k of loan paydown is wiped out by about $5k of value loss. Plan a longer hold.
- Palm Beach County population projected at +30% by 2050 — long-run rental-demand tailwind backs the buy-and-hold thesis.
- At projected returns (-3.0% appreciation + 0.9% rent growth), your $45k cash investment doubles in ~9 years — after that, you're playing with house money.
Negotiation context
- It's been on market 26 days — a 2% lower offer ($158k) is reasonable based on typical stale-listing flexibility.
Risks & watch-outs
- Climate carrying-cost: moderate flood risk; severe wind risk, 99% chance of damaging wind over 30y; extreme-heat days projected 6→22/yr by 2055 (HVAC capex compounding) — expect insurance premiums to compound above CPI over the hold.
Questions for the listing agent
- Is there a deadline driving the sale (1031 exchange, divorce, estate, relocation)? That informs how much negotiation room exists.
- Crime grade is D in this area — have there been break-ins, vandalism, or insurance claims at this property in the last 3 years? What carrier currently insures it and at what premium?
- What's the average days-on-market for RENTAL listings here right now (not sales)? A rising rental-DOM trend means longer vacancies and softer asking-rent achievability than the comps imply.
- What's the recent tenant-quality profile in this submarket — average credit score on applications, eviction rate, late-payment / NSF rate, and stable-employment percentage? A property-management company in the area should have these aggregated.
- How much new for-sale + rental construction is in the pipeline within 1–3 miles? Heavy new supply typically softens prices + rents 12–24 months out; constrained supply supports both.
Investment metrics
- 1% rule
- 1.39% ✓
- Cap rate
- 11.18%
- Cash-on-cash
- 17.46%
- DSCR
- 1.78
- GRM
- 6.0
CMA / ARV
No comps found within radius.
Projected returns pro-forma
-3.0% appreciation · 0.93% rent growth · sell at horizon
- IRR
- 6.5%
- Equity multiple
- 1.25×
- Total profit
- $11,079
- Equity at exit
- $23,857
- IRR
- 13.9%
- Equity multiple
- 2.01×
- Total profit
- $45,365
- Equity at exit
- $13,834
Cash invested: $44,800 (down + closing). Projections, not guarantees.
Landlord ↔ Tenant lean methodology
- Overall (STATE)
- 87 Strongly Landlord-Friendly
- State Florida
- 87 Strongly Landlord-Friendly · R+3
- County
- — inherits STATE
- City
- — inherits STATE
ZIP-level market 33426
- Rents YoY
- 0.9%
- Active inventory
- 232
- Price-to-rent
- 6.0×
Monthly cashflow live
- Estimated rent
- $2,225 high interval (Pro) →
- Mortgage (P&I)
- −$839
- Tax est. 1.5%
- −$200 /mo · $2,400/yr
- Insurance
- −$67
- HOA
- −$0
- Vacancy / Maint / Mgmt
- −$467
- Net cashflow
- $652
Break-even live
Sensitivity live
| Price | -10% $762 | -5% $707 | +0% $652 | +5% $596 | +10% $541 |
|---|---|---|---|---|---|
| Rent | -10% $476 | -5% $564 | +0% $652 | +5% $740 | +10% $828 |
| Rate | -1.0pp $732 | -0.5pp $692 | base $652 | +0.5pp $610 | +1.0pp $568 |
UW: 25.0% down · 7.5% · 30yr · 1.5% tax · 5.0% vac · 8.0% maint · 8.0% mgmt
Financing live
Cash to close
- Down payment
- $40,000
- Closing costs
- $4,800
- Reserves months
- —
- Total cash needed
- —
Loan-product check · same deal, 3 products live
Conventional
25% down · 7.5% · 30yr
- Down + closing
- —
- Monthly P&I
- —
- Monthly cashflow
- —
- DSCR
- —
- Eligible?
- —
Personal DTI + credit; lowest rate.
DSCR
20% down · 8.5% · 30yr
- Down + closing
- —
- Monthly P&I
- —
- Monthly cashflow
- —
- DSCR
- —
- Eligible?
- —
No personal income docs; deal must DSCR.
Hard money
10% down · 12.0% · 12mo
- Down + closing
- —
- Monthly P&I
- —
- Monthly cashflow
- —
- DSCR
- —
- Eligible?
- —
Short-term bridge; refi at stabilization.
Rent comps 40 comps
| Address | Beds | Baths | Sqft | Rent | $/sqft | DOM | Units | Dist |
|---|---|---|---|---|---|---|---|---|
| 123 SW 13th St Boynton Beach, FL | 2.0 | 1.0 | 1044 | $2,275 | $2.18 | 26d | 1 | 0.24mi |
| 1009 SW 3rd Way Boynton Beach, FL | 2.0 | 1.0 | 1050 | $2,200 | $2.10 | 7d | 1 | 0.32mi |
| 108 SW 9th St Boynton Beach, FL | 2.0 | 1.5 | 1080 | $2,900 | $2.69 | 26d | 1 | 0.42mi |
| 1561 Stonehaven Dr Boynton Beach, FL | 1.0–2.0 | 1.0–2.0 | 975 | $2,084 | $2.14 | 5d | 4 | 0.43mi |
| 2141 W Woolbright Rd Unit L106 Boynton Beach, FL | 2.0 | 2.0 | 1000 | $1,900 | $1.90 | 15d | 1 | 0.43mi |
| 2001 W Woolbright Rd Unit F204 Boynton Beach, FL | 2.0 | 2.0 | 986 | $1,975 | $2.00 | 26d | 1 | 0.45mi |
| 1575 SW 8th St Boynton Beach, FL | 1.0–3.0 | 1.0–2.0 | 1104 | $2,288 | $2.07 | 0d | 23 | 0.46mi |
| 806 Ocean Dr Boynton Beach, FL | 2.0 | 1.0 | 1012 | $2,100 | $2.08 | 26d | 1 | 0.49mi |
| 100 Newlake Dr Boynton Beach, FL | 1.0–3.0 | 1.0–2.0 | 1261 | $2,514 | $1.99 | 0d | 22 | 0.58mi |
| 815 W Boynton Beach Blvd Boynton Beach, FL | 2.0 | 2.0 | 885 | $2,250 | $2.54 | 4d | 4 | 0.60mi |
| 815 Boynton Beach Blvd Unit 2-106 Boynton Beach, FL | 2.0 | 2.0 | 887 | $1,800 | $2.03 | 9d | 1 | 0.60mi |
| 815 Boynton Beach Blvd Unit 12-106 Boynton Beach, FL | 2.0 | 2.0 | 887 | $2,500 | $2.82 | 5d | 1 | 0.62mi |
| 815 Boynton Beach Blvd Unit 10-203 Boynton Beach, FL | 2.0 | 2.0 | 1104 | $1,850 | $1.68 | 26d | 1 | 0.64mi |
| 815 Boynton Beach Blvd Unit 11-202 Boynton Beach, FL | 2.0 | 2.0 | 994 | $2,000 | $2.01 | 26d | 1 | 0.66mi |
| 815 Boynton Beach Blvd Unit 6-104 Boynton Beach, FL | 1.0 | 1.0 | 791 | $1,850 | $2.34 | 12d | 1 | 0.66mi |
| 815 Boynton Beach Blvd Unit 14-102 Boynton Beach, FL | 1.0 | 1.0 | 768 | $1,800 | $2.34 | 6d | 1 | 0.66mi |
| 815 Boynton Beach Blvd Unit 14-106 Boynton Beach, FL | 2.0 | 2.0 | 887 | $2,250 | $2.54 | 26d | 1 | 0.72mi |
| 815 Boynton Beach Blvd Unit 14-106 Boynton Beach, FL | 2.0 | 2.0 | 887 | $2,050 | $2.31 | 14d | 1 | 0.72mi |
| 204 Belmont Pl Boynton Beach, FL | 1.0 | 1.0 | 878 | $2,200 | $2.51 | 26d | 1 | 0.74mi |
| 815 Boynton Beach Blvd Unit 15-203 Boynton Beach, FL | 2.0 | 2.0 | 884 | $2,200 | $2.49 | 26d | 1 | 0.75mi |
| 815 Boynton Beach Blvd Unit 16-205 Boynton Beach, FL | 2.0 | 2.0 | 884 | $2,150 | $2.43 | 12d | 1 | 0.81mi |
| 815 Boynton Beach Blvd Unit 10-205 Boynton Beach, FL | 2.0 | 2.0 | 884 | $1,800 | $2.04 | 4d | 1 | 0.81mi |
| 815 Boynton Beach Blvd Unit 10-205 Boynton Beach, FL | 2.0 | 2.0 | 884 | $1,900 | $2.15 | 20d | 1 | 0.81mi |
| 815 Boynton Beach Blvd Unit 12-101 Boynton Beach, FL | 2.0 | 2.0 | 887 | $1,900 | $2.14 | 26d | 1 | 0.81mi |
| 2301 S Congress Ave Boynton Beach, FL | 1.0–3.0 | 1.0–2.0 | 1033 | $2,156 | $2.09 | 1d | 16 | 0.87mi |
| 600 Sealofts Dr Boynton Beach, FL | 1.0 | 1.0 | 882 | $2,476 | $2.81 | 5d | 1 | 0.90mi |
| 600 Sealofts Dr Boynton Beach, FL | 1.0 | 1.0 | 882 | $2,360 | $2.68 | 3d | 1 | 0.90mi |
| 600 Sealofts Dr Boynton Beach, FL | 2.0 | 2.0 | 1066 | $2,716 | $2.55 | 4d | 1 | 0.90mi |
| 600 Sealofts Dr Boynton Beach, FL | 1.0–3.0 | 1.0–2.5 | 1217 | $2,849 | $2.34 | 0d | 15 | 0.90mi |
| 255 South Blvd Unit D Boynton Beach, FL | 2.0 | 2.0 | 1104 | $2,100 | $1.90 | 26d | 1 | 1.11mi |
| 255 South Blvd Unit D Boynton Beach, FL | 2.0 | 2.0 | 1104 | $1,975 | $1.79 | 4d | 1 | 1.11mi |
| 1100 Audace Ave Boynton Beach, FL | 1.0–3.0 | 1.0–2.0 | 1021 | $2,646 | $2.59 | 0d | 22 | 1.21mi |
| 1000 Audace Ave Boynton Beach, FL | 1.0 | 1.0 | 800 | $2,180 | $2.73 | 23d | 1 | 1.23mi |
| 1000 Audace Ave Boynton Beach, FL | 1.0 | 1.0 | 800 | $2,180 | $2.73 | 18d | 1 | 1.23mi |
| 127 SW 10th Ave Boynton Beach, FL | 2.0 | 1.5 | 754 | $3,500 | $4.64 | 16d | 1 | 1.30mi |
| 115 SW 1st Ave Boynton Beach, FL | 1.0–2.0 | 1.0–2.0 | 804 | $2,250 | $2.80 | 16d | 2 | 1.39mi |
| 113 SE 8th Ave Boynton Beach, FL | 3.0 | 2.0 | 1002 | $3,050 | $3.04 | 23d | 1 | 1.40mi |
| 200 Main Blvd Unit 2D Boynton Beach, FL | 2.0 | 2.0 | 1104 | $1,200 | $1.09 | 18d | 1 | 1.42mi |
| 3 Renaissance Way #210 Boynton Beach, FL | 1.0 | 1.0 | 912 | $1,850 | $2.03 | 6d | 1 | 1.43mi |
| 4 Renaissance Way #302 Boynton Beach, FL | 1.0 | 1.0 | 747 | $1,945 | $2.60 | 12d | 1 | 1.44mi |
Listing history 13 events
-
2026-06-21days on market $160,000 Active 26 DOM
-
2026-06-18days on market $160,000 Active 23 DOM
-
2026-06-17days on market $160,000 Active 22 DOM
-
2026-06-16days on market $160,000 Active 21 DOM
-
2026-06-15days on market $160,000 Active 20 DOM
-
2026-06-13days on market $160,000 Active 18 DOM
-
2026-06-09days on market $160,000 Active 14 DOM
-
2026-06-07days on market $160,000 Active 12 DOM
-
2026-06-04days on market $160,000 Active 9 DOM
-
2026-06-03days on market $160,000 Active 8 DOM
-
2026-06-01days on market $160,000 Active 6 DOM
-
2026-05-31days on market $160,000 Active 5 DOM
-
2026-05-26$160,000 Active
ⓘ Source: listings_history table (triggers on properties + properties_extension) + one-shot
backfill from property_details.listing_events for pre-trigger history.
Climate risk First Street
- Flood 5/10 Major FEMA zone X (unshaded) · 65% chance over 30 yrs
- Wildfire 1/10 Low
- Heat 9/10 Extreme 6 d/yr ≥105°F today · 22 d/yr by 30 yrs out
- Wind 10/10 Extreme 99% chance of damaging wind over 30 yrs
- Air quality 2/10 Low 1 unhealthy d/yr today · 2 by 30 yrs out
Nearby sold comps map
Loading sold comps map…
Walkable amenities ~0.75 mi
Loading nearby amenities…
Taxation est. · year 1
- Rental income
- $26,696
- − Mortgage interest
- −$8,962
- − Property taxes
- −$2,400
- − Insurance
- −$800
- − Repairs & maintenance
- −$2,136
- − Management
- −$2,136
- − Depreciation
- −$4,655
- Taxable income
- $5,608
- Est. tax owed @ 24.0%
- −$1,346
- After-tax cash flow
- $6,475/yr
For passive investors: Depreciation is non-cash, so a rental often shows a tax loss while cash-flowing — sheltering income. Rental losses are passive: they offset passive income freely, and up to $25,000/yr can offset ordinary (W-2) income if you actively participate and your MAGI is under $100k (phasing out to $0 by $150k); unused losses carry forward. On sale, claimed depreciation is recaptured at up to 25%, and gains may owe capital-gains tax (a 1031 exchange can defer both). Figures are a year-1 estimate at your 24.0% rate — not tax advice; consult a CPA.
Condition & rehab AI · 1 photo
A well-maintained apartment with a new roof, but some interior paint wear and an older AC unit. Minor repairs and updates to the interior walls and AC would significantly enhance its value.
Repairs flagged
- Minor interior walls/paint — Some paint wear
- Minor interior walls/paint — Some paint wear
Value-add opportunities
- Both Paint interior walls and trim — Fresh paint enhances curb appeal and interior aesthetics
- Both Replace AC — Modern AC improves comfort and energy efficiency
Renovation cost estimate screening
| Repair item | Severity | Est. cost |
|---|---|---|
| interior walls/paint · Some paint wear | Minor | $500–3,000 |
| interior walls/paint · Some paint wear | Minor | $500–3,000 |
| Total estimated repair cost · 2 items | $1,000–6,000 |
Value-add ROI direction
- Both Paint interior walls and trim — Fresh paint enhances curb appeal and interior aesthetics ↑
- Both Replace AC — Modern AC improves comfort and energy efficiency ↑
ⓘ Cost ranges are severity-bucket heuristics (US national rule-of-thumb). Get contractor quotes + a written scope before underwriting a rehab budget.
Schools (NCES district)
- District
- Palm Beach
- NCES district ID
- 1201500
- Math proficiency
- 46% ▼ -16.00%
- Reading proficiency
- 53% ▼ -4.00%
- Median HH income
- $53,943
- Composite
- 42.72/100
- National rank
- #3160
- State rank
- #34 of 73 in FL
Livability — Boynton Beach
- Score
- 72/100
- State rank
- #351
- US rank
- #6098
Category grades
Schools grade is shown separately in the Schools card above.
Census & demographics
- Census place
- Boynton Beach, FL
- County
- Palm Beach County · 1,438,312 people
- City population
- 148,060
- Metro
- Miami-Fort Lauderdale-Pompano Beach, FL
- Population (ZIP)
- 24,255
- Household income
- $74,223
- Rent vs Own
- Severe rent burden
- 1417.0
Population outlook (Palm Beach County) Hauer SSP2
- Today (2025)
- 1,637,487 people
- By 2030
- 1,743,255 · +6.5%
- By 2040
- 1,948,712 · +19.0%
- By 2050
- 2,132,979 · +30.3%
- By 2075
- 2,530,027 · +54.5%
- By 2100
- 2,706,979 · +65.3%
Race, ethnicity, and origin ACS 2023
- Neighborhood character
- Diverse neighborhood (Simpson 0.66)
- Race & ethnicity
- White 51% Black 23% Hispanic / Latino 17% Two or more races 14% Asian 4%
- Hispanic origin (detail)
- Puerto Rican 3% Cuban 2%
- Common ancestry
- Hispanic 9% Romanian 2% Lithuanian 2%
- Foreign-born
- 29% · Canada, Jamaica, Vietnam
- Languages at home
- 66% English-only · Spanish 16% French/Haitian/Cajun 11% Other Indo-European 5%
Political lean MEDSL · Palm Beach
- 2024 margin
- Toss-up / Even · D 50.0% · R 49.2%
- 2008→2024 swing
- -22.1pp toward R · 2008: 22.9pp · 2024: 0.8pp
- All cycles
- 2024: D+0.8 2020: D+12.8 2016: D+15.3 2012: D+17.0 2008: D+22.9
Not yet ingested
- Civics
- —
Market trends
- HPI YoY
- ▼ -205.96%
- Current HPI
- 335.3805
- Rent YoY
- ▲ 0.93%
- Metro
- Miami-Fort Lauderdale-Pompano Beach, FL
- State GDP YoY
- ▲ 3.28%
- F500 in state
- 36
Industry mix (Fortune 500 HQ in FL)
| Industry | F500 HQs | Revenue |
|---|---|---|
| Industrial Technology | 2 | $29B |
|
||
| Insurance | 2 | $17B |
|
||
| Retail | 1 | $60B |
|
||
| Technology Distribution | 1 | $58B |
|
||
| Homebuilding | 1 | $35B |
|
||
| Technology Manufacturing | 1 | $35B |
|
||
Price history
1 event — show timeline
- 2026-05-26 Listed $160,000 FSBO.com
Cash-flow waterfall
monthlySold comps — $/sqft
last 12 mo · ≤1 miLoading sold comps…