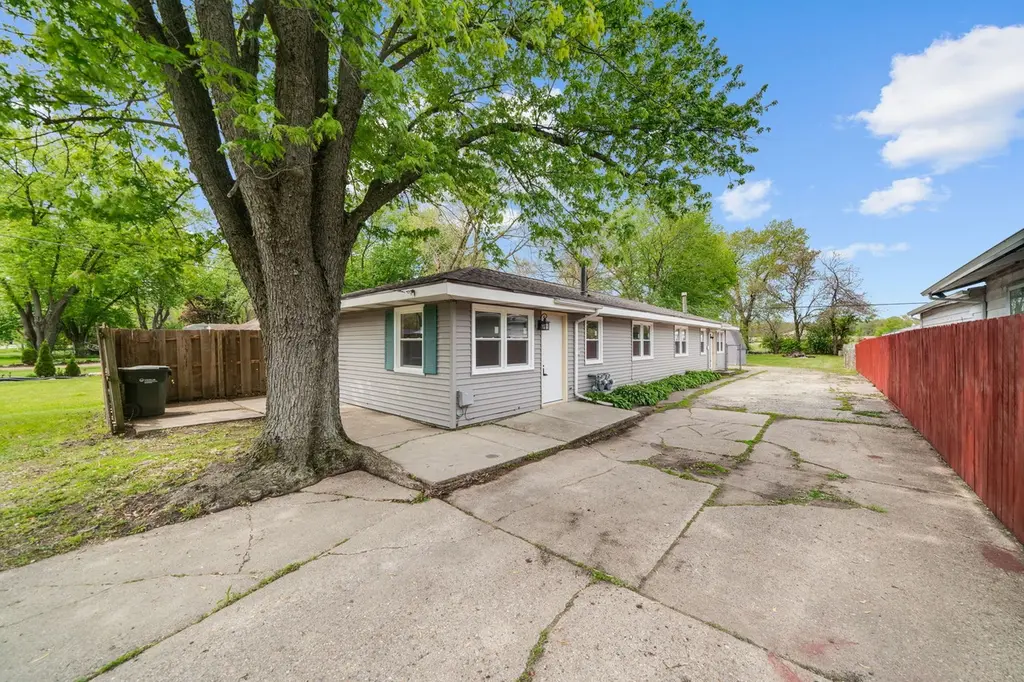
 Duplex
1336 Carbaugh Ave · Rockford, IL
Flood risk 5/10 · Moderate
- FEMA flood zone
- X (unshaded)
- Chance of flooding over 30 yrs
- 0.66%
- Est. flood insurance / yr
- $507 – $1,088
Fire risk 1/10 · Minimal
- Est. fire insurance / yr
- $804 – $1,492
Heat risk 2/10 · Minimal
- Hot days now (above 102°F)
- 7 days/yr
- Hot days in 30 yrs
- 15 days/yr
Wind risk 2/10 · Minimal
- Chance of severe wind over 30 yrs
- —
Air-quality risk 2/10 · Minimal
- Unhealthy air days now
- 1 days/yr
- Unhealthy air days in 30 yrs
- 2 days/yr
Risk factors via First Street. Map © Google.
Why this score? — see what drove the B- grade
The composite is a weighted blend of 9 inputs, each scored 0–100. Each bar is that input's sub-score; the figure is the points it added to the 100-point composite (weight × sub-score).
- Cash flow +30.0/30.0
- 1% rule +10.0/10.0
- DSCR +10.0/10.0
- ARV discount +7.5/15.0
- Livability +3.1/5.0
- Rent growth +2.5/5.0
- Condition / age +2.5/5.0
- Schools +1.2/10.0
- Appreciation +0.0/10.0
$135,000
🖨 Deal sheet 📄 Offer letter ✓ Due diligence
Multi-family units
County records classify this as Multi-Family (2-4 Unit). Listing-text estimate: 2 units. confirmed
Listing remarks MLS
Updated duplex offering a great investment opportunity! Each unit features just under 800 square feet of living space with a living room, eat-in kitchen, two bedrooms, full bathroom, and a dedicated laundry/utility room. Separate gas and electric meters provide added convenience for tenants and owners alike. Property is serviced by city sewer and private well. Recent updates include new exterior doors, new LVP flooring in both living rooms and the back unit bedrooms, and new carpet in the front unit bedrooms. Major mechanical updates include a new roof in 2024, new vinyl windows in 2025, and water heaters replaced in 2021 and 2025. Agent owned.
Key facts
- New exterior doors
- New carpet
- Private well
Tags
Property features AI
Finance
- Other: Property not rebuilt or rehabilitated; Contains 2 separate units (each ~792 ft², each on first floor)
- Financial info: Special service area: No
Exterior
- Parking: Owned parking for 6 vehicles
- Utilities: Well water; Public sewer
- Home design: Two- to four-unit property (2 units total); Fee simple ownership; Built before 1978; estimated age 51–60 years
- Construction: Vinyl siding construction
- Exterior features: Lot dimensions approximately 50 x 247.3; Quarter-acre-ish lot (.25–.49 acre); Vinyl siding
Interior
- Kitchen: Each unit includes a stove
- Bedrooms: 4 bedrooms (2 in each unit)
- Bathrooms: 2 full bathrooms (1 in each unit)
- Heating & cooling: Natural gas forced-air heating
- Interior features: 8 total rooms
Neighborhood map
What this means for you Summary
Snapshot
- This is a 2 × 2-bed/1.0-bath units multifamily listed at $135k.
Deal economics
- At list price, monthly cash flow is $1k ($15k/yr) — positive. Per door: $607/mo.
- The deal already cash-flows at list — no discount required.
- Meets the 1% rule at list price ($3k rent vs $135k).
- Cap rate 17.1% vs local median 6.1% in Rockford — top-decile yield for the area; either an underpriced asset or a hidden risk that comps aren't pricing in. Stress-test before assuming the spread holds.
Location & tenants
- Location reads 62/100 on livability (#876 in IL) — a middle-class / working-renter tenant base. Strengths: cost of living A+, housing A+, health & safety A+; Watch: crime F, amenities F, commute F.
- Rockford SD 205 (urban): math 12% / reading 16% proficiency, ranked #533 of 620 in IL (top 86%) — low school quality limits family demand, transient renter base, plan for 1-2y turnover; 73% free/reduced lunch — lower-income household profile, screen leases tightly.
- Zoned schools: Kennedy Middle School (math 3% / reading 2%, grade F, #660 of 665 statewide, top 100%, 380 students, 0% FRL); Auburn High School (math 26% / reading 32%, grade F, #210 of 693 statewide, top 30%, 1,936 students, 0% FRL) — zoned schools average 0% FRL vs 73% district-wide (73 pts lower); this property's tenant base skews higher-income than the district average.
- Market conditions: 76 active listings in the ZIP; 16 comparable units currently listed for rent nearby; rentals at typical pace (median 21d on market — plan ~3-4 weeks tenant-placement turnaround); 285 units permitted in Winnebago County in 2024 (0 in 5+ unit buildings).
- At $2,648/mo this rent would consume 69% of the median local household income ($46k/yr) (locally 1170% of renters already pay >50% of income on rent) — very limited rent-growth headroom before tenants either downsize or default.
Forward outlook
- Local home prices are declining (-3.0%/yr); year-one equity from $933 of loan paydown is wiped out by about $4k of value loss. Plan a longer hold.
- Winnebago County population projected at -20% by 2050 — secular population decline; favor cash flow + early exit over multi-decade hold.
- At projected returns (-3.0% appreciation + 3.0% rent growth), your $38k cash investment doubles in ~4 years — after that, you're playing with house money.
Negotiation context
- Only 1 days on market — expect competitive offers; lowballing is unlikely to land.
- 2 sale attempts with the ask held roughly flat each time — persistent listings suggest the price (not the market) is what's stuck; bring a comps-based counter.
Risks & watch-outs
- Climate carrying-cost: moderate flood risk — expect insurance premiums to compound above CPI over the hold.
Questions for the listing agent
- Can we see the unit-by-unit rent roll, current vacancy, and any below-market leases? What's the average tenancy length?
- What capital expenditures (roof, boiler, parking lot, exteriors) have been made in the last 5 years, and what's planned in the next 2?
- Built in 1967 — when were the roof, HVAC, electrical panel, plumbing, and water heater last replaced?
- Is there a deadline driving the sale (1031 exchange, divorce, estate, relocation)? That informs how much negotiation room exists.
- Schools are F-rated, which usually means shorter tenancies and higher turnover. Who's the typical renter profile here, and what's been the actual vacancy rate?
- Crime grade is F in this area — have there been break-ins, vandalism, or insurance claims at this property in the last 3 years? What carrier currently insures it and at what premium?
- What's the average days-on-market for RENTAL listings here right now (not sales)? A rising rental-DOM trend means longer vacancies and softer asking-rent achievability than the comps imply.
- What's the recent tenant-quality profile in this submarket — average credit score on applications, eviction rate, late-payment / NSF rate, and stable-employment percentage? A property-management company in the area should have these aggregated.
- How much new apartment / multifamily construction is in the pipeline within 1–3 miles? Heavy new supply (>2% of stock underway) typically softens rents 12–24 months out; light construction supports rent growth.
Investment metrics
- 1% rule
- 1.96% ✓
- Cap rate
- 17.09%
- Cash-on-cash
- 38.57%
- DSCR
- 2.72
- GRM
- 4.2
CMA / ARV
No comps found within radius.
Projected returns pro-forma
-3.0% appreciation · 3.0% rent growth · sell at horizon
- IRR
- 34.7%
- Equity multiple
- 2.47×
- Total profit
- $55,513
- Equity at exit
- $20,129
- IRR
- 41.5%
- Equity multiple
- 4.92×
- Total profit
- $148,005
- Equity at exit
- $11,672
Cash invested: $37,800 (down + closing). Projections, not guarantees.
Landlord ↔ Tenant lean methodology
- Overall (STATE)
- 43 Moderately Tenant-Leaning
- State Illinois
- 43 Moderately Tenant-Leaning · D+7
- County
- — inherits STATE
- City
- — inherits STATE
ZIP-level market 61101
- Home prices YoY
- -25.4%
- Active inventory
- 76
- Price-to-rent
- 8.5×
Monthly cashflow live
- Estimated rent
- $2,648 high interval (Pro) →
- Mortgage (P&I)
- −$708
- Tax from tax record
- −$113 /mo · $1,353/yr
- Insurance
- −$56
- HOA
- −$0
- Vacancy / Maint / Mgmt
- −$556
- Net cashflow
- $1,215
Break-even live
2-unit breakdown (identical units grouped — click to expand)
| Units | Beds | Baths | Est. rent |
|---|---|---|---|
| 2× units | 2 | 1 | $2,648 |
| #1 | 2 | 1 | $1,324 |
| #2 | 2 | 1 | $1,324 |
| Total (2 units) | $2,648 | ||
UW: 25.0% down · 7.5% · 30yr · 1.5% tax · 5.0% vac · 8.0% maint · 8.0% mgmt
Financing live
Cash to close
- Down payment
- $33,750
- Closing costs
- $4,050
- Reserves months
- —
- Total cash needed
- —
Loan-product check · same deal, 3 products live
Conventional
25% down · 7.5% · 30yr
- Down + closing
- —
- Monthly P&I
- —
- Monthly cashflow
- —
- DSCR
- —
- Eligible?
- —
Personal DTI + credit; lowest rate.
DSCR
20% down · 8.5% · 30yr
- Down + closing
- —
- Monthly P&I
- —
- Monthly cashflow
- —
- DSCR
- —
- Eligible?
- —
No personal income docs; deal must DSCR.
Hard money
10% down · 12.0% · 12mo
- Down + closing
- —
- Monthly P&I
- —
- Monthly cashflow
- —
- DSCR
- —
- Eligible?
- —
Short-term bridge; refi at stabilization.
Rent comps 16 comps
| Address | Beds | Baths | Sqft | Rent | $/sqft | DOM | Units | Dist |
|---|---|---|---|---|---|---|---|---|
| 901 N Horace Ave Rockford, IL | 3.0 | 2.0 | 1400 | $1,700 | $1.21 | 13d | 1 | 0.46mi |
| 2511 Ashland Ave Rockford, IL | 4.0 | 2.0 | 2504 | $2,900 | $1.16 | 21d | 1 | 0.63mi |
| 3016 School St Rockford, IL | 4.0 | 1.0 | 1090 | $1,400 | $1.28 | 43d | 1 | 0.72mi |
| 2916 School St Rockford, IL | 3.0 | 1.5 | 1578 | $2,400 | $1.52 | 43d | 1 | 0.73mi |
| 2222 Andrews St Rockford, IL | 4.0 | 1.0 | 1400 | $1,600 | $1.14 | 13d | 1 | 0.99mi |
| 2011 School St Rockford, IL | 3.0 | 1.0 | 950 | $1,500 | $1.58 | 43d | 1 | 1.02mi |
| 326 N Independence Ave Rockford, IL | 3.0 | 1.0 | — | $1,550 | — | 13d | 1 | 1.19mi |
| 1510 School St Unit 1 Rockford, IL | 3.0 | 1.5 | 1400 | $1,200 | $0.86 | 43d | 1 | 1.28mi |
| 2315 Green St Rockford, IL | 3.0 | 1.0 | 1290 | $1,600 | $1.24 | 43d | 1 | 1.30mi |
| 207 N Central Ave Rockford, IL | 4.0 | 1.5 | 1296 | $1,500 | $1.16 | 13d | 1 | 1.35mi |
| 418 Orchard Park Rockford, IL | 3.0 | 1.0 | 1232 | $1,500 | $1.22 | 13d | 1 | 1.38mi |
| 2330 Kilburn Ave Rockford, IL | 2.0–3.0 | 1.0–2.0 | 950 | $1,199 | $1.26 | 13d | 1 | 1.42mi |
| 210 Irving Ave Rockford, IL | 5.0 | 1.0 | 1202 | $1,850 | $1.54 | 43d | 1 | 1.43mi |
| 1146 Fairview Ave Rockford, IL | 4.0 | 1.5 | 1344 | $1,250 | $0.93 | 21d | 1 | 1.47mi |
| 3133 Liberty Dr Rockford, IL | 3.0 | 1.5 | — | $1,675 | — | 21d | 1 | 1.48mi |
| 3834 Preston St Rockford, IL | 3.0 | 1.0 | 912 | $1,300 | $1.43 | 13d | 1 | 1.49mi |
Listing history 4 events
-
2026-05-13status Pending 652-char remark
Show marketing remark (652 chars)
Updated duplex offering a great investment opportunity! Each unit features just under 800 square feet of living space with a living room, eat-in kitchen, two bedrooms, full bathroom, and a dedicated laundry/utility room. Separate gas and electric meters provide added convenience for tenants and owners alike. Property is serviced by city sewer and private well. Recent updates include new exterior doors, new LVP flooring in both living rooms and the back unit bedrooms, and new carpet in the front unit bedrooms. Major mechanical updates include a new roof in 2024, new vinyl windows in 2025, and water heaters replaced in 2021 and 2025. Agent owned.
-
2026-05-13status Pending
Show marketing remark (652 chars)
Updated duplex offering a great investment opportunity! Each unit features just under 800 square feet of living space with a living room, eat-in kitchen, two bedrooms, full bathroom, and a dedicated laundry/utility room. Separate gas and electric meters provide added convenience for tenants and owners alike. Property is serviced by city sewer and private well. Recent updates include new exterior doors, new LVP flooring in both living rooms and the back unit bedrooms, and new carpet in the front unit bedrooms. Major mechanical updates include a new roof in 2024, new vinyl windows in 2025, and water heaters replaced in 2021 and 2025. Agent owned.
-
2026-05-11$135,000 Active 652-char remark
Show marketing remark (652 chars)
Updated duplex offering a great investment opportunity! Each unit features just under 800 square feet of living space with a living room, eat-in kitchen, two bedrooms, full bathroom, and a dedicated laundry/utility room. Separate gas and electric meters provide added convenience for tenants and owners alike. Property is serviced by city sewer and private well. Recent updates include new exterior doors, new LVP flooring in both living rooms and the back unit bedrooms, and new carpet in the front unit bedrooms. Major mechanical updates include a new roof in 2024, new vinyl windows in 2025, and water heaters replaced in 2021 and 2025. Agent owned.
-
2026-05-11$135,000 Active
Show marketing remark (652 chars)
Updated duplex offering a great investment opportunity! Each unit features just under 800 square feet of living space with a living room, eat-in kitchen, two bedrooms, full bathroom, and a dedicated laundry/utility room. Separate gas and electric meters provide added convenience for tenants and owners alike. Property is serviced by city sewer and private well. Recent updates include new exterior doors, new LVP flooring in both living rooms and the back unit bedrooms, and new carpet in the front unit bedrooms. Major mechanical updates include a new roof in 2024, new vinyl windows in 2025, and water heaters replaced in 2021 and 2025. Agent owned.
ⓘ Source: listings_history table (triggers on properties + properties_extension) + one-shot
backfill from property_details.listing_events for pre-trigger history.
Tax reassessment forecast IL · Partial reset (capped growth)
- Current annual tax
- $1,353 · $113/mo
- Projected year-2 tax
- $2,209 · $184/mo
- Expected delta
- +$856/yr (+$71/mo · 63.3%)
ⓘ Screening estimate from a state-policy table — verify with the county assessor before closing.
Climate risk First Street
- Flood 5/10 Major FEMA zone X (unshaded) · 66% chance over 30 yrs
- Wildfire 1/10 Low
- Heat 2/10 Low 7 d/yr ≥102°F today · 15 d/yr by 30 yrs out
- Wind 2/10 Low
- Air quality 2/10 Low 1 unhealthy d/yr today · 2 by 30 yrs out
Nearby sold comps map
Loading sold comps map…
Walkable amenities ~0.75 mi
Loading nearby amenities…
Taxation est. · year 1
- Rental income
- $31,776
- − Mortgage interest
- −$7,562
- − Property taxes
- −$1,353
- − Insurance
- −$675
- − Repairs & maintenance
- −$2,542
- − Management
- −$2,542
- − Depreciation
- −$3,927
- Taxable income
- $13,175
- Est. tax owed @ 24.0%
- −$3,162
- After-tax cash flow
- $11,418/yr
For passive investors: Depreciation is non-cash, so a rental often shows a tax loss while cash-flowing — sheltering income. Rental losses are passive: they offset passive income freely, and up to $25,000/yr can offset ordinary (W-2) income if you actively participate and your MAGI is under $100k (phasing out to $0 by $150k); unused losses carry forward. On sale, claimed depreciation is recaptured at up to 25%, and gains may owe capital-gains tax (a 1031 exchange can defer both). Figures are a year-1 estimate at your 24.0% rate — not tax advice; consult a CPA.
Schools (NCES district)
- District
- Rockford SD 205
- NCES district ID
- 1734510
- Math proficiency
- 12% ▼ -2.00%
- Reading proficiency
- 16% ▼ -3.00%
- Median HH income
- $42,533
- Composite
- 12.21/100
- National rank
- #9649
- State rank
- #533 of 620 in IL
Livability — Rockford
- Score
- 62/100
- State rank
- #876
- US rank
- #17035
Category grades
Schools grade is shown separately in the Schools card above.
Census & demographics
- County
- Winnebago County · 147,297 people
- City population
- 147,297
- Metro
- Rockford, IL
- Population (ZIP)
- 19,318
- Household income
- $46,163
- Rent vs Own
- Severe rent burden
- 1170.0
Population outlook (Winnebago County) Hauer SSP2
- Today (2025)
- 271,080 people
- By 2030
- 260,684 · -3.8%
- By 2040
- 238,405 · -12.1%
- By 2050
- 216,129 · -20.3%
- By 2075
- 172,882 · -36.2%
- By 2100
- 135,336 · -50.1%
Race, ethnicity, and origin ACS 2023
- Neighborhood character
- Diverse neighborhood (Simpson 0.66)
- Race & ethnicity
- White 44% Black 34% Hispanic / Latino 16% Two or more races 8% Asian 1%
- Hispanic origin (detail)
- Mexican 14% Puerto Rican 1%
- Common ancestry
- Romanian 3% Italian 2% Portuguese 2%
- Foreign-born
- 9% · Canada
- Languages at home
- 84% English-only · Spanish 13% Other Indo-European 1% Russian/Polish/Slavic 1%
Political lean MEDSL · Winnebago
- 2024 margin
- Toss-up / Even · D 49.5% · R 49.0% · Other 1.5%
- 2008→2024 swing
- -12.2pp toward R · 2008: 12.8pp · 2024: 0.6pp
- All cycles
- 2024: D+0.6 2020: D+2.5 2016: R+1.2 2012: D+5.7 2008: D+12.8
Not yet ingested
- Civics
- —
Market trends
- HPI YoY
- ▼ -69.58%
- Current HPI
- 204.8946
- Rent YoY
- —
- Metro
- Rockford, IL
- State GDP YoY
- ▲ 1.59%
- F500 in state
- 60
Industry mix (Fortune 500 HQ in IL)
| Industry | F500 HQs | Revenue |
|---|---|---|
| Insurance | 4 | $201B |
|
||
| Consumer Goods | 4 | $87B |
|
||
| Industrial Machinery | 3 | $64B |
|
||
| Healthcare | 2 | $55B |
|
||
| Retail / Pharmacy | 1 | $148B |
|
||
| Agriculture / Food | 1 | $86B |
|
||
Price history
+0.0% since first listed4 events — show timeline
- 2026-05-13 Pending — NWIAR
- 2026-05-13 Pending — MRED as Distributed by MLS Grid
- 2026-05-11 Listed $135,000 NWIAR
- 2026-05-11 Listed $135,000 MRED as Distributed by MLS Grid
Property tax history
+1.0%/yrLatest (2024): $1,353 · +4.4% YoY. Source: county tax records.
Cash-flow waterfall
monthlySold comps — $/sqft
last 12 mo · ≤1 miLoading sold comps…