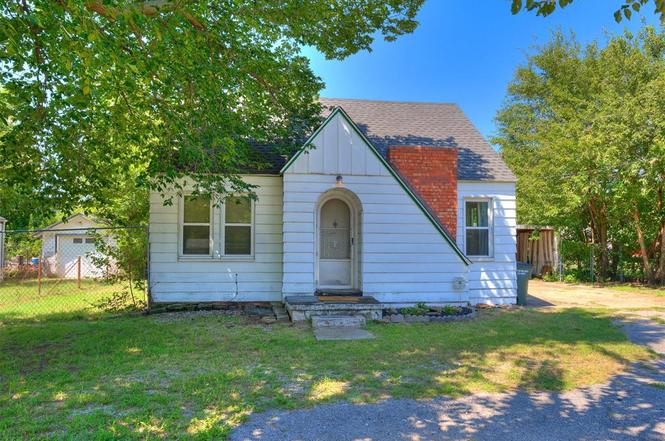
605 S Sooner Rd · Del City, OK
Flood risk 1/10 · Minimal
- FEMA flood zone
- X (unshaded)
- Chance of flooding over 30 yrs
- 0.0%
- Est. flood insurance / yr
- $507 – $1,088
Fire risk 1/10 · Minimal
- Est. fire insurance / yr
- $2,463 – $4,575
Heat risk 5/10 · Moderate
- Hot days now (above 107°F)
- 7 days/yr
- Hot days in 30 yrs
- 18 days/yr
Wind risk 3/10 · Minor
- Chance of severe wind over 30 yrs
- 4.0%
Air-quality risk 2/10 · Minimal
- Unhealthy air days now
- 1 days/yr
- Unhealthy air days in 30 yrs
- 2 days/yr
Risk factors via First Street. Map © Google.
Why this score? — see what drove the B- grade
The composite is a weighted blend of 9 inputs, each scored 0–100. Each bar is that input's sub-score; the figure is the points it added to the 100-point composite (weight × sub-score).
- Cash flow +27.8/30.0
- ARV discount +15.0/15.0
- DSCR +9.8/10.0
- 1% rule +7.6/10.0
- Livability +3.2/5.0
- Rent growth +2.8/5.0
- Condition / age +2.5/5.0
- Schools +1.2/10.0
- Appreciation +0.0/10.0
$115,000
🖨 Deal sheet (PDF) 📄 Offer letter ✓ Due diligence
Listing remarks
1/2 Acre MOL in the city. Easy access to downtown and Tinker AFB. The Charming Vintage home has a kitchen with plenty of room for your kitchen table and guests! The large living room could possibly fit a sectional that you might choose to furnish your new home with. Spend time alone with the kids upstairs in their own space. Enjoy all your family gatherings in this large backyard in the city. Updates-all of its windows (except one) switched out to vinyl. Not only do they save energy but the interior of the home is quiet. The grey and white marble look tile accent the sleek vanity in the bathroom. A low water usage toilet was installed to save on water. Laundry room is inside. Come and see.
Key facts
- Vinyl windows
- Large backyard
- 1/2 acre mol
Tags
Property features AI
Finance
- Other: Property is existing (not new construction); Located in UNPLTD PT SEC 05 11N 2W
- Financial info: Loan qualifying available
- HOA & community: No mandatory association dues
Exterior
- Security: Below-ground and outdoor storm shelter
- Home design: Single family residence; Two-level property; Residential property
- Construction: Brick and frame construction; Composition roof (replaced or updated 2024); Conventional foundation
- Exterior features: Open patio; Outbuildings; Rain gutters; Chain link fencing; Interior lot
Interior
- Kitchen: Free standing electric oven
- Bedrooms: 3 bedrooms
- Flooring: Carpet; Laminate; Tile
- Bathrooms: 1 full bathroom
- Interior features: Dishwasher and refrigerator included; One dining area; One living area; No fireplace
Neighborhood map
What this means for you Summary
Snapshot
- This is a 3-bed/1.0-bath single-family listed at $115k.
Deal economics
- At list price, monthly cash flow is $350 ($4k/yr) — positive.
- The deal already cash-flows at list — no discount required.
- Meets the 1% rule at list price ($1k rent vs $115k).
- Cap rate 9.9% vs local median 5.9% in Del City — top-decile yield for the area; either an underpriced asset or a hidden risk that comps aren't pricing in. Stress-test before assuming the spread holds.
Location & tenants
- Location reads 64/100 on livability (#180 in OK) — a middle-class / working-renter tenant base. Strengths: cost of living A+, housing A+; Watch: health & safety C-, amenities D, crime F.
- Midwest City-Del City (suburban): math 10% / reading 17% proficiency, ranked #231 of 270 in OK (top 86%) — low school quality limits family demand, transient renter base, plan for 1-2y turnover.
- Zoned schools: Del City Es (math 8% / reading 12%, grade F, #711 of 845 statewide, top 87%, 523 students, 0% FRL); Del City Hs (math 5% / reading 15%, grade F, #361 of 447 statewide, top 94%, 1,158 students, 0% FRL) — zoned schools average 0% FRL vs 57% district-wide (57 pts lower); this property's tenant base skews higher-income than the district average.
- Market conditions: Rents rising (+1.3%/yr); 121 active listings in the ZIP; 29 comparable units currently listed for rent nearby; rentals at typical pace (median 17d on market — plan ~3-4 weeks tenant-placement turnaround); 5,365 units permitted in Oklahoma County in 2024 (569 in 5+ unit buildings).
- This rent runs 37% of the median local income ($47k/yr) — at the standard rent-burdened threshold; future hikes will face affordability resistance.
Forward outlook
- Local home prices are declining (-3.0%/yr); year-one equity from $795 of loan paydown is wiped out by about $3k of value loss. Plan a longer hold.
- Oklahoma County population projected at +41% by 2050 — long-run rental-demand tailwind backs the buy-and-hold thesis.
Negotiation context
- Only 6 days on market — expect competitive offers; lowballing is unlikely to land.
Risks & watch-outs
- Watch-outs: built in 1930 — expect roof / HVAC / electrical / plumbing capex.
- Climate carrying-cost: extreme-heat days projected 7→18/yr by 2055 (HVAC capex compounding) — expect insurance premiums to compound above CPI over the hold.
Questions for the listing agent
- Built in 1930 — when were the roof, HVAC, electrical panel, plumbing, and water heater last replaced?
- Is there a deadline driving the sale (1031 exchange, divorce, estate, relocation)? That informs how much negotiation room exists.
- Schools are F-rated, which usually means shorter tenancies and higher turnover. Who's the typical renter profile here, and what's been the actual vacancy rate?
- Crime grade is F in this area — have there been break-ins, vandalism, or insurance claims at this property in the last 3 years? What carrier currently insures it and at what premium?
- What's the average days-on-market for RENTAL listings here right now (not sales)? A rising rental-DOM trend means longer vacancies and softer asking-rent achievability than the comps imply.
- What's the recent tenant-quality profile in this submarket — average credit score on applications, eviction rate, late-payment / NSF rate, and stable-employment percentage? A property-management company in the area should have these aggregated.
- How much new for-sale + rental construction is in the pipeline within 1–3 miles? Heavy new supply typically softens prices + rents 12–24 months out; constrained supply supports both.
Investment metrics
- 1% rule
- 1.26% ✓
- Cap rate
- 9.94%
- Cash-on-cash
- 13.03%
- DSCR
- 1.58
- GRM
- 6.6
CMA / ARV
- ARV (on-the-fly)
- $191,835
- Comps found
- 12
Show comp detail 12 sales within ~0.75 mi
| Address | Dist | Beds/Ba | Sqft | Sold | Price | $/sf | Match |
|---|---|---|---|---|---|---|---|
| 4809 Michael Pl | 0.40mi | 3/1.5 | 1,292 (-2%) | 3mo | $98,000 | $76 | 73 |
| 6121 SE 6th St | 0.40mi | 3/2.0 | 1,398 (+6%) | 0mo | $214,500 | $153 | 68 |
| 4704 Michael Dr | 0.49mi | 3/1.5 | 1,253 (-5%) | 1mo | $175,000 | $140 | 66 |
| 4805 Trina Dr | 0.52mi | 3/1.5 | 1,357 (+3%) | 4mo | $135,000 | $99 | 66 |
| 4805 Leslie Dr | 0.35mi | 3/1.0 | 1,191 (-10%) | 2mo | $142,000 | $119 | 65 |
| 1032 W Woodcrest Dr | 0.68mi | 3/1.5 | 1,298 (-2%) | 2mo | $189,500 | $146 | 62 |
| 229 Spring Creek Rd | 0.64mi | 3/2.0 | 1,272 (-4%) | 4mo | $212,000 | $167 | 56 |
| 410 Vickie Dr | 0.45mi | 3/2.0 | 1,188 (-10%) | 4mo | $173,000 | $146 | 54 |
| 6121 SE 7th St | 0.42mi | 3/2.0 | 1,487 (+12%) | 3mo | $161,000 | $108 | 53 |
| 3001 N Peebly Dr | 0.55mi | 3/1.5 | 1,188 (-10%) | 4mo | $172,500 | $145 | 52 |
| 5904 SE 10th St | 0.43mi | 3/2.0 | 1,519 (+15%) | 1mo | $232,000 | $153 | 50 |
| 933 Brown Dr | 0.68mi | 4/2.0 (+1) | 1,466 (+11%) | 5mo | $202,000 | $138 | 37 |
Match score weights: distance 35% · size 25% · config 20% · recency 20%. Top-matched comps best support the ARV.
Projected returns pro-forma
-3.0% appreciation · 1.26% rent growth · sell at horizon
- IRR
- 1.0%
- Equity multiple
- 1.04×
- Total profit
- $1,161
- Equity at exit
- $17,147
- IRR
- 8.8%
- Equity multiple
- 1.62×
- Total profit
- $19,894
- Equity at exit
- $9,943
Cash invested: $32,200 (down + closing). Projections, not guarantees.
Landlord ↔ Tenant lean methodology
- Overall (STATE)
- 83 Strongly Landlord-Friendly
- State Oklahoma
- 83 Strongly Landlord-Friendly · R+20
- County
- — inherits STATE
- City
- — inherits STATE
ZIP-level market 73115
- Home prices YoY
- -20.9%
- Rents YoY
- 1.3%
- Active inventory
- 121
- Price-to-rent
- 6.6×
Monthly cashflow live
- Estimated rent
- $1,449 high interval (Pro) →
- Mortgage (P&I)
- −$603
- Tax est. 1.5%
- −$144 /mo · $1,725/yr
- Insurance
- −$48
- HOA
- −$0
- Lot rent
- −$0
- Vacancy / Maint / Mgmt
- −$304
- Net cashflow
- $350
Break-even live
Sensitivity live
| Price | -10% $429 | -5% $389 | +0% $350 | +5% $310 | +10% $270 |
|---|---|---|---|---|---|
| Rent | -10% $235 | -5% $292 | +0% $350 | +5% $407 | +10% $464 |
| Rate | -1.0pp $408 | -0.5pp $379 | base $350 | +0.5pp $320 | +1.0pp $289 |
UW: 25.0% down · 7.5% · 30yr · 1.5% tax · 5.0% vac · 8.0% maint · 8.0% mgmt
Financing live
Cash to close
- Down payment
- $28,750
- Closing costs
- $3,450
- Reserves months
- —
- Total cash needed
- —
Loan-product check · same deal, 3 products live
Conventional
25% down · 7.5% · 30yr
- Down + closing
- —
- Monthly P&I
- —
- Monthly cashflow
- —
- DSCR
- —
- Eligible?
- —
Personal DTI + credit; lowest rate.
DSCR
20% down · 8.5% · 30yr
- Down + closing
- —
- Monthly P&I
- —
- Monthly cashflow
- —
- DSCR
- —
- Eligible?
- —
No personal income docs; deal must DSCR.
Hard money
10% down · 12.0% · 12mo
- Down + closing
- —
- Monthly P&I
- —
- Monthly cashflow
- —
- DSCR
- —
- Eligible?
- —
Short-term bridge; refi at stabilization.
Rent comps 29 comps
| Address | Beds | Baths | Sqft | Rent | $/sqft | DOM | Units | Dist |
|---|---|---|---|---|---|---|---|---|
| 4816 Michael Dr Oklahoma City, OK | 3.0 | 2.0 | 1497 | $1,525 | $1.02 | 17d | 1 | 0.36mi |
| 6001 SE 8th St Oklahoma City, OK | 3.0 | 2.0 | 1435 | $1,900 | $1.32 | 0d | 1 | 0.36mi |
| 4812 Gina Pl Oklahoma City, OK | 3.0 | 1.5 | 1138 | $1,100 | $0.97 | 26d | 1 | 0.38mi |
| 233 Spring Creek Rd Oklahoma City, OK | 4.0 | 2.0 | 1614 | $1,650 | $1.02 | 0d | 1 | 0.67mi |
| 233 Spring Creek Rd Oklahoma City, OK | 4.0 | 2.0 | 1574 | $1,650 | $1.05 | 13d | 1 | 0.67mi |
| 1318 Alviola Ave Oklahoma City, OK | 3.0 | 2.0 | 1835 | $1,700 | $0.93 | 13d | 1 | 0.69mi |
| 309 Spring Creek Rd Oklahoma City, OK | 3.0 | 1.0 | 1336 | $1,395 | $1.04 | 26d | 1 | 0.70mi |
| 4625 Tinker Diagonal Oklahoma City, OK | 3.0 | 3.0 | 1400 | $1,300 | $0.93 | 19d | 1 | 0.71mi |
| 4625 Tinker Diagonal Oklahoma City, OK | 2.0 | 2.0 | 900 | $1,050 | $1.17 | 14d | 1 | 0.71mi |
| 1933 Rulane Dr Oklahoma City, OK | 4.0 | 1.0 | 1500 | $1,250 | $0.83 | 26d | 1 | 0.78mi |
| 441 Hidden Creek Way Oklahoma City, OK | 3.0 | 2.0 | 1338 | $1,775 | $1.33 | 18d | 1 | 0.81mi |
| 4340 Woodedge Dr Oklahoma City, OK | 3.0 | 1.0 | 1026 | $1,250 | $1.22 | 4d | 1 | 0.97mi |
| 6608 SE 15th St Oklahoma City, OK | 3.0 | 2.0 | 1103 | $1,425 | $1.29 | 23d | 1 | 1.00mi |
| 2113 Candy Ln Del City, OK | 4.0 | 2.0 | 1597 | $1,550 | $0.97 | 4d | 1 | 1.17mi |
| 2904 Treight Creek Ln Midwest City, OK | 2.0 | 2.0 | 984 | $1,495 | $1.52 | 0d | 2 | 1.25mi |
| 1111 Jet Dr Oklahoma City, OK | 3.0 | 1.0 | 1067 | $1,095 | $1.03 | 23d | 1 | 1.26mi |
| 1111 Jet Dr Oklahoma City, OK | 3.0 | 1.0 | 1067 | $1,095 | $1.03 | 6d | 1 | 1.26mi |
| 4772 SE 23rd St Oklahoma City, OK | 3.0 | 1.0 | 1044 | $1,300 | $1.25 | 4d | 1 | 1.29mi |
| 4010 SE 14th Pl Del City, OK | 3.0 | 2.0 | 1500 | $1,295 | $0.86 | 26d | 1 | 1.30mi |
| 317 W Peach St Oklahoma City, OK | 2.0 | 1.0 | 878 | $1,045 | $1.19 | 5d | 1 | 1.31mi |
| 2105 Maple Dr Midwest City, OK | 3.0 | 2.0 | 1032 | $1,295 | $1.25 | 26d | 1 | 1.35mi |
| 3632 Sunvalley Dr Oklahoma City, OK | 2.0 | 2.0 | 1454 | $1,499 | $1.03 | 0d | 1 | 1.40mi |
| 3939 SE 14th Pl Del City, OK | 3.0 | 2.0 | 1134 | $1,395 | $1.23 | 26d | 1 | 1.40mi |
| 3939 SE 14th Pl Del City, OK | 3.0 | 2.0 | 1134 | $1,395 | $1.23 | 6d | 1 | 1.40mi |
| 204 Elm St Oklahoma City, OK | 3.0 | 2.0 | 1098 | $1,250 | $1.14 | 26d | 1 | 1.42mi |
| 1436 Maple Dr Oklahoma City, OK | 4.0 | 2.0 | 1409 | $1,350 | $0.96 | 18d | 1 | 1.43mi |
| 3928 Teal Dr Oklahoma City, OK | 3.0 | 1.0 | 1033 | $1,200 | $1.16 | 19d | 1 | 1.46mi |
| 3920 SE 14th St Del City, OK | 3.0 | 2.0 | 1161 | $1,295 | $1.12 | 26d | 1 | 1.47mi |
| 110 E Myrtle Dr Oklahoma City, OK | 3.0 | 1.5 | 1236 | $1,300 | $1.05 | 14d | 1 | 1.49mi |
Listing history 19 events
-
2026-06-22days on market $115,000 Active 6 DOM
-
2026-06-21days on market $115,000 Active 5 DOM
-
2026-06-18days on market $115,000 Active 2 DOM
-
2026-06-17remarks 699-char remark
-
2026-06-17days on market $115,000 Active 1 DOM
-
2026-06-15days on market $115,000 Active 160 DOM
-
2026-06-13days on market $115,000 Active 158 DOM
-
2026-06-13days on market $115,000 Active 157 DOM
-
2026-06-09days on market $115,000 Active 154 DOM
-
2026-06-08days on market $115,000 Active 153 DOM
-
2026-06-07days on market $115,000 Active 152 DOM
-
2026-06-05days on market $115,000 Active 149 DOM
-
2026-06-03days on market $115,000 Active 148 DOM
-
2026-06-02days on market $115,000 Active 147 DOM
-
2026-06-01days on market $115,000 Active 146 DOM
-
2026-05-31days on market $115,000 Active 145 DOM
-
2026-05-13price $115,000
-
2026-02-10price $125,000
-
2026-01-06$129,900 Active
ⓘ Source: listings_history table (triggers on properties + properties_extension) + one-shot
backfill from property_details.listing_events for pre-trigger history.
Climate risk First Street
- Flood 1/10 Low FEMA zone X (unshaded) · 0% chance over 30 yrs
- Wildfire 1/10 Low
- Heat 5/10 Major 7 d/yr ≥107°F today · 18 d/yr by 30 yrs out
- Wind 3/10 Moderate 4% chance of damaging wind over 30 yrs
- Air quality 2/10 Low 1 unhealthy d/yr today · 2 by 30 yrs out
Nearby sold comps map
Loading sold comps map…
Walkable amenities ~0.75 mi
Loading nearby amenities…
Taxation est. · year 1
- Rental income
- $17,382
- − Mortgage interest
- −$6,442
- − Property taxes
- −$1,725
- − Insurance
- −$575
- − Repairs & maintenance
- −$1,391
- − Management
- −$1,391
- − Depreciation
- −$3,345
- Taxable income
- $2,514
- Est. tax owed @ 24.0%
- −$603
- After-tax cash flow
- $3,592/yr
For passive investors: Depreciation is non-cash, so a rental often shows a tax loss while cash-flowing — sheltering income. Rental losses are passive: they offset passive income freely, and up to $25,000/yr can offset ordinary (W-2) income if you actively participate and your MAGI is under $100k (phasing out to $0 by $150k); unused losses carry forward. On sale, claimed depreciation is recaptured at up to 25%, and gains may owe capital-gains tax (a 1031 exchange can defer both). Figures are a year-1 estimate at your 24.0% rate — not tax advice; consult a CPA.
Schools (NCES district)
- District
- Midwest City-Del City
- NCES district ID
- 4019950
- Math proficiency
- 10% ▼ -11.00%
- Reading proficiency
- 17% ▼ -8.00%
- Median HH income
- $45,724
- Composite
- 12.09/100
- National rank
- #9658
- State rank
- #231 of 270 in OK
Livability — Del City
- Score
- 64/100
- State rank
- #180
- US rank
- #14305
Category grades
Schools grade is shown separately in the Schools card above.
Census & demographics
- Census place
- Del City, OK
- County
- Oklahoma County · 771,644 people
- City population
- 20,225
- Metro
- Oklahoma City, OK
- Population (ZIP)
- 20,225
- Household income
- $46,810
- Rent vs Own
- Severe rent burden
- 965.0
Population outlook (Oklahoma County) Hauer SSP2
- Today (2025)
- 911,875 people
- By 2030
- 982,413 · +7.7%
- By 2040
- 1,130,468 · +24.0%
- By 2050
- 1,288,422 · +41.3%
- By 2075
- 1,711,482 · +87.7%
- By 2100
- 2,088,448 · +129.0%
Race, ethnicity, and origin ACS 2023
- Neighborhood character
- Diverse neighborhood (Simpson 0.69)
- Race & ethnicity
- White 50% Black 19% Hispanic / Latino 15% Two or more races 14% Native American 5% Asian 1%
- Hispanic origin (detail)
- Mexican 11% Puerto Rican 2%
- Common ancestry
- Italian 2% Lithuanian 1% Slovak 1%
- Foreign-born
- 4% · Canada
- Languages at home
- 91% English-only · Spanish 8%
Political lean MEDSL · Oklahoma
- 2024 margin
- Toss-up / Even · D 48.0% · R 49.7% · Other 2.3%
- 2008→2024 swing
- +15.1pp toward D · 2008: -16.8pp · 2024: -1.7pp
- All cycles
- 2024: R+1.7 2020: R+1.1 2016: R+10.5 2012: R+16.7 2008: R+16.8
Not yet ingested
- Civics
- —
Market trends
- HPI YoY
- ▼ -71.80%
- Current HPI
- 271.8383
- Rent YoY
- ▲ 1.26%
- Metro
- Oklahoma City, OK
- State GDP YoY
- ▲ 1.55%
- F500 in state
- 6
Industry mix (Fortune 500 HQ in OK)
| Industry | F500 HQs | Revenue |
|---|---|---|
| Energy | 3 | $48B |
|
||
Price history
-11.5% since first listed3 events — show timeline
- 2026-05-13 Price Changed $115,000 MLSOK
- 2026-02-10 Price Changed $125,000 MLSOK
- 2026-01-06 Listed $129,900 MLSOK
Cash-flow waterfall
monthlySold comps — $/sqft
last 12 mo · ≤1 miLoading sold comps…