 Duplex
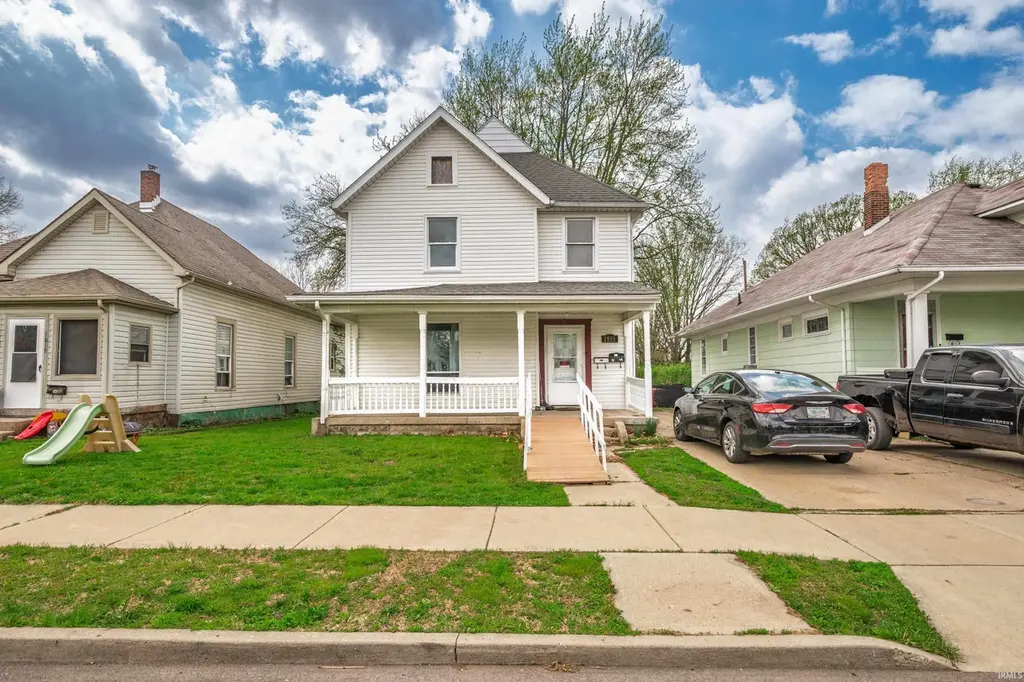
1815 & 1815 1/2 Fletcher St · Anderson, IN
Flood risk 1/10 · Minimal
- FEMA flood zone
- X (unshaded)
- Chance of flooding over 30 yrs
- 0.0%
- Est. flood insurance / yr
- $473 – $860
Fire risk 1/10 · Minimal
- Est. fire insurance / yr
- $717 – $1,331
Heat risk 3/10 · Minor
- Hot days now (above 100°F)
- 7 days/yr
- Hot days in 30 yrs
- 18 days/yr
Wind risk 2/10 · Minimal
- Chance of severe wind over 30 yrs
- —
Air-quality risk 3/10 · Minor
- Unhealthy air days now
- 2 days/yr
- Unhealthy air days in 30 yrs
- 3 days/yr
Risk factors via First Street. Map © Google.
Why this score? — see what drove the C+ grade
The composite is a weighted blend of 9 inputs, each scored 0–100. Each bar is that input's sub-score; the figure is the points it added to the 100-point composite (weight × sub-score).
- Cash flow +30.0/30.0
- 1% rule +10.0/10.0
- DSCR +10.0/10.0
- Rent growth +4.5/5.0
- Livability +3.0/5.0
- Condition / age +2.2/5.0
- Schools +1.6/10.0
- ARV discount +0.0/15.0
- Appreciation +0.0/10.0
$112,900
🖨 Deal sheet 📄 Offer letter ✓ Due diligence
Multi-family units
County records classify this as Multi-Family (2-4 Unit). Listing-text estimate: 2 units. confirmed
Listing remarks MLS
This package features six consistently high-demand rental duplex properties (12 units) situated in the Anderson, IN market. The portfolio offers a secure, well-managed investment with immediate upside potential. Stable Income Stream: The properties demonstrate strong, reliable cash flow, supported by excellent historical rent collection and exceptional occupancy rates (minimal historical vacancy). Turnkey Efficiency: Current owners have meticulously maintained the units, significantly minimizing the need for immediate Capital Expenditure (CapEx). Value-Add Opportunity: Current rents are below prevailing market rates for comparable local properties, providing a clear path for substantial income growth through gradual rent increases to achieve market value. Tenant Stability: Due to diligent maintenance, the properties have high long-term tenant satisfaction, contributing to low turnover. Seller will sell individually or as a group-addresses: 403-405 W 5th St, 1105-1107 W 11th St, 1109-1111 W 11th St, 1303-1305 Sycamore, 615-615 1/2 Madison and 1815 - 1815 1/2 Fletcher.
Key facts
- 5,663 sq ft lot
- 4 parking spots
- Built 1884
Neighborhood map
What this means for you Summary
Snapshot
- This is a 2 × 2-bed/?-bath units multifamily listed at $113k. Condition is rated fair.
Deal economics
- At list price, monthly cash flow is $776 ($9k/yr) — positive. Per door: $388/mo.
- The deal already cash-flows at list — no discount required.
- Meets the 1% rule at list price ($2k rent vs $113k).
- Recommended offer: $110k (3.0% below list) — sets the bar for market timing.
- Cap rate 14.5% vs local median 6.5% in Anderson — top-decile yield for the area; either an underpriced asset or a hidden risk that comps aren't pricing in. Stress-test before assuming the spread holds.
Location & tenants
- Location reads 60/100 on livability (#521 in IN) — a middle-class / working-renter tenant base. Strengths: cost of living A+, housing A+; Watch: schools F, crime D-, amenities F.
- Anderson Community School Corporation (urban): math 15% / reading 23% proficiency, ranked #280 of 301 in IN (top 93%) — low school quality limits family demand, transient renter base, plan for 1-2y turnover; 70% free/reduced lunch — lower-income household profile, screen leases tightly.
- Market conditions: Rents rising fast (+7.9%/yr); 185 active listings in the ZIP; 6 comparable units currently listed for rent nearby; rentals at typical pace (median 24d on market — plan ~3-4 weeks tenant-placement turnaround); lower-income renter base — watch delinquency; 184 units permitted in Madison County in 2024 (0 in 5+ unit buildings).
- At $1,970/mo this rent would consume 66% of the median local household income ($36k/yr) (locally 1193% of renters already pay >50% of income on rent) — very limited rent-growth headroom before tenants either downsize or default.
Forward outlook
- Local home prices are declining (-3.0%/yr); year-one equity from $781 of loan paydown is wiped out by about $3k of value loss. Plan a longer hold.
- Madison County population projected at -14% by 2050 — secular population decline; favor cash flow + early exit over multi-decade hold.
- At projected returns (-3.0% appreciation + 7.9% rent growth), your $32k cash investment doubles in ~4 years — after that, you're playing with house money.
Negotiation context
- It's been on market 57 days — a 3% lower offer ($110k) is reasonable based on typical stale-listing flexibility.
- 2 sale attempts with the ask held roughly flat each time — persistent listings suggest the price (not the market) is what's stuck; bring a comps-based counter.
Risks & watch-outs
- Watch-outs: built in 1884 — expect roof / HVAC / electrical / plumbing capex.
Questions for the listing agent
- It's been on market 57 days. Have you received any prior offers? Is the seller open to a 3% concession, seller financing, or rate buy-down credit?
- Can we see the unit-by-unit rent roll, current vacancy, and any below-market leases? What's the average tenancy length?
- What capital expenditures (roof, boiler, parking lot, exteriors) have been made in the last 5 years, and what's planned in the next 2?
- Have any recent inspections been done? Can we get a copy of the seller's disclosures and any deferred-maintenance estimates?
- Built in 1884 — when were the roof, HVAC, electrical panel, plumbing, and water heater last replaced?
- Is there a deadline driving the sale (1031 exchange, divorce, estate, relocation)? That informs how much negotiation room exists.
- Schools are F-rated, which usually means shorter tenancies and higher turnover. Who's the typical renter profile here, and what's been the actual vacancy rate?
- Crime grade is D in this area — have there been break-ins, vandalism, or insurance claims at this property in the last 3 years? What carrier currently insures it and at what premium?
- What's the average days-on-market for RENTAL listings here right now (not sales)? A rising rental-DOM trend means longer vacancies and softer asking-rent achievability than the comps imply.
- What's the recent tenant-quality profile in this submarket — average credit score on applications, eviction rate, late-payment / NSF rate, and stable-employment percentage? A property-management company in the area should have these aggregated.
- How much new apartment / multifamily construction is in the pipeline within 1–3 miles? Heavy new supply (>2% of stock underway) typically softens rents 12–24 months out; light construction supports rent growth.
Investment metrics
- 1% rule
- 1.74% ✓
- Cap rate
- 14.54%
- Cash-on-cash
- 29.46%
- DSCR
- 2.31
- GRM
- 4.8
CMA / ARV
- ARV (median comp)
- $92,127
- List price
- $112,900
- Delta
- 22.55%
- Verdict
- OVERPRICED
- Comps
- 19 within 1.0 mi
Show comp detail 5 sales within ~0.75 mi
| Address | Dist | Beds/Ba | Sqft | Sold | Price | $/sf | Match |
|---|---|---|---|---|---|---|---|
| 1820 Central Ave | 0.04mi | 3/2.0 (-1) | 1,762 (-14%) | 3mo | $85,000 | $48 | 65 |
| 1609 Brown St | 0.39mi | 5/2.0 (+1) | 1,934 (-6%) | 10mo | $135,000 | $70 | 56 |
| 2213 Noble St | 0.34mi | 5/2.0 (+1) | 2,314 (+12%) | 11mo | $70,000 | $30 | 47 |
| 806 E 9th St | 0.73mi | 4/2.0 | 2,048 (-0%) | 21mo | $50,000 | $24 | 46 |
| 2116 Pearl St | 0.23mi | 5/3.0 (+1) | 2,357 (+14%) | 24mo | $125,000 | $53 | 38 |
Match score weights: distance 35% · size 25% · config 20% · recency 20%. Top-matched comps best support the ARV.
Projected returns pro-forma
-3.0% appreciation · 7.88% rent growth · sell at horizon
- IRR
- 29.4%
- Equity multiple
- 2.31×
- Total profit
- $41,313
- Equity at exit
- $16,834
- IRR
- 39.4%
- Equity multiple
- 5.61×
- Total profit
- $145,818
- Equity at exit
- $9,762
Cash invested: $31,612 (down + closing). Projections, not guarantees.
Landlord ↔ Tenant lean methodology
- Overall (STATE)
- 90 Strongly Landlord-Friendly
- State Indiana
- 90 Strongly Landlord-Friendly · R+11
- County
- — inherits STATE
- City
- — inherits STATE
ZIP-level market 46016
- Home prices YoY
- -3.5%
- Rents YoY
- 7.9%
- Active inventory
- 185
- Price-to-rent
- 9.6×
Monthly cashflow live
- Estimated rent
- $1,970 high interval (Pro) →
- Mortgage (P&I)
- −$592
- Tax est. 1.5%
- −$141 /mo · $1,694/yr
- Insurance
- −$47
- HOA
- −$0
- Vacancy / Maint / Mgmt
- −$414
- Net cashflow
- $776
Break-even live
2-unit breakdown (identical units grouped — click to expand)
| Units | Beds | Baths | Est. rent |
|---|---|---|---|
| 2× units | 2 | — | $1,970 |
| #1 | 2 | — | $985 |
| #2 | 2 | — | $985 |
| Total (2 units) | $1,970 | ||
UW: 25.0% down · 7.5% · 30yr · 1.5% tax · 5.0% vac · 8.0% maint · 8.0% mgmt
Financing live
Cash to close
- Down payment
- $28,225
- Closing costs
- $3,387
- Reserves months
- —
- Total cash needed
- —
Loan-product check · same deal, 3 products live
Conventional
25% down · 7.5% · 30yr
- Down + closing
- —
- Monthly P&I
- —
- Monthly cashflow
- —
- DSCR
- —
- Eligible?
- —
Personal DTI + credit; lowest rate.
DSCR
20% down · 8.5% · 30yr
- Down + closing
- —
- Monthly P&I
- —
- Monthly cashflow
- —
- DSCR
- —
- Eligible?
- —
No personal income docs; deal must DSCR.
Hard money
10% down · 12.0% · 12mo
- Down + closing
- —
- Monthly P&I
- —
- Monthly cashflow
- —
- DSCR
- —
- Eligible?
- —
Short-term bridge; refi at stabilization.
Rent comps 6 comps
| Address | Beds | Baths | Sqft | Rent | $/sqft | DOM | Units | Dist |
|---|---|---|---|---|---|---|---|---|
| 1728 Walnut St Anderson, IN | 3.0 | 2.0 | 2484 | $1,295 | $0.52 | 23d | 1 | 0.18mi |
| 2233 Fairview St Anderson, IN | 3.0 | 1.5 | 1452 | $1,195 | $0.82 | 23d | 1 | 0.68mi |
| 228 E 29th St Anderson, IN | 3.0 | 2.0 | 1440 | $1,295 | $0.90 | 4d | 1 | 0.73mi |
| 921 W 9th St Anderson, IN | 3.0 | 2.0 | 1611 | $1,375 | $0.85 | 23d | 1 | 1.00mi |
| 510 W 5th St Anderson, IN | 3.0 | 1.5 | 1617 | $995 | $0.62 | 43d | 1 | 1.05mi |
| 1121 Victory Ct Anderson, IN | 3.0 | 1.0 | 2053 | $1,295 | $0.63 | 21d | 1 | 1.22mi |
Listing history 13 events
-
2026-06-16days on market $112,900 Active 57 DOM
-
2026-06-15days on market $112,900 Active 56 DOM
-
2026-06-13days on market $112,900 Active 54 DOM
-
2026-06-09days on market $112,900 Active 50 DOM
-
2026-06-08days on market $112,900 Active 49 DOM
-
2026-06-07days on market $112,900 Active 48 DOM
-
2026-06-05days on market $112,900 Active 45 DOM
-
2026-06-03days on market $112,900 Active 44 DOM
-
2026-06-02days on market $112,900 Active 43 DOM
-
2026-06-01days on market $112,900 Active 42 DOM
-
2026-05-31days on market $112,900 Active 41 DOM
-
2026-04-17$112,900 Active 1083-char remark
Show marketing remark (1083 chars)
This package features six consistently high-demand rental duplex properties (12 units) situated in the Anderson, IN market. The portfolio offers a secure, well-managed investment with immediate upside potential. Stable Income Stream: The properties demonstrate strong, reliable cash flow, supported by excellent historical rent collection and exceptional occupancy rates (minimal historical vacancy). Turnkey Efficiency: Current owners have meticulously maintained the units, significantly minimizing the need for immediate Capital Expenditure (CapEx). Value-Add Opportunity: Current rents are below prevailing market rates for comparable local properties, providing a clear path for substantial income growth through gradual rent increases to achieve market value. Tenant Stability: Due to diligent maintenance, the properties have high long-term tenant satisfaction, contributing to low turnover. Seller will sell individually or as a group-addresses: 403-405 W 5th St, 1105-1107 W 11th St, 1109-1111 W 11th St, 1303-1305 Sycamore, 615-615 1/2 Madison and 1815 - 1815 1/2 Fletcher.
-
2026-04-17$112,900 Active
Show marketing remark (1083 chars)
This package features six consistently high-demand rental duplex properties (12 units) situated in the Anderson, IN market. The portfolio offers a secure, well-managed investment with immediate upside potential. Stable Income Stream: The properties demonstrate strong, reliable cash flow, supported by excellent historical rent collection and exceptional occupancy rates (minimal historical vacancy). Turnkey Efficiency: Current owners have meticulously maintained the units, significantly minimizing the need for immediate Capital Expenditure (CapEx). Value-Add Opportunity: Current rents are below prevailing market rates for comparable local properties, providing a clear path for substantial income growth through gradual rent increases to achieve market value. Tenant Stability: Due to diligent maintenance, the properties have high long-term tenant satisfaction, contributing to low turnover. Seller will sell individually or as a group-addresses: 403-405 W 5th St, 1105-1107 W 11th St, 1109-1111 W 11th St, 1303-1305 Sycamore, 615-615 1/2 Madison and 1815 - 1815 1/2 Fletcher.
ⓘ Source: listings_history table (triggers on properties + properties_extension) + one-shot
backfill from property_details.listing_events for pre-trigger history.
Climate risk First Street
- Flood 1/10 Low FEMA zone X (unshaded) · 0% chance over 30 yrs
- Wildfire 1/10 Low
- Heat 3/10 Moderate 7 d/yr ≥100°F today · 18 d/yr by 30 yrs out
- Wind 2/10 Low
- Air quality 3/10 Moderate 2 unhealthy d/yr today · 3 by 30 yrs out
Nearby sold comps map
Loading sold comps map…
Walkable amenities ~0.75 mi
Loading nearby amenities…
Taxation est. · year 1
- Rental income
- $23,640
- − Mortgage interest
- −$6,324
- − Property taxes
- −$1,694
- − Insurance
- −$564
- − Repairs & maintenance
- −$1,891
- − Management
- −$1,891
- − Depreciation
- −$3,284
- Taxable income
- $7,991
- Est. tax owed @ 24.0%
- −$1,918
- After-tax cash flow
- $7,395/yr
For passive investors: Depreciation is non-cash, so a rental often shows a tax loss while cash-flowing — sheltering income. Rental losses are passive: they offset passive income freely, and up to $25,000/yr can offset ordinary (W-2) income if you actively participate and your MAGI is under $100k (phasing out to $0 by $150k); unused losses carry forward. On sale, claimed depreciation is recaptured at up to 25%, and gains may owe capital-gains tax (a 1031 exchange can defer both). Figures are a year-1 estimate at your 24.0% rate — not tax advice; consult a CPA.
Condition & rehab AI · 12 photos
This property requires moderate renovations and maintenance to improve its condition and appeal. Deep cleaning, decluttering, and landscaping improvements would significantly enhance its resale and rental value.
Repairs flagged
- Minor porch flooring — Porch flooring appears to have some cracks and wear.
- Minor landscaping — Overgrown areas and debris on the porch and driveway need attention.
- Minor kitchen and bathroom clutter — Clutter on countertops and shelves in both areas needs to be cleared for a more inviting appearance.
Value-add opportunities
- Both Deep cleaning and decluttering — This would improve the home's appearance and make it more appealing to potential buyers or renters.
- Both Landscaping and curb appeal improvements — Enhancing the exterior would increase the home's curb appeal and attract more interest.
- Both Porch flooring repair — Repairing the porch flooring would improve the home's overall condition and make it more inviting for potential buyers or renters.
Renovation cost estimate screening
| Repair item | Severity | Est. cost |
|---|---|---|
| porch flooring · Porch flooring appears to have some cracks and wear. | Minor | $500–3,000 |
| landscaping · Overgrown areas and debris on the porch and driveway need attention. | Minor | $500–3,000 |
| kitchen and bathroom clutter · Clutter on countertops and shelves in both areas needs to be cleared for a more inviting appearance. | Minor | $500–3,000 |
| Total estimated repair cost · 3 items | $1,500–9,000 |
Value-add ROI direction
- Both Deep cleaning and decluttering — This would improve the home's appearance and make it more appealing to potential buyers or renters. ↑
- Both Landscaping and curb appeal improvements — Enhancing the exterior would increase the home's curb appeal and attract more interest. ↑
- Both Porch flooring repair — Repairing the porch flooring would improve the home's overall condition and make it more inviting for potential buyers or renters. ↑
ⓘ Cost ranges are severity-bucket heuristics (US national rule-of-thumb). Get contractor quotes + a written scope before underwriting a rehab budget.
Schools (NCES district)
- District
- Anderson Community School Corporation
- NCES district ID
- 1800150
- Math proficiency
- 15% ▼ -14.00%
- Reading proficiency
- 23% ▼ -7.00%
- Median HH income
- $38,208
- Composite
- 15.93/100
- National rank
- #9250
- State rank
- #280 of 301 in IN
Livability — Anderson
- Score
- 60/100
- State rank
- #521
- US rank
- #18709
Category grades
Schools grade is shown separately in the Schools card above.
Census & demographics
- Census place
- Anderson, IN
- County
- Madison County · 69,445 people
- City population
- 57,762
- Metro
- Indianapolis-Carmel-Anderson, IN
- Population (ZIP)
- 17,834
- Household income
- $36,029
- Rent vs Own
- Severe rent burden
- 1193.0
Population outlook (Madison County) Hauer SSP2
- Today (2025)
- 125,800 people
- By 2030
- 122,640 · -2.5%
- By 2040
- 115,420 · -8.3%
- By 2050
- 108,148 · -14.0%
- By 2075
- 91,838 · -27.0%
- By 2100
- 75,670 · -39.8%
Race, ethnicity, and origin ACS 2023
- Neighborhood character
- Diverse neighborhood (Simpson 0.58)
- Race & ethnicity
- White 61% Black 18% Hispanic / Latino 13% Two or more races 11% Native American 1%
- Hispanic origin (detail)
- Mexican 10% Puerto Rican 1%
- Common ancestry
- Italian 2% Slovak 1% Iranian 1%
- Foreign-born
- 4% · Canada
- Languages at home
- 86% English-only · Spanish 12%
Political lean MEDSL · Madison
- 2024 margin
- Strong R (+26.9) · D 35.6% · R 62.5% · Other 1.9%
- 2008→2024 swing
- -33.5pp toward R · 2008: 6.5pp · 2024: -26.9pp
- All cycles
- 2024: R+26.9 2020: R+22.6 2016: R+25.7 2012: R+4.5 2008: D+6.5
Not yet ingested
- Civics
- —
Market trends
- HPI YoY
- ▼ -11.12%
- Current HPI
- 302.7437
- Rent YoY
- ▲ 7.88%
- Metro
- Indianapolis-Carmel-Anderson, IN
- State GDP YoY
- ▲ 2.90%
- F500 in state
- 18
Industry mix (Fortune 500 HQ in IN)
| Industry | F500 HQs | Revenue |
|---|---|---|
| Industrial Machinery | 2 | $37B |
|
||
| Healthcare | 1 | $177B |
|
||
| Pharmaceuticals | 1 | $45B |
|
||
| Metals / Steel | 1 | $18B |
|
||
| Agriculture | 1 | $17B |
|
||
| Packaging | 1 | $12B |
|
||
Price history
+0.0% since first listed2 events — show timeline
- 2026-04-17 Listed $112,900 MIBOR as Distributed by MLS Grid
- 2026-04-17 Listed $112,900 IRMLS
Cash-flow waterfall
monthlySold comps — $/sqft
last 12 mo · ≤1 miLoading sold comps…