5301 West Ln · McCullom Lake, IL
Flood risk 1/10 · Minimal
- FEMA flood zone
- X (unshaded)
- Chance of flooding over 30 yrs
- 0.0%
- Est. flood insurance / yr
- $473 – $860
Fire risk 1/10 · Minimal
- Est. fire insurance / yr
- $804 – $1,492
Heat risk 2/10 · Minimal
- Hot days now (above 100°F)
- 7 days/yr
- Hot days in 30 yrs
- 14 days/yr
Wind risk 2/10 · Minimal
- Chance of severe wind over 30 yrs
- —
Air-quality risk 2/10 · Minimal
- Unhealthy air days now
- 1 days/yr
- Unhealthy air days in 30 yrs
- 1 days/yr
Risk factors via First Street. Map © Google.
Why this score? — see what drove the D grade
The composite is a weighted blend of 9 inputs, each scored 0–100. Each bar is that input's sub-score; the figure is the points it added to the 100-point composite (weight × sub-score).
- Cash flow +14.6/30.0
- ARV discount +7.5/15.0
- 1% rule +4.5/10.0
- DSCR +4.4/10.0
- Livability +3.5/5.0
- Schools +2.7/10.0
- Rent growth +2.5/5.0
- Condition / age +2.5/5.0
- Appreciation +0.0/10.0
$145,000
🖨 Deal sheet (PDF) 📄 Offer letter ✓ Due diligence
Listing remarks
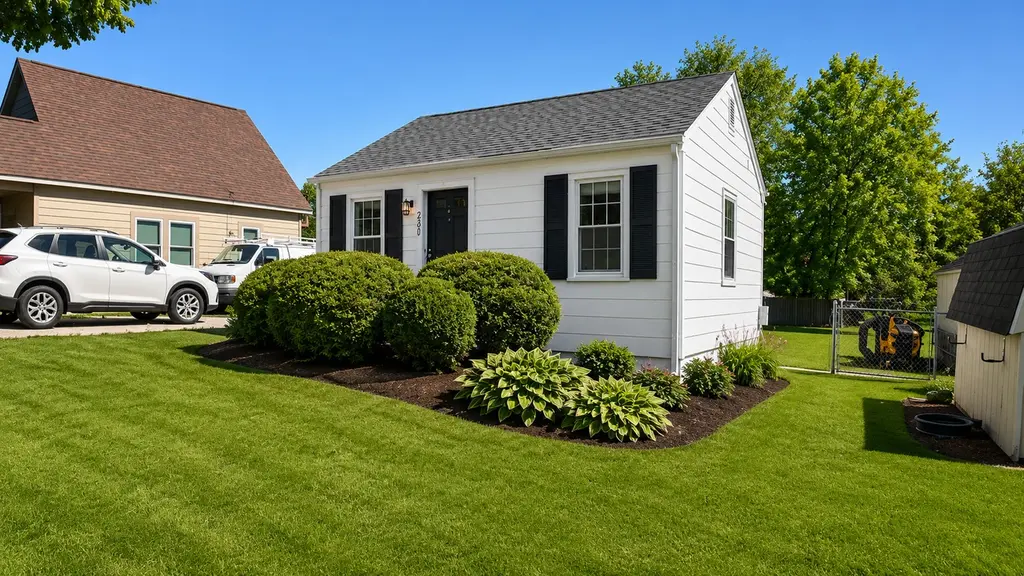
Beautifully updated ranch home in the heart of McCullom Lake offering affordable living with modern updates throughout. This move-in-ready 1-bedroom, 1-bath home features a remodeled kitchen completed in 2026 with stainless steel appliances, updated bathroom remodel in 2026, and brand-new flooring installed in 2026. Major exterior improvement includes a newer roof completed in 2023. The home also offers a full basement with washer and dryer, mechanicals, abundant storage space, and a convenient walk-out entrance. Situated on a spacious lot in a quiet lake community near McHenry shopping, restaurants, parks, and commuter routes. Ideal opportunity for owner-occupants, downsizers, or investors
Key facts
- Newer roof
- Remodeled kitchen
- Full basement
Tags
Property features AI
Finance
- Other: Possession at closing
- HOA & community: No master association fee required
Exterior
- Parking: 2 owned parking spaces
- Utilities: Public water; Public sewer
- Home design: Detached single-family home; One-story; Fee simple ownership; Rehab scheduled/completed in 2026; Built 81–90 years ago; Built before 1978
- Construction: Aluminum siding construction; Unfinished basement (440 sq ft total finished/unfin area reported)
- Exterior features: Lot dimensions about 48 x 116; Lot approximately 0.25–0.49 acre; Aluminum siding
Interior
- Kitchen: Kitchen on main level (approx. 16 x 9)
- Bedrooms: 1 bedroom (master on main); Additional bedroom spaces noted
- Flooring: Laminate flooring in master bedroom
- Bathrooms: 1 full bathroom
- Heating & cooling: Natural gas heating
- Interior features: 3 total rooms; Unfinished full basement; Disability access
- Laundry & utility: Laundry room in basement (approx. 15 x 15)
Neighborhood map
What this means for you Summary
Snapshot
- This is a 1-bed/1.0-bath single-family listed at $145k.
Deal economics
- At list price, monthly cash flow is $33 ($399/yr) — positive.
- The deal already cash-flows at list — no discount required.
- To meet the 1% rule (rent ≥ 1% of price), the offer needs to be $138k (4.6% below list).
- Recommended offer: $138k (4.6% below list) — sets the bar for 1% rule.
Location & tenants
- Location reads 70/100 on livability (#369 in IL) — a middle-class / working-renter tenant base. Strengths: crime A+, cost of living A+, housing A+; Watch: amenities F, commute F.
- Mchenry Chsd 156 (suburban): math 27% / reading 30% proficiency, ranked #244 of 620 in IL (top 39%) — low school quality limits family demand, transient renter base, plan for 1-2y turnover.
- Zoned schools: Valley View Elem School (math 21% / reading 31%, grade F, #824 of 2,056 statewide, top 40%, 539 students, 0% FRL); Parkland School (math 17% / reading 18%, grade F, #450 of 665 statewide, top 69%, 680 students, 0% FRL); Mchenry Community High School (2,222 students, 0% FRL).
- Market conditions: 105 active listings in the ZIP; solid renter incomes; 1,595 units permitted in McHenry County in 2024 (485 in 5+ unit buildings).
Forward outlook
- Local home prices are declining (-3.0%/yr); year-one equity from $1k of loan paydown is wiped out by about $4k of value loss. Plan a longer hold.
- McHenry County population projected at -12% by 2050 — secular population decline; favor cash flow + early exit over multi-decade hold.
Negotiation context
- It's been on market 34 days — a 3% lower offer ($141k) is reasonable based on typical stale-listing flexibility.
- Current owner paid $56k; list at $145k implies a 157% gain — meaningful room to come down on a strong offer.
Risks & watch-outs
- Watch-outs: built in 1937 — expect roof / HVAC / electrical / plumbing capex.
Questions for the listing agent
- It's been on market 34 days. Have you received any prior offers? Is the seller open to a 5% concession, seller financing, or rate buy-down credit?
- Built in 1937 — when were the roof, HVAC, electrical panel, plumbing, and water heater last replaced?
- Is there a deadline driving the sale (1031 exchange, divorce, estate, relocation)? That informs how much negotiation room exists.
- Schools are F-rated, which usually means shorter tenancies and higher turnover. Who's the typical renter profile here, and what's been the actual vacancy rate?
- The area grade is low — what's the realistic commute time and amenity access for the typical tenant pool here? Any planned neighborhood developments (good or bad) we should know about?
- What's the average days-on-market for RENTAL listings here right now (not sales)? A rising rental-DOM trend means longer vacancies and softer asking-rent achievability than the comps imply.
- What's the recent tenant-quality profile in this submarket — average credit score on applications, eviction rate, late-payment / NSF rate, and stable-employment percentage? A property-management company in the area should have these aggregated.
- How much new for-sale + rental construction is in the pipeline within 1–3 miles? Heavy new supply typically softens prices + rents 12–24 months out; constrained supply supports both.
Investment metrics
- 1% rule
- 0.95% ✗
- Cap rate
- 6.57%
- Cash-on-cash
- 0.98%
- DSCR
- 1.04
- GRM
- 8.7
CMA / ARV
No comps found within radius.
Projected returns pro-forma
-3.0% appreciation · 3.0% rent growth · sell at horizon
- IRR
- -14.7%
- Equity multiple
- 0.47×
- Total profit
- $-21,320
- Equity at exit
- $21,620
- IRR
- -5.9%
- Equity multiple
- 0.62×
- Total profit
- $-15,607
- Equity at exit
- $12,537
Cash invested: $40,600 (down + closing). Projections, not guarantees.
Landlord ↔ Tenant lean methodology
- Overall (STATE)
- 43 Moderately Tenant-Leaning
- State Illinois
- 43 Moderately Tenant-Leaning · D+7
- County
- — inherits STATE
- City
- — inherits STATE
ZIP-level market 60050
- Active inventory
- 105
- Price-to-rent
- 8.7×
Monthly cashflow live
- Estimated rent
- $1,384 medium interval (Pro) →
- Mortgage (P&I)
- −$760
- Tax from tax record
- −$239 /mo · $2,868/yr
- Insurance
- −$60
- HOA
- −$0
- Vacancy / Maint / Mgmt
- −$291
- Net cashflow
- $33
Break-even live
Sensitivity live
| Price | -10% $115 | -5% $74 | +0% $33 | +5% $-8 | +10% $-49 |
|---|---|---|---|---|---|
| Rent | -10% $-76 | -5% $-21 | +0% $33 | +5% $88 | +10% $143 |
| Rate | -1.0pp $106 | -0.5pp $70 | base $33 | +0.5pp $-4 | +1.0pp $-43 |
UW: 25.0% down · 7.5% · 30yr · 1.5% tax · 5.0% vac · 8.0% maint · 8.0% mgmt
Financing live
Cash to close
- Down payment
- $36,250
- Closing costs
- $4,350
- Reserves months
- —
- Total cash needed
- —
Loan-product check · same deal, 3 products live
Conventional
25% down · 7.5% · 30yr
- Down + closing
- —
- Monthly P&I
- —
- Monthly cashflow
- —
- DSCR
- —
- Eligible?
- —
Personal DTI + credit; lowest rate.
DSCR
20% down · 8.5% · 30yr
- Down + closing
- —
- Monthly P&I
- —
- Monthly cashflow
- —
- DSCR
- —
- Eligible?
- —
No personal income docs; deal must DSCR.
Hard money
10% down · 12.0% · 12mo
- Down + closing
- —
- Monthly P&I
- —
- Monthly cashflow
- —
- DSCR
- —
- Eligible?
- —
Short-term bridge; refi at stabilization.
Listing history 20 events
-
2026-06-21days on market $145,000 Active 34 DOM
-
2026-06-18price $145,000 Active 31 DOM
-
2026-06-18days on market $150,000 Active 31 DOM
-
2026-06-17days on market $150,000 Active 30 DOM
-
2026-06-16days on market $150,000 Active 29 DOM
-
2026-06-15days on market $150,000 Active 28 DOM
-
2026-06-13days on market $150,000 Active 26 DOM
-
2026-06-13days on market $150,000 Active 25 DOM
-
2026-06-09days on market $150,000 Active 22 DOM
-
2026-06-08days on market $150,000 Active 21 DOM
-
2026-06-07days on market $150,000 Active 20 DOM
-
2026-06-04days on market $150,000 Active 17 DOM
-
2026-06-03days on market $150,000 Active 16 DOM
-
2026-06-02days on market $150,000 Active 15 DOM
-
2026-06-01days on market $150,000 Active 14 DOM
-
2026-05-31days on market $150,000 Active 13 DOM
-
2026-05-22historical Contingent - Continue to Show
-
2002-01-10soldstatus $56,500
-
1993-02-01soldstatus $50,500
-
1989-12-11soldstatus $36,000
ⓘ Source: listings_history table (triggers on properties + properties_extension) + one-shot
backfill from property_details.listing_events for pre-trigger history.
Tax reassessment forecast IL · Partial reset (capped growth)
- Current annual tax
- $2,868 · $239/mo
- Projected year-2 tax
- $3,080 · $257/mo
- Expected delta
- +$212/yr (+$18/mo · 7.4%)
ⓘ Screening estimate from a state-policy table — verify with the county assessor before closing.
Climate risk First Street
- Flood 1/10 Low FEMA zone X (unshaded) · 0% chance over 30 yrs
- Wildfire 1/10 Low
- Heat 2/10 Low 7 d/yr ≥100°F today · 14 d/yr by 30 yrs out
- Wind 2/10 Low
- Air quality 2/10 Low 1 unhealthy d/yr today · 1 by 30 yrs out
Nearby sold comps map
Loading sold comps map…
Walkable amenities ~0.75 mi
Loading nearby amenities…
Taxation est. · year 1
- Rental income
- $16,604
- − Mortgage interest
- −$8,122
- − Property taxes
- −$2,868
- − Insurance
- −$725
- − Repairs & maintenance
- −$1,328
- − Management
- −$1,328
- − Depreciation
- −$4,218
- Taxable loss
- −$1,986
- Est. tax savings @ 24.0%
- +$477
- After-tax cash flow
- $876/yr
For passive investors: Depreciation is non-cash, so a rental often shows a tax loss while cash-flowing — sheltering income. Rental losses are passive: they offset passive income freely, and up to $25,000/yr can offset ordinary (W-2) income if you actively participate and your MAGI is under $100k (phasing out to $0 by $150k); unused losses carry forward. On sale, claimed depreciation is recaptured at up to 25%, and gains may owe capital-gains tax (a 1031 exchange can defer both). Figures are a year-1 estimate at your 24.0% rate — not tax advice; consult a CPA.
Schools (NCES district)
- District
- Mchenry Chsd 156
- NCES district ID
- 1725320
- Math proficiency
- 27% ▼ -7.00%
- Reading proficiency
- 30% ▼ -7.00%
- Median HH income
- $66,681
- Composite
- 26.55/100
- National rank
- #7188
- State rank
- #244 of 620 in IL
Livability — McCullom Lake
- Score
- 70/100
- State rank
- #369
- US rank
- #7652
Category grades
Schools grade is shown separately in the Schools card above.
Census & demographics
- Census place
- McCullom Lake, IL
- County
- McHenry County · 204,279 people
- Metro
- Chicago-Naperville-Elgin, IL-IN-WI
- Population (ZIP)
- 31,781
- Household income
- $88,812
- Rent vs Own
- Severe rent burden
- 570.0
Population outlook (McHenry County) Hauer SSP2
- Today (2025)
- 305,342 people
- By 2030
- 301,491 · -1.3%
- By 2040
- 288,211 · -5.6%
- By 2050
- 268,430 · -12.1%
- By 2075
- 226,209 · -25.9%
- By 2100
- 181,247 · -40.6%
Race, ethnicity, and origin ACS 2023
- Neighborhood character
- Predominantly White (79%)
- Race & ethnicity
- White 79% Hispanic / Latino 16% Two or more races 9% Asian 2%
- Hispanic origin (detail)
- Mexican 14%
- Common ancestry
- Romanian 12% Portuguese 2% Lithuanian 2%
- Foreign-born
- 8% · Canada, Vietnam
- Languages at home
- 85% English-only · Spanish 10% Russian/Polish/Slavic 2% German/W. Germanic 1%
Political lean MEDSL · McHenry
- 2024 margin
- Lean R (+5.3) · D 46.6% · R 51.9% · Other 1.5%
- 2008→2024 swing
- -10.6pp toward R · 2008: 5.3pp · 2024: -5.3pp
- All cycles
- 2024: R+5.3 2020: R+2.5 2016: R+8.1 2012: R+8.8 2008: D+5.3
Not yet ingested
- Civics
- —
Market trends
- HPI YoY
- ▼ -198.11%
- Current HPI
- 207.8921
- Rent YoY
- —
- Metro
- Chicago-Naperville-Elgin, IL-IN-WI
- State GDP YoY
- ▲ 1.59%
- F500 in state
- 60
Industry mix (Fortune 500 HQ in IL)
| Industry | F500 HQs | Revenue |
|---|---|---|
| Insurance | 4 | $201B |
|
||
| Consumer Goods | 4 | $87B |
|
||
| Industrial Machinery | 3 | $64B |
|
||
| Healthcare | 2 | $55B |
|
||
| Retail / Pharmacy | 1 | $148B |
|
||
| Agriculture / Food | 1 | $86B |
|
||
Price history
+56.9% since first listed4 events — show timeline
- 2026-05-22 Contingent — MRED as Distributed by MLS Grid
- 2002-01-10 Sold (Public Records) $56,500 Public Records
- 1993-02-01 Sold (Public Records) $50,500 Public Records
- 1989-12-11 Sold (Public Records) $36,000 Public Records
Property tax history
+2.5%/yrLatest (2024): $2,868 · +2.4% YoY. Source: county tax records.
Cash-flow waterfall
monthlySold comps — $/sqft
last 12 mo · ≤1 miLoading sold comps…