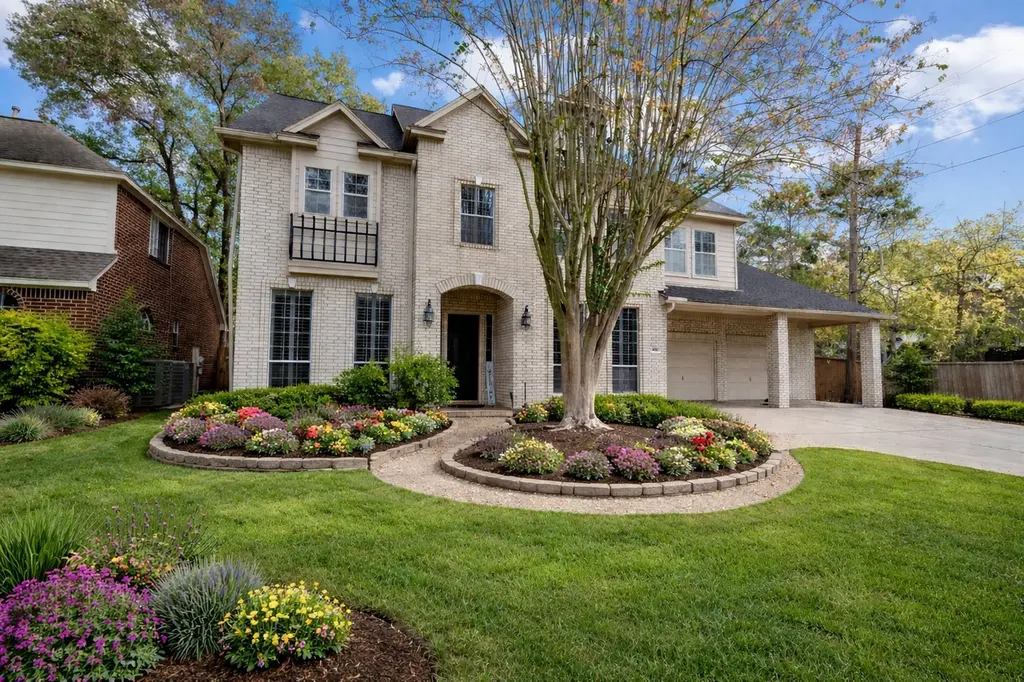
14210 Reissen Ln · Houston, TX
Flood risk 1/10 · Minimal
- FEMA flood zone
- X (unshaded)
- Chance of flooding over 30 yrs
- 0.0%
- Est. flood insurance / yr
- $507 – $1,088
Fire risk 1/10 · Minimal
- Est. fire insurance / yr
- $1,222 – $2,270
Heat risk 9/10 · Severe
- Hot days now (above 111°F)
- 7 days/yr
- Hot days in 30 yrs
- 23 days/yr
Wind risk 8/10 · Major
- Chance of severe wind over 30 yrs
- 99.0%
Air-quality risk 3/10 · Minor
- Unhealthy air days now
- 3 days/yr
- Unhealthy air days in 30 yrs
- 3 days/yr
Risk factors via First Street. Map © Google.
Why this score? — see what drove the D grade
The composite is a weighted blend of 9 inputs, each scored 0–100. Each bar is that input's sub-score; the figure is the points it added to the 100-point composite (weight × sub-score).
- ARV discount +14.7/15.0
- Cash flow +5.0/30.0
- Appreciation +4.5/10.0
- Schools +4.4/10.0
- Livability +3.7/5.0
- Rent growth +3.4/5.0
- Condition / age +2.5/5.0
- 1% rule +2.0/10.0
- DSCR +0.0/10.0
$385,000
🖨 Deal sheet 📄 Offer letter ✓ Due diligence
Listing remarks MLS
Great home with great floor plan and wonderful location! Open concept kitchen/dining & family room. Living room, dining room, 1/2 bath and pantry all complete the first floor. This home has a ton of storage with 5 large walk-in closets and a oversized garage. Four bedrooms, 3 full baths and 2 1/2 baths are spread out throughout the home. Primary bedroom has 2 walk-in closets. Large utility room on the second floor with washer and dryer. The 3rd floor is a great addition for an office, workout room or playroom. Roof was replaced in 2021 and HVAC for the 1st floor. French drain system and gutters in the rear of the home and irrigation system.
Key facts
- Third floor addition
- French drain system
- Oversized garage
Tags
Neighborhood map
What this means for you Summary
Snapshot
- This is a 4-bed/4.0-bath single-family listed at $385k.
Deal economics
- At list price, monthly cash flow is $-910 ($-11k/yr) — negative.
- To cash-flow at today's rent, offer at most $224k (41.8% below list).
- To meet the 1% rule (rent ≥ 1% of price), the offer needs to be $271k (29.6% below list).
- Recommended offer: $224k (41.8% below list) — sets the bar for cash-flow.
Location & tenants
- Location reads 74/100 on livability (#184 in TX, #4,771 nationally) — a middle-class / working-renter tenant base. Strengths: amenities A+, cost of living A+, housing A+; Watch: schools D, crime F.
- Cypress-Fairbanks ISD (suburban): math 45% / reading 52% proficiency, ranked #161 of 826 in TX (top 20%) — families likely to look elsewhere, expect single-tenant / working-renter base with shorter leases.
- Market conditions: Rents rising (+3.5%/yr); 187 active listings in the ZIP; 2 comparable units currently listed for rent nearby; solid renter incomes; 29,883 units permitted in Harris County in 2024 (8,621 in 5+ unit buildings).
- This rent runs 41% of the median local income ($80k/yr) — at the standard rent-burdened threshold; future hikes will face affordability resistance.
Forward outlook
- Local home prices are declining (-1.1%/yr); year-one equity from $3k of loan paydown is wiped out by about $4k of value loss. Plan a longer hold.
- Harris County population projected at +47% by 2050 — long-run rental-demand tailwind backs the buy-and-hold thesis.
Negotiation context
- It's been on market 139 days — a 12% lower offer ($339k) is reasonable based on typical stale-listing flexibility.
- 8 sale attempts since 25y ago with the ask held roughly flat each time — persistent listings suggest the price (not the market) is what's stuck; bring a comps-based counter.
Risks & watch-outs
- Climate carrying-cost: severe wind risk, 99% chance of damaging wind over 30y; extreme-heat days projected 7→23/yr by 2055 (HVAC capex compounding) — expect insurance premiums to compound above CPI over the hold.
Questions for the listing agent
- What do current leases actually rent for vs. the listed asking? Can we see a recent rent roll and the last 12 months of T-12 income?
- It's been on market 139 days. Have you received any prior offers? Is the seller open to a 42% concession, seller financing, or rate buy-down credit?
- What does the HOA fee cover, when was the last increase, and are there any pending special assessments or reserve-fund shortfalls?
- Why hasn't it sold? Are there any deal-killer items the seller is aware of (foundation, flood, title, zoning, code violations)?
- Is there a deadline driving the sale (1031 exchange, divorce, estate, relocation)? That informs how much negotiation room exists.
- Schools are D-rated, which usually means shorter tenancies and higher turnover. Who's the typical renter profile here, and what's been the actual vacancy rate?
- Crime grade is F in this area — have there been break-ins, vandalism, or insurance claims at this property in the last 3 years? What carrier currently insures it and at what premium?
- The area grade is low — what's the realistic commute time and amenity access for the typical tenant pool here? Any planned neighborhood developments (good or bad) we should know about?
- What's the average days-on-market for RENTAL listings here right now (not sales)? A rising rental-DOM trend means longer vacancies and softer asking-rent achievability than the comps imply.
- What's the recent tenant-quality profile in this submarket — average credit score on applications, eviction rate, late-payment / NSF rate, and stable-employment percentage? A property-management company in the area should have these aggregated.
- How much new for-sale + rental construction is in the pipeline within 1–3 miles? Heavy new supply typically softens prices + rents 12–24 months out; constrained supply supports both.
Investment metrics
- 1% rule
- 0.70% ✗
- Cap rate
- 3.46%
- Cash-on-cash
- -10.13%
- DSCR
- 0.55
- GRM
- 11.8
CMA / ARV
- ARV (median comp)
- $458,264
- List price
- $385,000
- Delta
- -15.99%
- Verdict
- UNDERPRICED
- Comps
- 20 within 1.0 mi
Show comp detail 12 sales within ~0.75 mi
| Address | Dist | Beds/Ba | Sqft | Sold | Price | $/sf | Match |
|---|---|---|---|---|---|---|---|
| 6790 Rial Ct | 0.23mi | 4/3.5 | 3,180 (+1%) | 1mo | $490,000 | $154 | 85 |
| 14106 Haynes Dr | 0.16mi | 4/3.5 | 3,282 (+4%) | 1mo | $399,900 | $122 | 82 |
| 14210 Vanessa Cir | 0.08mi | 4/3.5 | 3,355 (+7%) | 2mo | $465,000 | $139 | 82 |
| 6782 Cutten Pkwy | 0.29mi | 4/3.5 | 3,285 (+5%) | 3mo | $405,000 | $123 | 74 |
| 6906 Cherry Hills Rd | 0.19mi | 5/3.5 (+1) | 3,480 (+11%) | 4mo | $410,000 | $118 | 62 |
| 6203 Bermuda Dunes Dr | 0.63mi | 4/2.5 | 3,164 (+1%) | 2mo | $445,000 | $141 | 62 |
| 6622 Preston Trail Dr | 0.28mi | 3/2.0 (-1) | 2,930 (-7%) | 2mo | $252,000 | $86 | 61 |
| 7002 Briton Centre Ct | 0.71mi | 4/3.0 | 3,319 (+6%) | 1mo | $630,000 | $190 | 52 |
| 6719 Ashmore Dr | 0.71mi | 4/2.5 | 3,012 (-4%) | 4mo | $350,000 | $116 | 51 |
| 5906 Echo Lake Ln | 0.73mi | 5/3.5 (+1) | 3,340 (+6%) | 4mo | $455,000 | $136 | 45 |
| 6723 Ashmore Dr | 0.72mi | 4/3.5 | 3,574 (+14%) | 2mo | $415,500 | $116 | 40 |
| 6523 Cypress Point Dr | 0.66mi | 5/3.0 (+1) | 2,721 (-13%) | 4mo | $314,900 | $116 | 35 |
Match score weights: distance 35% · size 25% · config 20% · recency 20%. Top-matched comps best support the ARV.
Projected returns pro-forma
-1.09% appreciation · 3.55% rent growth · sell at horizon
- IRR
- -19.2%
- Equity multiple
- 0.19×
- Total profit
- $-86,818
- Equity at exit
- $91,196
- IRR
- -11.9%
- Equity multiple
- -0.05×
- Total profit
- $-113,178
- Equity at exit
- $94,289
Cash invested: $107,800 (down + closing). Projections, not guarantees.
Landlord ↔ Tenant lean methodology
- Overall (STATE)
- 87 Strongly Landlord-Friendly
- State Texas
- 87 Strongly Landlord-Friendly · R+5
- County
- — inherits STATE
- City
- — inherits STATE
ZIP-level market 77069
- Home prices YoY
- -0.5%
- Rents YoY
- 3.5%
- Active inventory
- 187
- Price-to-rent
- 11.8×
Monthly cashflow live
- Estimated rent
- $2,712 medium interval (Pro) →
- Mortgage (P&I)
- −$2,019
- Tax from tax record
- −$794 /mo · $9,530/yr
- Insurance
- −$160
- HOA
- −$79
- Vacancy / Maint / Mgmt
- −$569
- Net cashflow
- $-910
Break-even live
UW: 25.0% down · 7.5% · 30yr · 1.5% tax · 5.0% vac · 8.0% maint · 8.0% mgmt
Financing live
Cash to close
- Down payment
- $96,250
- Closing costs
- $11,550
- Reserves months
- —
- Total cash needed
- —
Loan-product check · same deal, 3 products live
Conventional
25% down · 7.5% · 30yr
- Down + closing
- —
- Monthly P&I
- —
- Monthly cashflow
- —
- DSCR
- —
- Eligible?
- —
Personal DTI + credit; lowest rate.
DSCR
20% down · 8.5% · 30yr
- Down + closing
- —
- Monthly P&I
- —
- Monthly cashflow
- —
- DSCR
- —
- Eligible?
- —
No personal income docs; deal must DSCR.
Hard money
10% down · 12.0% · 12mo
- Down + closing
- —
- Monthly P&I
- —
- Monthly cashflow
- —
- DSCR
- —
- Eligible?
- —
Short-term bridge; refi at stabilization.
Rent comps 2 comps
| Address | Beds | Baths | Sqft | Rent | $/sqft | DOM | Units | Dist |
|---|---|---|---|---|---|---|---|---|
| 5415 Olympia Fields Ln Houston, TX | 4.0 | 4.0 | 4163 | $3,500 | $0.84 | 3d | 1 | 1.37mi |
| 5135 Westerham Pl Unit 1262307P Houston, TX | 5.0 | 3.5 | 3358 | $17,582 | $5.24 | 22d | 1 | 1.46mi |
HOA detail
- Monthly dues
- $79 · $948/yr
Listing history 41 events
-
2026-06-18days on market $385,000 Active 139 DOM
-
2026-06-17days on market $385,000 Active 138 DOM
-
2026-06-16days on market $385,000 Active 137 DOM
-
2026-06-15days on market $385,000 Active 136 DOM
-
2026-06-13days on market $385,000 Active 134 DOM
-
2026-06-13days on market $385,000 Active 133 DOM
-
2026-06-09days on market $385,000 Active 130 DOM
-
2026-06-08days on market $385,000 Active 129 DOM
-
2026-06-07days on market $385,000 Active 128 DOM
-
2026-06-04days on market $385,000 Active 125 DOM
-
2026-06-03days on market $385,000 Active 124 DOM
-
2026-06-02days on market $385,000 Active 123 DOM
-
2026-06-02days on market $385,000 Active 122 DOM
-
2026-05-31days on market $385,000 Active 121 DOM
-
2026-01-30$385,000 Active 654-char remark
Show marketing remark (654 chars)
Great home with great floor plan and wonderful location! Open concept kitchen/dining & family room. Living room, dining room, 1/2 bath and pantry all complete the first floor. This home has a ton of storage with 5 large walk-in closets and a oversized garage. Four bedrooms, 3 full baths and 2 1/2 baths are spread out throughout the home. Primary bedroom has 2 walk-in closets. Large utility room on the second floor with washer and dryer. The 3rd floor is a great addition for an office, workout room or playroom. Roof was replaced in 2021 and HVAC for the 1st floor. French drain system and gutters in the rear of the home and irrigation system.
-
2026-01-30historical
Show marketing remark (654 chars)
Great home with great floor plan and wonderful location! Open concept kitchen/dining & family room. Living room, dining room, 1/2 bath and pantry all complete the first floor. This home has a ton of storage with 5 large walk-in closets and a oversized garage. Four bedrooms, 3 full baths and 2 1/2 baths are spread out throughout the home. Primary bedroom has 2 walk-in closets. Large utility room on the second floor with washer and dryer. The 3rd floor is a great addition for an office, workout room or playroom. Roof was replaced in 2021 and HVAC for the 1st floor. French drain system and gutters in the rear of the home and irrigation system.
-
2026-01-06price $390,000
-
2025-12-20$417,000 Active
-
2025-12-20historical
-
2025-12-20$430,000 Active
-
2022-02-01soldstatus
-
2022-01-31soldstatus Sold
-
2022-01-19status Pending
-
2022-01-11status Option Pending
-
2022-01-11status Pending
-
2022-01-06$427,000 Active
-
2013-02-14soldstatus
-
2013-02-14soldstatus
-
2013-02-12soldstatus Sold
-
2013-01-16status Pending
-
2013-01-10$264,900 Active
-
2013-01-02historical
-
2012-12-14price $264,900
-
2012-09-21$272,500 Active
-
2009-08-31soldstatus
-
2009-08-27soldstatus
-
2009-07-27historical
-
2009-07-22$264,900
-
2001-07-06historical
-
2001-04-02$274,900
-
2000-09-14soldstatus
ⓘ Source: listings_history table (triggers on properties + properties_extension) + one-shot
backfill from property_details.listing_events for pre-trigger history.
Tax reassessment forecast TX · Resets to sale price
- Current annual tax
- $9,530 · $794/mo
- Projected year-2 tax
- $9,530 · $794/mo
- Expected delta
- $0/yr ($0/mo · 0.0%)
ⓘ Screening estimate from a state-policy table — verify with the county assessor before closing.
Climate risk First Street
- Flood 1/10 Low FEMA zone X (unshaded) · 0% chance over 30 yrs
- Wildfire 1/10 Low
- Heat 9/10 Extreme 7 d/yr ≥111°F today · 23 d/yr by 30 yrs out
- Wind 8/10 Severe 99% chance of damaging wind over 30 yrs
- Air quality 3/10 Moderate 3 unhealthy d/yr today · 3 by 30 yrs out
Nearby sold comps map
Loading sold comps map…
Walkable amenities ~0.75 mi
Loading nearby amenities…
Taxation est. · year 1
- Rental income
- $32,538
- − Mortgage interest
- −$21,566
- − Property taxes
- −$9,530
- − Insurance
- −$1,925
- − Repairs & maintenance
- −$2,603
- − Management
- −$2,603
- − HOA
- −$948
- − Depreciation
- −$11,200
- Taxable loss
- −$17,836
- Est. tax savings @ 24.0%
- +$4,281
- After-tax cash flow
- $-6,644/yr
For passive investors: Depreciation is non-cash, so a rental often shows a tax loss while cash-flowing — sheltering income. Rental losses are passive: they offset passive income freely, and up to $25,000/yr can offset ordinary (W-2) income if you actively participate and your MAGI is under $100k (phasing out to $0 by $150k); unused losses carry forward. On sale, claimed depreciation is recaptured at up to 25%, and gains may owe capital-gains tax (a 1031 exchange can defer both). Figures are a year-1 estimate at your 24.0% rate — not tax advice; consult a CPA.
Schools (NCES district)
- District
- Cypress-Fairbanks ISD
- NCES district ID
- 4816110
- Math proficiency
- 45% ▼ -12.00%
- Reading proficiency
- 52% ▼ -2.00%
- Median HH income
- $72,025
- Composite
- 43.63/100
- National rank
- #2968
- State rank
- #161 of 826 in TX
Livability — Houston
- Score
- 74/100
- State rank
- #184
- US rank
- #4771
Category grades
Schools grade is shown separately in the Schools card above.
Census & demographics
- County
- Harris County · 4,702,590 people
- City population
- 3,226,434
- Metro
- Houston-The Woodlands-Sugar Land, TX
- Population (ZIP)
- 20,608
- Household income
- $80,257
- Rent vs Own
- Severe rent burden
- 1259.0
Population outlook (Harris County) Hauer SSP2
- Today (2025)
- 5,571,493 people
- By 2030
- 6,089,821 · +9.3%
- By 2040
- 7,142,806 · +28.2%
- By 2050
- 8,185,864 · +46.9%
- By 2075
- 10,574,329 · +89.8%
- By 2100
- 12,109,958 · +117.4%
Race, ethnicity, and origin ACS 2023
- Neighborhood character
- Diverse neighborhood (Simpson 0.69)
- Race & ethnicity
- White 43% Black 30% Hispanic / Latino 19% Two or more races 12% Asian 5%
- Hispanic origin (detail)
- Mexican 11% Puerto Rican 2% Salvadoran 2%
- Common ancestry
- Slovak 2% Lithuanian 2% Italian 2%
- Foreign-born
- 12% · Canada, Vietnam, Jamaica
- Languages at home
- 79% English-only · Spanish 14% Other Indo-European 2% German/W. Germanic 1%
Political lean MEDSL · Harris
- 2024 margin
- Lean D (+5.5) · D 52.0% · R 46.4% · Other 1.6%
- 2008→2024 swing
- +3.9pp toward D · 2008: 1.6pp · 2024: 5.5pp
- All cycles
- 2024: D+5.5 2020: D+13.3 2016: D+12.4 2012: D+0.1 2008: D+1.6
Not yet ingested
- Civics
- —
Market trends
- HPI YoY
- ▼ -1.09%
- Current HPI
- 201.0894
- Rent YoY
- ▲ 3.55%
- Metro
- Houston-The Woodlands-Sugar Land, TX
- State GDP YoY
- ▲ 3.95%
- F500 in state
- 110
Industry mix (Fortune 500 HQ in TX)
| Industry | F500 HQs | Revenue |
|---|---|---|
| Energy | 16 | $1,198B |
|
||
| Technology | 5 | $198B |
|
||
| Engineering / Construction | 4 | $72B |
|
||
| Energy Services | 3 | $60B |
|
||
| Utilities | 3 | $41B |
|
||
| Healthcare | 2 | $330B |
|
||
Price history
+40.1% since first listed27 events — show timeline
- 2026-01-30 Listing Removed — HARMLS
- 2026-01-30 Listed $385,000 HARMLS
- 2026-01-06 Price Changed $390,000 HARMLS
- 2025-12-20 Listed $430,000 HARMLS
- 2025-12-20 Listing Removed — HARMLS
- 2025-12-20 Listed $417,000 HARMLS
- 2022-02-01 Sold (Public Records) — Public Records
- 2022-01-31 Sold (MLS) — HARMLS
- 2022-01-19 Pending — HARMLS
- 2022-01-11 Pending — HARMLS
- 2022-01-11 Pending — HARMLS
- 2022-01-06 Listed $427,000 HARMLS
- 2013-02-14 Sold (Public Records) — Public Records
- 2013-02-14 Sold (Public Records) — Public Records
- 2013-02-12 Sold (MLS) — HARMLS
- 2013-01-16 Pending — HARMLS
- 2013-01-10 Listed $264,900 HARMLS
- 2013-01-02 Listing Removed — HARMLS
- 2012-12-14 Price Changed $264,900 HARMLS
- 2012-09-21 Listed $272,500 HARMLS
- 2009-08-31 Sold (Public Records) — Public Records
- 2009-08-27 Sold (MLS) — HARMLS
- 2009-07-27 Listing Removed — HARMLS
- 2009-07-22 Listed $264,900 HARMLS
- 2001-07-06 Listing Removed — HARMLS
- 2001-04-02 Listed $274,900 HARMLS
- 2000-09-14 Sold (Public Records) — Public Records
Property tax history
+6.2%/yrLatest (2024): $9,530 · +4.0% YoY. Source: county tax records.
Cash-flow waterfall
monthlySold comps — $/sqft
last 12 mo · ≤1 miLoading sold comps…