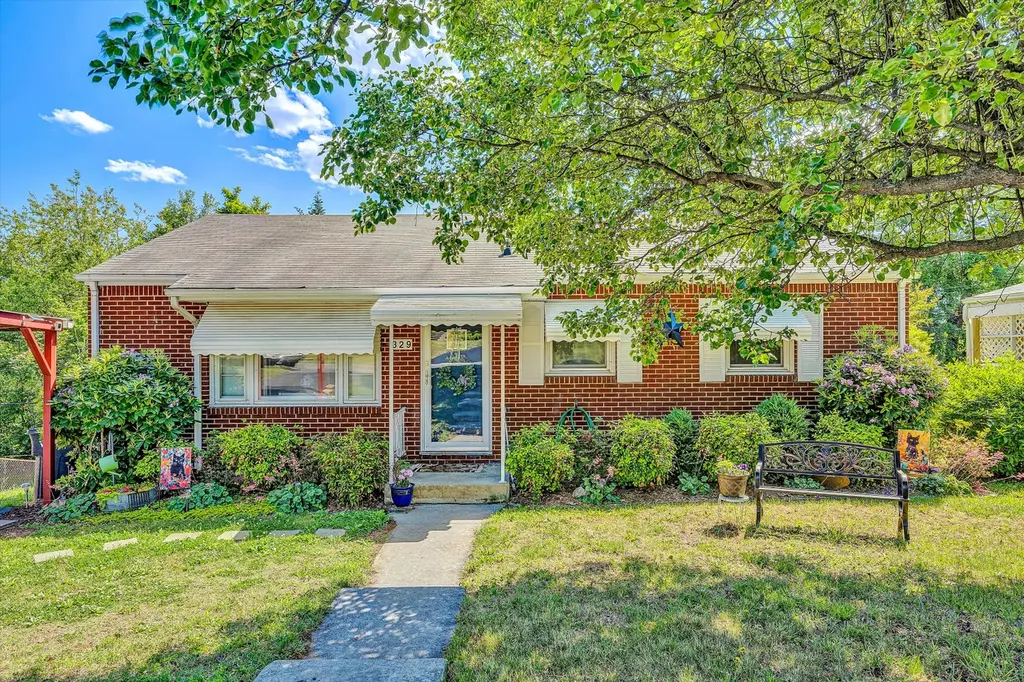
329 Lynn Haven Cir · Vinton, VA
Flood risk 1/10 · Minimal
- FEMA flood zone
- X (unshaded)
- Chance of flooding over 30 yrs
- 0.0%
- Est. flood insurance / yr
- $473 – $860
Fire risk 2/10 · Minimal
- Est. fire insurance / yr
- $666 – $1,236
Heat risk 5/10 · Moderate
- Hot days now (above 100°F)
- 7 days/yr
- Hot days in 30 yrs
- 19 days/yr
Wind risk 2/10 · Minimal
- Chance of severe wind over 30 yrs
- 1.0%
Air-quality risk 2/10 · Minimal
- Unhealthy air days now
- 1 days/yr
- Unhealthy air days in 30 yrs
- 1 days/yr
Risk factors via First Street. Map © Google.
Why this score? — see what drove the F grade
The composite is a weighted blend of 9 inputs, each scored 0–100. Each bar is that input's sub-score; the figure is the points it added to the 100-point composite (weight × sub-score).
- Schools +6.4/10.0
- Cash flow +6.0/30.0
- ARV discount +4.1/15.0
- Livability +4.0/5.0
- Rent growth +2.5/5.0
- Condition / age +2.5/5.0
- 1% rule +0.4/10.0
- DSCR +0.4/10.0
- Appreciation +0.0/10.0
$245,000
🖨 Deal sheet 📄 Offer letter ✓ Due diligence
Listing remarks MLS
NEW ROOF IN 2004-- NEW CENTRAL AIR IN 2001- HARD WOOD FLOORS THROUGH MOST OF THE HOUSE NICE LARGE DECK ON SIDE AND REAR ALL ON LIMITED ACCESS ST. TAXES AND SQ. FT. ESTIMATED BY AGT-CALL LA FOR ADD'L FORM
Key facts
- Inviting kitchen
- Serene outdoor haven
- Spacious living area
Tags
Property features AI
Finance
- Financial info: Annual tax amount listed
Exterior
- Utilities: Electric heat pump for heating and cooling
- Home design: Residential property; Built in 1960
- Construction: Year built: 1960
- Exterior features: One-acre lot
Interior
- Bedrooms: Three bedrooms (all on the main level)
- Flooring: Tile; Vinyl; Wood
- Bathrooms: One full bathroom (on the main level)
- Heating & cooling: Heat pump (electric) providing both heating and cooling
- Interior features: Tile, vinyl, and wood flooring
Neighborhood map
What this means for you Summary
Snapshot
- This is a 3-bed/1.0-bath single-family listed at $245k.
Deal economics
- At list price, monthly cash flow is $-464 ($-6k/yr) — negative.
- To cash-flow at today's rent, offer at most $163k (33.5% below list).
- To meet the 1% rule (rent ≥ 1% of price), the offer needs to be $133k (45.9% below list).
- Recommended offer: $133k (45.9% below list) — sets the bar for 1% rule.
Location & tenants
- Location reads 80/100 on livability (#61 in VA, #1,742 nationally) — a professional / high-income tenant draw. Strengths: cost of living A+, housing A+, health & safety A+; Watch: employment C-, amenities F, commute F.
- Roanoke County Public School District (suburban): math 71% / reading 78% proficiency, ranked #9 of 131 in VA (top 7%) — strong family-tenant draw, lease renewals of 3-5y typical.
- Zoned schools: Herman L. Horn Elementary (math 57% / reading 72%, grade B, #416 of 1,108 statewide, top 41%, 407 students, 72% FRL); William Byrd Middle (math 68% / reading 74%, grade A, #77 of 342 statewide, top 23%, 827 students, 42% FRL); William Byrd High (math 77% / reading 89%, grade A, #33 of 319 statewide, top 11%, 1,142 students, 38% FRL) — zoned schools average 51% FRL vs 22% district-wide (29 pts higher); higher-poverty schools than district average — tighter screening recommended.
- Market conditions: 158 active listings in the ZIP; 12 comparable units currently listed for rent nearby; rentals lingering (median 44d on market — plan ~5-8 weeks vacancy on turnover, expect pricing pressure); 50% of comp listings sitting > 30 days — soft ceiling on asking rent; 360 units permitted in Roanoke County in 2024 (228 in 5+ unit buildings).
Forward outlook
- Local home prices are declining (-3.0%/yr); year-one equity from $2k of loan paydown is wiped out by about $7k of value loss. Plan a longer hold.
- Roanoke County population projected at +5% by 2050 — modest demand growth; plan on rents tracking national, not racing it.
Negotiation context
- Only 5 days on market — expect competitive offers; lowballing is unlikely to land.
- 4 sale attempts since 22y ago with the ask held roughly flat each time — persistent listings suggest the price (not the market) is what's stuck; bring a comps-based counter.
- Current owner paid $111k; list at $245k implies a 121% gain — meaningful room to come down on a strong offer.
Risks & watch-outs
- Climate carrying-cost: extreme-heat days projected 7→19/yr by 2055 (HVAC capex compounding) — expect insurance premiums to compound above CPI over the hold.
Questions for the listing agent
- What do current leases actually rent for vs. the listed asking? Can we see a recent rent roll and the last 12 months of T-12 income?
- Built in 1960 — when were the roof, HVAC, electrical panel, plumbing, and water heater last replaced?
- Is there a deadline driving the sale (1031 exchange, divorce, estate, relocation)? That informs how much negotiation room exists.
- Schools are A-rated — typically a magnet for longer-tenancy family renters. What's the average tenant stay here, and is there a school-zone premium baked into asking?
- The area grade is low — what's the realistic commute time and amenity access for the typical tenant pool here? Any planned neighborhood developments (good or bad) we should know about?
- What's the average days-on-market for RENTAL listings here right now (not sales)? A rising rental-DOM trend means longer vacancies and softer asking-rent achievability than the comps imply.
- What's the recent tenant-quality profile in this submarket — average credit score on applications, eviction rate, late-payment / NSF rate, and stable-employment percentage? A property-management company in the area should have these aggregated.
- How much new for-sale + rental construction is in the pipeline within 1–3 miles? Heavy new supply typically softens prices + rents 12–24 months out; constrained supply supports both.
Investment metrics
- 1% rule
- 0.54% ✗
- Cap rate
- 4.02%
- Cash-on-cash
- -8.12%
- DSCR
- 0.64
- GRM
- 15.4
CMA / ARV
- ARV (on-the-fly)
- $228,000
- Comps found
- 2
Show comp detail 2 sales within ~0.75 mi
| Address | Dist | Beds/Ba | Sqft | Sold | Price | $/sf | Match |
|---|---|---|---|---|---|---|---|
| 742 Kenyon Rd | 0.61mi | 3/1.0 | 1,000 (+5%) | 17mo | $240,000 | $240 | 48 |
| 1117 Halliahurst Ave | 0.38mi | 3/2.0 | 1,092 (+15%) | 21mo | $239,950 | $220 | 36 |
Match score weights: distance 35% · size 25% · config 20% · recency 20%. Top-matched comps best support the ARV.
Projected returns pro-forma
-3.0% appreciation · 3.0% rent growth · sell at horizon
- IRR
- -30.6%
- Equity multiple
- -0.01×
- Total profit
- $-69,355
- Equity at exit
- $36,530
- IRR
- -33.3%
- Equity multiple
- -0.44×
- Total profit
- $-98,832
- Equity at exit
- $21,183
Cash invested: $68,600 (down + closing). Projections, not guarantees.
Landlord ↔ Tenant lean methodology
- Overall (STATE)
- 55 Moderately Landlord-Leaning
- State Virginia
- 55 Moderately Landlord-Leaning · D+2
- County
- — inherits STATE
- City
- — inherits STATE
ZIP-level market 24179
- Active inventory
- 158
- Price-to-rent
- 15.4×
Monthly cashflow live
- Estimated rent
- $1,326 high interval (Pro) →
- Mortgage (P&I)
- −$1,285
- Tax from tax record
- −$125 /mo · $1,495/yr
- Insurance
- −$102
- HOA
- −$0
- Vacancy / Maint / Mgmt
- −$278
- Net cashflow
- $-464
Break-even live
UW: 25.0% down · 7.5% · 30yr · 1.5% tax · 5.0% vac · 8.0% maint · 8.0% mgmt
Financing live
Cash to close
- Down payment
- $61,250
- Closing costs
- $7,350
- Reserves months
- —
- Total cash needed
- —
Loan-product check · same deal, 3 products live
Conventional
25% down · 7.5% · 30yr
- Down + closing
- —
- Monthly P&I
- —
- Monthly cashflow
- —
- DSCR
- —
- Eligible?
- —
Personal DTI + credit; lowest rate.
DSCR
20% down · 8.5% · 30yr
- Down + closing
- —
- Monthly P&I
- —
- Monthly cashflow
- —
- DSCR
- —
- Eligible?
- —
No personal income docs; deal must DSCR.
Hard money
10% down · 12.0% · 12mo
- Down + closing
- —
- Monthly P&I
- —
- Monthly cashflow
- —
- DSCR
- —
- Eligible?
- —
Short-term bridge; refi at stabilization.
Rent comps 12 comps
| Address | Beds | Baths | Sqft | Rent | $/sqft | DOM | Units | Dist |
|---|---|---|---|---|---|---|---|---|
| 855 E Washington Ave Vinton, VA | 2.0 | 1.0 | 750 | $1,200 | $1.60 | 21d | 1 | 0.86mi |
| 855 E Washington Ave Vinton, VA | 2.0 | 1.0 | 800 | $1,200 | $1.50 | 43d | 1 | 0.86mi |
| 856 Coolbrook Rd Unit 5 Vinton, VA | 2.0 | 1.0 | 750 | $1,100 | $1.47 | 43d | 1 | 0.86mi |
| 851 E Washington Ave Unit A-8 Vinton, VA | 2.0 | 1.0 | 800 | $1,200 | $1.50 | 13d | 1 | 0.88mi |
| 528 E Cleveland Ave Unit 3 Vinton, VA | 2.0 | 1.0 | 787 | $1,475 | $1.87 | 21d | 1 | 1.01mi |
| 528 E Cleveland Ave Unit 8 Vinton, VA | 2.0 | 1.0 | 786 | $1,395 | $1.77 | 43d | 1 | 1.01mi |
| 528 E Cleveland Ave Unit 6 Vinton, VA | 2.0 | 1.0 | 875 | $1,525 | $1.74 | 43d | 1 | 1.01mi |
| 528 E Cleveland Ave Unit 5 Vinton, VA | 2.0 | 1.0 | 889 | $1,495 | $1.68 | 43d | 1 | 1.01mi |
| 317 Jefferson Ave Vinton, VA | 2.0 | 1.0 | 980 | $1,525 | $1.56 | 43d | 1 | 1.21mi |
| 2812 Vinyard Ave NE Unit 2 Roanoke, VA | 2.0 | 1.0 | 950 | $1,295 | $1.36 | 21d | 1 | 1.24mi |
| 2802 Vinyard Ave NE Unit 2 Roanoke, VA | 2.0 | 1.0 | 950 | $1,295 | $1.36 | 13d | 1 | 1.24mi |
| 100 Highland Rd Vinton, VA | 1.0–2.0 | 1.0–2.0 | 665 | $1,195 | $1.80 | 13d | 1 | 1.49mi |
Listing history 8 events
-
2026-05-14status Pending
-
2026-05-09$245,000 Active
-
2005-12-15soldstatus $110,900 203-char remark
Show marketing remark (203 chars)
NEW ROOF IN 2004-- NEW CENTRAL AIR IN 2001- HARD WOOD FLOORS THROUGH MOST OF THE HOUSE NICE LARGE DECK ON SIDE AND REAR ALL ON LIMITED ACCESS ST. TAXES AND SQ. FT. ESTIMATED BY AGT-CALL LA FOR ADD'L FORM
-
2005-08-04$110,900 203-char remark
Show marketing remark (203 chars)
NEW ROOF IN 2004-- NEW CENTRAL AIR IN 2001- HARD WOOD FLOORS THROUGH MOST OF THE HOUSE NICE LARGE DECK ON SIDE AND REAR ALL ON LIMITED ACCESS ST. TAXES AND SQ. FT. ESTIMATED BY AGT-CALL LA FOR ADD'L FORM
-
2005-07-19historical
-
2005-05-02$119,950
-
2005-05-02historical
-
2004-10-14$114,950
ⓘ Source: listings_history table (triggers on properties + properties_extension) + one-shot
backfill from property_details.listing_events for pre-trigger history.
Tax reassessment forecast VA · Resets to sale price
- Current annual tax
- $1,495 · $125/mo
- Projected year-2 tax
- $2,009 · $167/mo
- Expected delta
- +$514/yr (+$43/mo · 34.4%)
ⓘ Screening estimate from a state-policy table — verify with the county assessor before closing.
Climate risk First Street
- Flood 1/10 Low FEMA zone X (unshaded) · 0% chance over 30 yrs
- Wildfire 2/10 Low
- Heat 5/10 Major 7 d/yr ≥100°F today · 19 d/yr by 30 yrs out
- Wind 2/10 Low 100% chance of damaging wind over 30 yrs
- Air quality 2/10 Low 1 unhealthy d/yr today · 1 by 30 yrs out
Nearby sold comps map
Loading sold comps map…
Walkable amenities ~0.75 mi
Loading nearby amenities…
Taxation est. · year 1
- Rental income
- $15,908
- − Mortgage interest
- −$13,724
- − Property taxes
- −$1,495
- − Insurance
- −$1,225
- − Repairs & maintenance
- −$1,273
- − Management
- −$1,273
- − Depreciation
- −$7,127
- Taxable loss
- −$10,208
- Est. tax savings @ 24.0%
- +$2,450
- After-tax cash flow
- $-3,120/yr
For passive investors: Depreciation is non-cash, so a rental often shows a tax loss while cash-flowing — sheltering income. Rental losses are passive: they offset passive income freely, and up to $25,000/yr can offset ordinary (W-2) income if you actively participate and your MAGI is under $100k (phasing out to $0 by $150k); unused losses carry forward. On sale, claimed depreciation is recaptured at up to 25%, and gains may owe capital-gains tax (a 1031 exchange can defer both). Figures are a year-1 estimate at your 24.0% rate — not tax advice; consult a CPA.
Schools (NCES district)
- District
- Roanoke County Public School District
- NCES district ID
- 5103330
- Math proficiency
- 71% ▼ -19.00%
- Reading proficiency
- 78% ▼ -6.00%
- Median HH income
- $60,526
- Composite
- 64.08/100
- National rank
- #578
- State rank
- #9 of 131 in VA
Livability — Vinton
- Score
- 80/100
- State rank
- #61
- US rank
- #1742
Category grades
Schools grade is shown separately in the Schools card above.
Census & demographics
- Census place
- Vinton, VA
- Population (ZIP)
- 18,834
Population outlook (Roanoke County) Hauer SSP2
- Today (2025)
- 98,162 people
- By 2030
- 99,793 · +1.7%
- By 2040
- 101,965 · +3.9%
- By 2050
- 103,328 · +5.3%
- By 2075
- 108,641 · +10.7%
- By 2100
- 104,845 · +6.8%
Race, ethnicity, and origin ACS 2023
- Neighborhood character
- Predominantly White (90%)
- Race & ethnicity
- White 90% Two or more races 4% Black 3% Hispanic / Latino 3%
- Common ancestry
- Slovak 2% Italian 2% Lithuanian 1%
- Foreign-born
- 2% · Canada
- Languages at home
- 97% English-only · Spanish 2%
Political lean MEDSL · Roanoke
- 2024 margin
- Strong R (+22.5) · D 38.2% · R 60.7% · Other 1.1%
- 2008→2024 swing
- -1.4pp toward R · 2008: -21.1pp · 2024: -22.5pp
- All cycles
- 2024: R+22.5 2020: R+21.8 2016: R+28.1 2012: R+25.6 2008: R+21.1
Not yet ingested
- Civics
- —
Market trends
- HPI YoY
- ▼ -117.89%
- Current HPI
- 186.9964
- Rent YoY
- —
- Metro
- —
- State GDP YoY
- ▲ 2.40%
- F500 in state
- 50
Industry mix (Fortune 500 HQ in VA)
| Industry | F500 HQs | Revenue |
|---|---|---|
| Aerospace / Defense | 4 | $236B |
|
||
| Technology / Defense | 3 | $32B |
|
||
| Financial Services | 2 | $176B |
|
||
| Utilities | 2 | $27B |
|
||
| Insurance | 2 | $25B |
|
||
| Technology | 2 | $15B |
|
||
Price history
+113.1% since first listed8 events — show timeline
- 2026-05-14 Pending — MLSRV
- 2026-05-09 Listed $245,000 MLSRV
- 2005-12-15 Sold (MLS) $110,900 MLSRV
- 2005-08-04 Listed $110,900 MLSRV
- 2005-07-19 Listing Removed — MLSRV
- 2005-05-02 Listing Removed — MLSRV
- 2005-05-02 Listed $119,950 MLSRV
- 2004-10-14 Listed $114,950 MLSRV
Property tax history
+1.8%/yrLatest (2025): $1,495 · +1.7% YoY. Source: county tax records.
Cash-flow waterfall
monthlySold comps — $/sqft
last 12 mo · ≤1 miLoading sold comps…