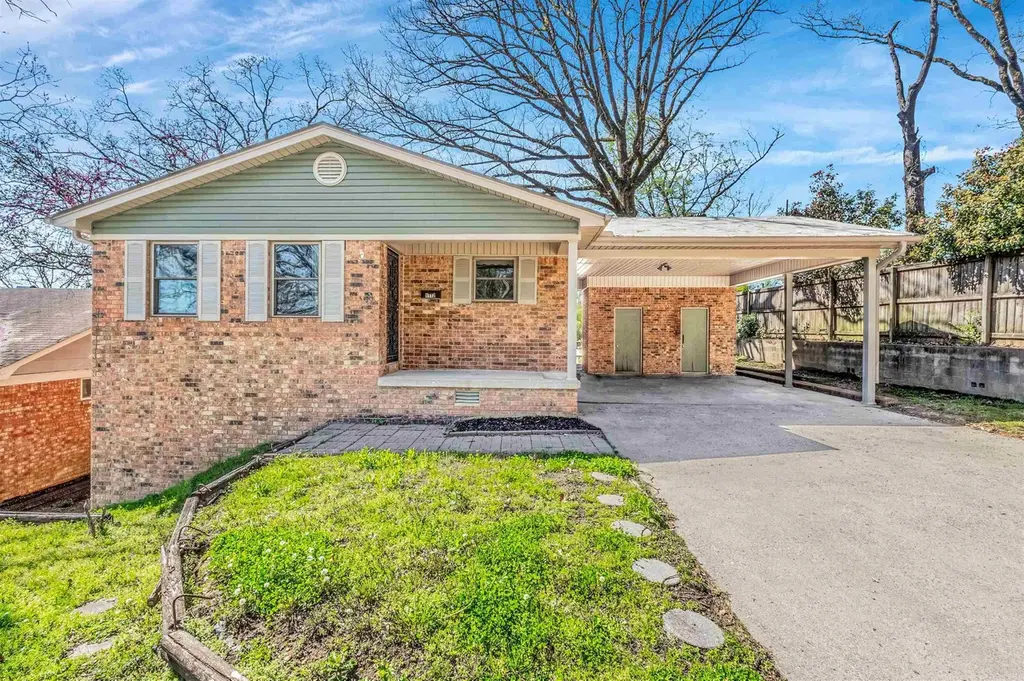
1112 N Hughes St · Little Rock, AR
Flood risk 1/10 · Minimal
- FEMA flood zone
- X (unshaded)
- Chance of flooding over 30 yrs
- 0.0%
- Est. flood insurance / yr
- $507 – $1,088
Fire risk 1/10 · Minimal
- Est. fire insurance / yr
- $1,499 – $2,785
Heat risk 6/10 · Moderate
- Hot days now (above 110°F)
- 7 days/yr
- Hot days in 30 yrs
- 18 days/yr
Wind risk 4/10 · Minor
- Chance of severe wind over 30 yrs
- 11.0%
Air-quality risk 2/10 · Minimal
- Unhealthy air days now
- 1 days/yr
- Unhealthy air days in 30 yrs
- 1 days/yr
Risk factors via First Street. Map © Google.
Why this score? — see what drove the D grade
The composite is a weighted blend of 9 inputs, each scored 0–100. Each bar is that input's sub-score; the figure is the points it added to the 100-point composite (weight × sub-score).
- Cash flow +14.6/30.0
- ARV discount +10.2/15.0
- DSCR +4.4/10.0
- Livability +3.7/5.0
- 1% rule +3.5/10.0
- Rent growth +2.5/5.0
- Condition / age +2.5/5.0
- Schools +2.1/10.0
- Appreciation +0.0/10.0
$269,999
🖨 Deal sheet (PDF) 📄 Offer letter ✓ Due diligence
Listing remarks
COMES FULLY FURNISHED!!! TURN KEY! WAS AIRBNB WITH 80% OCCUPANCY - over $2500 monthly! WOULD BE PERFECT TO CONTINUE WITH AIRBNB OR FOR A FIRST TIME HOMEBUYER, FAMILY, OR ANYONE LOOKING FOR A "MOVE IN TOMORROW" HOME! This stunning house has been fully remodeled and is ready for you!! LOCATION!!!! NEW ROOF JUNE 2025! 2 fenced backyards with a courtyard and endless possibilities! This beauty has all the curb appeal and beautiful finishes that you will love! For the chef, you'll enjoy the counter space new cabinets, gas range w/ hood, and all the storage - 2 pantries! With 4 beds, 2.5 baths and extra bonus space, you will have plenty of room for guests! Oversized driveway with carport
Key facts
- Fenced backyards
- Counter space
- Courtyard
Tags
Property features AI
Finance
- Other: Low-E windows; Insulated windows
- Financial info: Financing available: VA loan, Conventional loan, or Cash
- HOA & community: Annual HOA frequency
Exterior
- Parking: Carport; Parking pads
- Utilities: Public sewer; Public water; Municipal electric service (Entergy)
- Home design: Brick and brick & frame exterior combo; Slab/crawl combination foundation
- Construction: Composition roof
- Exterior features: Patio; Deck; Porch; Fully fenced yard; PVC fence; Guttering; Paved road access; Level lot; Inside city limits; Located in a subdivision
Interior
- Kitchen: Built-in stove; Gas range; Dishwasher; Pantry; Refrigerator stays
- Flooring: Tile; Luxury vinyl
- Bathrooms: 2 full bathrooms; 1 half bathroom
- Heating & cooling: Central heat (gas); Central electric cooling
- Interior features: Washer connection; Electric dryer connection; Smoke detectors; Security system; Ceiling fans
- Laundry & utility: Laundry room
Neighborhood map
What this means for you Summary
Snapshot
- This is a 4-bed/2.0-bath single-family listed at $270k.
Deal economics
- At list price, monthly cash flow is $63 ($758/yr) — positive.
- The deal already cash-flows at list — no discount required.
- To meet the 1% rule (rent ≥ 1% of price), the offer needs to be $230k (14.9% below list).
- Recommended offer: $230k (14.9% below list) — sets the bar for 1% rule.
- Cap rate 6.6% vs local median 4.1% in Little Rock — top-decile yield for the area; either an underpriced asset or a hidden risk that comps aren't pricing in. Stress-test before assuming the spread holds.
Location & tenants
- Location reads 73/100 on livability (#22 in AR) — a middle-class / working-renter tenant base. Strengths: commute A+, cost of living A+, housing A+; Watch: crime F.
- Little Rock School District (urban): math 23% / reading 26% proficiency, ranked #183 of 238 in AR (top 77%) — low school quality limits family demand, transient renter base, plan for 1-2y turnover; 69% free/reduced lunch — lower-income household profile, screen leases tightly.
- Zoned schools: Forest Heights Stem Academy (math 45% / reading 57%, grade C-, #88 of 454 statewide, top 19%, 739 students, 50% FRL) — zoned schools average 50% FRL vs 69% district-wide (19 pts lower); this property's tenant base skews higher-income than the district average.
- Zoned-school proficiency averages 51% at this address vs 24% district-wide (+26 pts) — the actual schools serving this property are materially stronger than the Little Rock School District average implies; a family-tenant draw the district grade alone would hide.
- Market conditions: 65 active listings in the ZIP; 23 comparable units currently listed for rent nearby; rentals lingering (median 46d on market — plan ~5-8 weeks vacancy on turnover, expect pricing pressure); 52% of comp listings sitting > 30 days — soft ceiling on asking rent; 1,006 units permitted in Pulaski County in 2024 (0 in 5+ unit buildings).
Forward outlook
- Local home prices are declining (-3.0%/yr); year-one equity from $2k of loan paydown is wiped out by about $8k of value loss. Plan a longer hold.
- Pulaski County population projected at +6% by 2050 — modest demand growth; plan on rents tracking national, not racing it.
Negotiation context
- It's been on market 17 days — a 2% lower offer ($266k) is reasonable based on typical stale-listing flexibility.
- 7 sale attempts since 11y ago; this cycle's ask is 10285% above the opening price — seller raised mid-cycle; expect resistance to lowballs.
- Current owner paid $170k; list at $270k implies a 59% gain — meaningful room to come down on a strong offer.
Risks & watch-outs
- Climate carrying-cost: extreme-heat days projected 7→18/yr by 2055 (HVAC capex compounding) — expect insurance premiums to compound above CPI over the hold.
Questions for the listing agent
- Built in 1966 — when were the roof, HVAC, electrical panel, plumbing, and water heater last replaced?
- Is there a deadline driving the sale (1031 exchange, divorce, estate, relocation)? That informs how much negotiation room exists.
- Crime grade is F in this area — have there been break-ins, vandalism, or insurance claims at this property in the last 3 years? What carrier currently insures it and at what premium?
- The area grade is low — what's the realistic commute time and amenity access for the typical tenant pool here? Any planned neighborhood developments (good or bad) we should know about?
- What's the average days-on-market for RENTAL listings here right now (not sales)? A rising rental-DOM trend means longer vacancies and softer asking-rent achievability than the comps imply.
- What's the recent tenant-quality profile in this submarket — average credit score on applications, eviction rate, late-payment / NSF rate, and stable-employment percentage? A property-management company in the area should have these aggregated.
- How much new for-sale + rental construction is in the pipeline within 1–3 miles? Heavy new supply typically softens prices + rents 12–24 months out; constrained supply supports both.
Investment metrics
- 1% rule
- 0.85% ✗
- Cap rate
- 6.57%
- Cash-on-cash
- 1.00%
- DSCR
- 1.04
- GRM
- 9.8
CMA / ARV
- ARV (median comp)
- $287,217
- List price
- $269,999
- Delta
- -4.25%
- Verdict
- FAIR
- Comps
- 20 within 1.0 mi
Show comp detail 12 sales within ~0.75 mi
| Address | Dist | Beds/Ba | Sqft | Sold | Price | $/sf | Match |
|---|---|---|---|---|---|---|---|
| 1112 N Arthur St | 0.38mi | 4/2.0 | 1,903 (-5%) | 4mo | $245,000 | $129 | 71 |
| 508 N Coolidge St | 0.39mi | 3/2.0 (-1) | 1,976 (-2%) | 7mo | $290,000 | $147 | 68 |
| 6108 Evergreen Dr | 0.42mi | 3/2.5 (-1) | 1,948 (-3%) | 7mo | $288,900 | $148 | 63 |
| 205 Kings Row Dr | 0.69mi | 4/3.0 | 1,982 (-1%) | 3mo | $309,500 | $156 | 59 |
| 7309 Gable Dr | 0.41mi | 3/1.5 (-1) | 1,830 (-9%) | 1mo | $240,000 | $131 | 58 |
| 516 N Coolidge St | 0.36mi | 4/3.0 | 2,218 (+10%) | 8mo | $311,500 | $140 | 55 |
| 2100 Brownwood Dr | 0.64mi | 3/2.5 (-1) | 2,098 (+4%) | 1mo | $460,000 | $219 | 55 |
| 521 Mcadoo St | 0.42mi | 3/2.5 (-1) | 2,225 (+11%) | 4mo | $279,000 | $125 | 52 |
| 3 Lorine Cir | 0.69mi | 4/2.5 | 2,142 (+7%) | 7mo | $234,000 | $109 | 49 |
| 2 Shannon Dr | 0.48mi | 3/2.0 (-1) | 1,763 (-12%) | 6mo | $325,000 | $184 | 48 |
| 2115 N Mckinley St | 0.73mi | 3/3.0 (-1) | 1,930 (-4%) | 5mo | $398,000 | $206 | 46 |
| 7104 Briarwood Dr | 0.73mi | 3/2.5 (-1) | 2,276 (+13%) | 2mo | $292,000 | $128 | 35 |
Match score weights: distance 35% · size 25% · config 20% · recency 20%. Top-matched comps best support the ARV.
Projected returns pro-forma
-3.0% appreciation · 3.0% rent growth · sell at horizon
- IRR
- -14.7%
- Equity multiple
- 0.47×
- Total profit
- $-39,761
- Equity at exit
- $40,258
- IRR
- -6.1%
- Equity multiple
- 0.61×
- Total profit
- $-29,580
- Equity at exit
- $23,345
Cash invested: $75,600 (down + closing). Projections, not guarantees.
Landlord ↔ Tenant lean methodology
- Overall (STATE)
- 92 Strongly Landlord-Friendly
- State Arkansas
- 92 Strongly Landlord-Friendly · R+14
- County
- — inherits STATE
- City
- — inherits STATE
ZIP-level market 72007
- Home prices YoY
- -7.9%
- Active inventory
- 65
- Price-to-rent
- 9.8×
Monthly cashflow live
- Estimated rent
- $2,299 high interval (Pro) →
- Mortgage (P&I)
- −$1,416
- Tax from tax record
- −$225 /mo · $2,695/yr
- Insurance
- −$112
- HOA
- −$0
- Vacancy / Maint / Mgmt
- −$483
- Net cashflow
- $63
Break-even live
Sensitivity live
| Price | -10% $216 | -5% $140 | +0% $63 | +5% $-13 | +10% $-90 |
|---|---|---|---|---|---|
| Rent | -10% $-118 | -5% $-28 | +0% $63 | +5% $154 | +10% $245 |
| Rate | -1.0pp $199 | -0.5pp $132 | base $63 | +0.5pp $-7 | +1.0pp $-78 |
UW: 25.0% down · 7.5% · 30yr · 1.5% tax · 5.0% vac · 8.0% maint · 8.0% mgmt
Financing live
Cash to close
- Down payment
- $67,500
- Closing costs
- $8,100
- Reserves months
- —
- Total cash needed
- —
Loan-product check · same deal, 3 products live
Conventional
25% down · 7.5% · 30yr
- Down + closing
- —
- Monthly P&I
- —
- Monthly cashflow
- —
- DSCR
- —
- Eligible?
- —
Personal DTI + credit; lowest rate.
DSCR
20% down · 8.5% · 30yr
- Down + closing
- —
- Monthly P&I
- —
- Monthly cashflow
- —
- DSCR
- —
- Eligible?
- —
No personal income docs; deal must DSCR.
Hard money
10% down · 12.0% · 12mo
- Down + closing
- —
- Monthly P&I
- —
- Monthly cashflow
- —
- DSCR
- —
- Eligible?
- —
Short-term bridge; refi at stabilization.
Rent comps 23 comps
| Address | Beds | Baths | Sqft | Rent | $/sqft | DOM | Units | Dist |
|---|---|---|---|---|---|---|---|---|
| 323 Auburn Dr Little Rock, AR | 4.0 | 2.0 | 2469 | $1,750 | $0.71 | 16d | 1 | 0.48mi |
| 224 Beckwood Dr Little Rock, AR | 3.0 | 3.0 | 2180 | $1,950 | $0.89 | 45d | 1 | 0.62mi |
| 1607 N University Ave Little Rock, AR | 4.0 | 4.0 | 2971 | $5,500 | $1.85 | 45d | 1 | 0.64mi |
| 701 N Buchanan St Little Rock, AR | 3.0 | 2.0 | 2946 | $1,300 | $0.44 | 25d | 1 | 0.69mi |
| 7301 W Markham St Little Rock, AR | 3.0 | 2.0 | 2212 | $1,500 | $0.68 | 25d | 1 | 0.73mi |
| 7902 Harmon Dr Little Rock, AR | 4.0 | 3.0 | 2500 | $2,320 | $0.93 | 45d | 1 | 0.74mi |
| 7200 Apache Rd Little Rock, AR | 3.0 | 2.0 | 2150 | $1,850 | $0.86 | 45d | 1 | 0.75mi |
| 7302 Woodside Ln Little Rock, AR | 3.0 | 2.0 | 2527 | $1,695 | $0.67 | 45d | 1 | 0.80mi |
| 1304 Biscayne Dr Little Rock, AR | 3.0 | 2.5 | 2421 | $1,850 | $0.76 | 45d | 1 | 0.87mi |
| 5812 Stonewall Rd Little Rock, AR | 3.0 | 2.0 | 1961 | $3,650 | $1.86 | 25d | 1 | 0.88mi |
| 9 Oak Glen Ln Little Rock, AR | 4.0 | 3.0 | 2780 | $4,500 | $1.62 | 45d | 1 | 0.88mi |
| 7001 Bluebird Dr Little Rock, AR | 3.0 | 2.0 | 1572 | $3,000 | $1.91 | 45d | 1 | 0.91mi |
| 8110 Alvin Ln Little Rock, AR | 3.0 | 2.0 | 1500 | $1,595 | $1.06 | 16d | 1 | 1.00mi |
| 6609 Bluebird Dr Little Rock, AR | 3.0 | 2.0 | 2026 | $1,795 | $0.89 | 25d | 1 | 1.05mi |
| 13 Gregory Ln Little Rock, AR | 4.0 | 2.0 | 1784 | $1,650 | $0.92 | 21d | 1 | 1.08mi |
| 5123 Lee Ave Little Rock, AR | 3.0 | 2.0 | 1600 | $2,125 | $1.33 | 45d | 1 | 1.16mi |
| 404 N Jackson St Little Rock, AR | 3.0 | 2.0 | 1400 | $1,900 | $1.36 | 45d | 1 | 1.25mi |
| 7 Fairbrook Dr Little Rock, AR | 4.0 | 2.5 | 1902 | $1,695 | $0.89 | 25d | 1 | 1.27mi |
| 51 Wolfbridge Lop Little Rock, AR | 3.0 | 3.0 | 1497 | $1,700 | $1.14 | 23d | 1 | 1.29mi |
| 4816 Kenyon Dr Little Rock, AR | 3.0 | 2.0 | 1425 | $4,500 | $3.16 | 16d | 1 | 1.30mi |
| 4815 Lee Ave Little Rock, AR | 3.0 | 2.0 | 1459 | $2,950 | $2.02 | 45d | 1 | 1.34mi |
| 6 Brookside Cir Little Rock, AR | 3.0 | 2.0 | 1700 | $1,695 | $1.00 | 25d | 1 | 1.43mi |
| 119 N Monroe St Little Rock, AR | 3.0 | 2.0 | 1490 | $1,850 | $1.24 | 45d | 1 | 1.46mi |
Listing history 32 events
-
2026-06-14days on market $269,999 Active 17 DOM
-
2026-06-13days on market $269,999 Active 16 DOM
-
2026-06-10days on market $269,999 Active 14 DOM
-
2026-06-09days on market $269,999 Active 13 DOM
-
2026-06-08days on market $269,999 Active 12 DOM
-
2026-06-07days on market $269,999 Active 11 DOM
-
2026-06-05days on market $269,999 Active 8 DOM
-
2026-06-03statusdays on market $269,999 Active 7 DOM
-
2026-06-02days on market $269,999 New Listing 6 DOM
-
2026-06-01days on market $269,999 New Listing 5 DOM
-
2026-05-31days on market $269,999 New Listing 4 DOM
-
2026-05-31days on market $269,999 New Listing 3 DOM
-
2026-03-21$275,000 New Listing 828-char remark
-
2025-12-12historical
-
2025-10-20$275,000 New Listing
-
2025-10-20historical
-
2025-09-30price $264,500
-
2025-09-19price $265,000
-
2025-09-08price $270,000
-
2025-08-29price $272,500
-
2025-08-19$275,000 New Listing
-
2025-08-19historical
-
2025-07-29price $275,000
-
2025-07-09price $277,000
-
2025-06-19$279,000 New Listing
-
2025-05-09soldstatus $170,000
-
2017-06-12soldstatus $139,000
-
2016-06-11historical
-
2016-01-15price $169,900
-
2015-12-11$174,900 New Listing
-
2004-06-04soldstatus $150,000
-
1998-09-04soldstatus $114,380
ⓘ Source: listings_history table (triggers on properties + properties_extension) + one-shot
backfill from property_details.listing_events for pre-trigger history.
Tax reassessment forecast AR · Resets to sale price
- Current annual tax
- $2,695 · $225/mo
- Projected year-2 tax
- $2,695 · $225/mo
- Expected delta
- $0/yr ($0/mo · 0.0%)
ⓘ Screening estimate from a state-policy table — verify with the county assessor before closing.
Climate risk First Street
- Flood 1/10 Low FEMA zone X (unshaded) · 0% chance over 30 yrs
- Wildfire 1/10 Low
- Heat 6/10 Major 7 d/yr ≥110°F today · 18 d/yr by 30 yrs out
- Wind 4/10 Moderate 11% chance of damaging wind over 30 yrs
- Air quality 2/10 Low 1 unhealthy d/yr today · 1 by 30 yrs out
Nearby sold comps map
Loading sold comps map…
Walkable amenities ~0.75 mi
Loading nearby amenities…
Taxation est. · year 1
- Rental income
- $27,588
- − Mortgage interest
- −$15,124
- − Property taxes
- −$2,695
- − Insurance
- −$1,350
- − Repairs & maintenance
- −$2,207
- − Management
- −$2,207
- − Depreciation
- −$7,855
- Taxable loss
- −$3,850
- Est. tax savings @ 24.0%
- +$924
- After-tax cash flow
- $1,682/yr
For passive investors: Depreciation is non-cash, so a rental often shows a tax loss while cash-flowing — sheltering income. Rental losses are passive: they offset passive income freely, and up to $25,000/yr can offset ordinary (W-2) income if you actively participate and your MAGI is under $100k (phasing out to $0 by $150k); unused losses carry forward. On sale, claimed depreciation is recaptured at up to 25%, and gains may owe capital-gains tax (a 1031 exchange can defer both). Figures are a year-1 estimate at your 24.0% rate — not tax advice; consult a CPA.
Schools (NCES district)
- District
- Little Rock School District
- NCES district ID
- 0509000
- Math proficiency
- 23% ▼ -12.00%
- Reading proficiency
- 26% ▼ -8.00%
- Median HH income
- $43,346
- Composite
- 21.0/100
- National rank
- #8457
- State rank
- #183 of 238 in AR
Livability — Little Rock
- Score
- 73/100
- State rank
- #22
- US rank
- #5295
Category grades
Schools grade is shown separately in the Schools card above.
Census & demographics
- Census place
- Little Rock, AR
- City population
- 218,896
- Population (ZIP)
- 9,945
Population outlook (Pulaski County) Hauer SSP2
- Today (2025)
- 415,378 people
- By 2030
- 423,720 · +2.0%
- By 2040
- 435,182 · +4.8%
- By 2050
- 440,904 · +6.1%
- By 2075
- 445,521 · +7.3%
- By 2100
- 419,173 · +0.9%
Race, ethnicity, and origin ACS 2023
- Neighborhood character
- Predominantly White (90%)
- Race & ethnicity
- White 90% Hispanic / Latino 5% Two or more races 3% Asian 2% Black 1%
- Hispanic origin (detail)
- Mexican 4%
- Common ancestry
- Romanian 3% Italian 1% Portuguese 1%
- Foreign-born
- 1% · Vietnam
- Languages at home
- 96% English-only · Spanish 1% Vietnamese 1%
Political lean MEDSL · Pulaski
- 2024 margin
- Strong D (+22.1) · D 59.8% · R 37.7% · Other 2.5%
- 2008→2024 swing
- +10.6pp toward D · 2008: 11.6pp · 2024: 22.1pp
- All cycles
- 2024: D+22.1 2020: D+22.5 2016: D+17.9 2012: D+11.4 2008: D+11.6
Not yet ingested
- Civics
- —
Market trends
- HPI YoY
- ▼ -16.87%
- Current HPI
- 196.9424
- Rent YoY
- —
- Metro
- —
- State GDP YoY
- ▲ 3.80%
- F500 in state
- 10
Industry mix (Fortune 500 HQ in AR)
| Industry | F500 HQs | Revenue |
|---|---|---|
| Retail | 1 | $681B |
|
||
| Food / Agriculture | 1 | $53B |
|
||
| Retail / Energy | 1 | $22B |
|
||
| Transportation / Logistics | 1 | $12B |
|
||
| Energy | 1 | $4B |
|
||
Price history
-97.7% since first listed24 events — show timeline
- 2026-06-17 Listed for Rent $2,600 APPFOLIO
- 2026-06-15 Listing Removed — CARMLS
- 2026-05-27 Listed $269,999 CARMLS
- 2026-05-22 Listing Removed — CARMLS
- 2026-03-21 Listed $275,000 CARMLS
- 2025-12-12 Listing Removed — CARMLS
- 2025-10-20 Listing Removed — CARMLS
- 2025-10-20 Listed $275,000 CARMLS
- 2025-09-30 Price Changed $264,500 CARMLS
- 2025-09-19 Price Changed $265,000 CARMLS
- 2025-09-08 Price Changed $270,000 CARMLS
- 2025-08-29 Price Changed $272,500 CARMLS
- 2025-08-19 Listing Removed — CARMLS
- 2025-08-19 Listed $275,000 CARMLS
- 2025-07-29 Price Changed $275,000 CARMLS
- 2025-07-09 Price Changed $277,000 CARMLS
- 2025-06-19 Listed $279,000 CARMLS
- 2025-05-09 Sold (Public Records) $170,000 Public Records
- 2017-06-12 Sold (Public Records) $139,000 Public Records
- 2016-06-11 Listing Removed — CARMLS
- 2016-01-15 Price Changed $169,900 CARMLS
- 2015-12-11 Listed $174,900 CARMLS
- 2004-06-04 Sold (Public Records) $150,000 Public Records
- 1998-09-04 Sold (Public Records) $114,380 Public Records
Property tax history
+2.9%/yrLatest (2025): $2,695 · +0.0% YoY. Source: county tax records.
Cash-flow waterfall
monthlySold comps — $/sqft
last 12 mo · ≤1 miLoading sold comps…