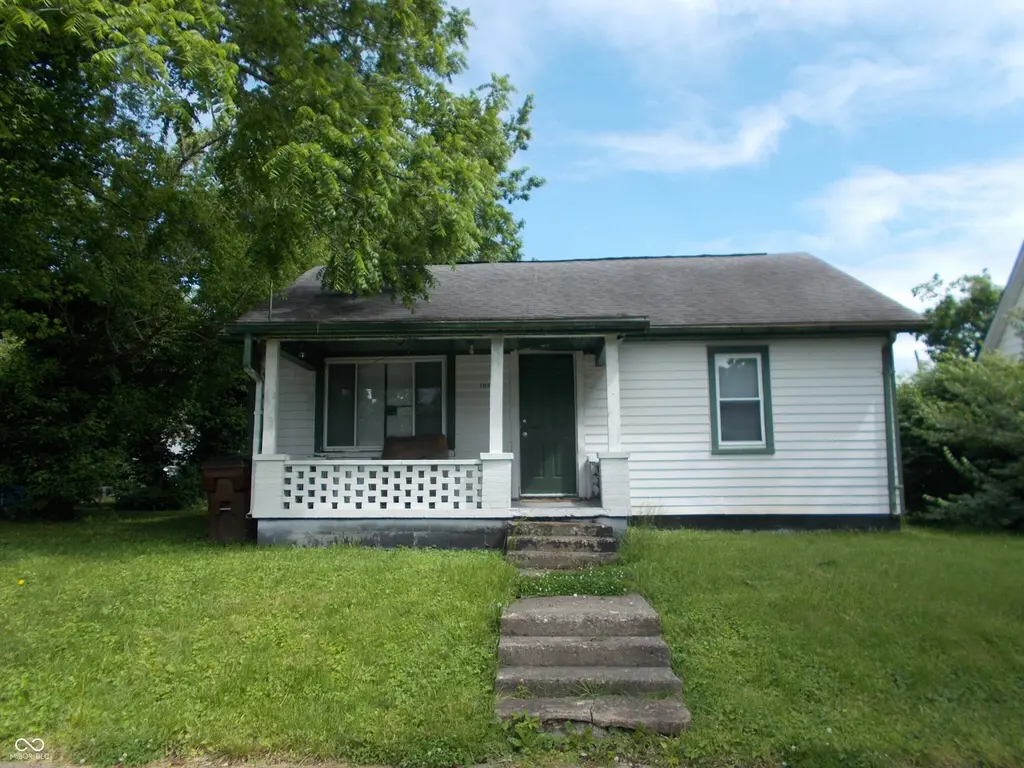
105 High St · North Vernon, IN
Flood risk 1/10 · Minimal
- FEMA flood zone
- X (unshaded)
- Chance of flooding over 30 yrs
- 0.0%
- Est. flood insurance / yr
- $507 – $1,088
Fire risk 1/10 · Minimal
- Est. fire insurance / yr
- $717 – $1,331
Heat risk 4/10 · Minor
- Hot days now (above 105°F)
- 7 days/yr
- Hot days in 30 yrs
- 19 days/yr
Wind risk 2/10 · Minimal
- Chance of severe wind over 30 yrs
- 1.0%
Air-quality risk 2/10 · Minimal
- Unhealthy air days now
- 0 days/yr
- Unhealthy air days in 30 yrs
- 1 days/yr
Risk factors via First Street. Map © Google.
Why this score? — see what drove the C+ grade
The composite is a weighted blend of 9 inputs, each scored 0–100. Each bar is that input's sub-score; the figure is the points it added to the 100-point composite (weight × sub-score).
- Cash flow +26.4/30.0
- DSCR +9.0/10.0
- ARV discount +7.5/15.0
- 1% rule +5.9/10.0
- Livability +4.0/5.0
- Schools +3.0/10.0
- Rent growth +2.5/5.0
- Condition / age +2.5/5.0
- Appreciation +0.0/10.0
$85,000
🖨 Deal sheet 📄 Offer letter ✓ Due diligence
Listing remarks
2 bedroom, 1 bath, central air home. 2 car garage with opener. Front porch and enclosed rear porch. Replacement windows. Selling AS IS, cash or conventional only. A great investment opportunity.
Key facts
- 7,500 sq ft lot
- 2 garage spots
- Built 1950
Property features AI
Exterior
- Parking: Detached 2-car garage with garage door opener
- Utilities: Public water; Municipal sewer
- Home design: Single family residence; One level
- Construction: Aluminum siding; Block foundation
- Exterior features: Porch; Mature trees on the lot
Interior
- Kitchen: Electric oven; Refrigerator
- Bedrooms: 2 bedrooms on the main level
- Bathrooms: 1 full bathroom (main level)
- Heating & cooling: Forced air heating; Central air conditioning
- Interior features: Attic access; Woodwork stained/painted; Laundry in unit
- Laundry & utility: Laundry in unit
Neighborhood map
What this means for you Summary
Snapshot
- This is a 2-bed/1.0-bath single-family listed at $85k.
Deal economics
- At list price, monthly cash flow is $223 ($3k/yr) — positive.
- The deal already cash-flows at list — no discount required.
- Meets the 1% rule at list price ($930 rent vs $85k).
- Cap rate 9.4% vs local median 4.1% in North Vernon — top-decile yield for the area; either an underpriced asset or a hidden risk that comps aren't pricing in. Stress-test before assuming the spread holds.
Location & tenants
- Location reads 79/100 on livability (#29 in IN, #2,347 nationally) — a middle-class / working-renter tenant base. Strengths: cost of living A+, housing A+, health & safety A+; Watch: amenities D, commute F.
- Jennings County School Corporation (rural): math 32% / reading 38% proficiency, ranked #194 of 301 in IN (top 64%) — families likely to look elsewhere, expect single-tenant / working-renter base with shorter leases.
- Zoned schools: Jennings County High School (math 26% / reading 62%, grade F, #189 of 369 statewide, top 51%, 1,184 students, 52% FRL) — zoned schools at 52% FRL track the district average.
- Market conditions: 160 active listings in the ZIP; 6 comparable units currently listed for rent nearby; rentals lingering (median 44d on market — plan ~5-8 weeks vacancy on turnover, expect pricing pressure); 100% of comp listings sitting > 30 days — soft ceiling on asking rent; 84 units permitted in Jennings County in 2024 (0 in 5+ unit buildings).
Forward outlook
- Local home prices are declining (-3.0%/yr); year-one equity from $588 of loan paydown is wiped out by about $3k of value loss. Plan a longer hold.
- Jennings County population projected at -21% by 2050 — secular population decline; favor cash flow + early exit over multi-decade hold.
- At projected returns (-3.0% appreciation + 3.0% rent growth), your $24k cash investment doubles in ~10 years — after that, you're playing with house money.
Negotiation context
- Only 2 days on market — expect competitive offers; lowballing is unlikely to land.
- 2 sale attempts since 11y ago with the ask held roughly flat each time — persistent listings suggest the price (not the market) is what's stuck; bring a comps-based counter.
Risks & watch-outs
- Watch-outs: built in 1950 — expect roof / HVAC / electrical / plumbing capex.
Questions for the listing agent
- Built in 1950 — when were the roof, HVAC, electrical panel, plumbing, and water heater last replaced?
- Is there a deadline driving the sale (1031 exchange, divorce, estate, relocation)? That informs how much negotiation room exists.
- Schools are D-rated, which usually means shorter tenancies and higher turnover. Who's the typical renter profile here, and what's been the actual vacancy rate?
- What's the average days-on-market for RENTAL listings here right now (not sales)? A rising rental-DOM trend means longer vacancies and softer asking-rent achievability than the comps imply.
- What's the recent tenant-quality profile in this submarket — average credit score on applications, eviction rate, late-payment / NSF rate, and stable-employment percentage? A property-management company in the area should have these aggregated.
- How much new for-sale + rental construction is in the pipeline within 1–3 miles? Heavy new supply typically softens prices + rents 12–24 months out; constrained supply supports both.
Investment metrics
- 1% rule
- 1.09% ✓
- Cap rate
- 9.44%
- Cash-on-cash
- 11.24%
- DSCR
- 1.50
- GRM
- 7.6
CMA / ARV
- ARV (on-the-fly)
- $85,020
- Comps found
- 7
Show comp detail 7 sales within ~0.75 mi
| Address | Dist | Beds/Ba | Sqft | Sold | Price | $/sf | Match |
|---|---|---|---|---|---|---|---|
| 105 High St | 0.00mi | 2/1.0 | 780 (0%) | 0mo | $80,000 | $103 | 100 |
| 105 Myrtle St | 0.41mi | 2/1.0 | 768 (-2%) | 12mo | $110,000 | $143 | 69 |
| 35 Hayden Pike | 0.15mi | 2/1.0 | 844 (+8%) | 17mo | $32,500 | $39 | 65 |
| 267 Lincoln St | 0.53mi | 2/1.0 | 768 (-2%) | 12mo | $150,000 | $195 | 63 |
| 145 Hayden Pike | 0.26mi | 2/1.0 | 880 (+13%) | 10mo | $95,650 | $109 | 58 |
| 237 Norris Ave | 0.61mi | 2/1.0 | 888 (+14%) | 8mo | $45,000 | $51 | 42 |
| 238 Norris Ave | 0.61mi | 2/1.0 | 672 (-14%) | 11mo | $140,000 | $208 | 40 |
Match score weights: distance 35% · size 25% · config 20% · recency 20%. Top-matched comps best support the ARV.
Projected returns pro-forma
-3.0% appreciation · 3.0% rent growth · sell at horizon
- IRR
- 0.4%
- Equity multiple
- 1.02×
- Total profit
- $388
- Equity at exit
- $12,674
- IRR
- 10.0%
- Equity multiple
- 1.78×
- Total profit
- $18,484
- Equity at exit
- $7,349
Cash invested: $23,800 (down + closing). Projections, not guarantees.
Landlord ↔ Tenant lean methodology
- Overall (STATE)
- 90 Strongly Landlord-Friendly
- State Indiana
- 90 Strongly Landlord-Friendly · R+11
- County
- — inherits STATE
- City
- — inherits STATE
ZIP-level market 47265
- Home prices YoY
- -31.5%
- Active inventory
- 160
- Price-to-rent
- 7.6×
Monthly cashflow live
- Estimated rent
- $930 high interval (Pro) →
- Mortgage (P&I)
- −$446
- Tax from tax record
- −$30 /mo · $365/yr
- Insurance
- −$35
- HOA
- −$0
- Vacancy / Maint / Mgmt
- −$195
- Net cashflow
- $223
Break-even live
UW: 25.0% down · 7.5% · 30yr · 1.5% tax · 5.0% vac · 8.0% maint · 8.0% mgmt
Financing live
Cash to close
- Down payment
- $21,250
- Closing costs
- $2,550
- Reserves months
- —
- Total cash needed
- —
Loan-product check · same deal, 3 products live
Conventional
25% down · 7.5% · 30yr
- Down + closing
- —
- Monthly P&I
- —
- Monthly cashflow
- —
- DSCR
- —
- Eligible?
- —
Personal DTI + credit; lowest rate.
DSCR
20% down · 8.5% · 30yr
- Down + closing
- —
- Monthly P&I
- —
- Monthly cashflow
- —
- DSCR
- —
- Eligible?
- —
No personal income docs; deal must DSCR.
Hard money
10% down · 12.0% · 12mo
- Down + closing
- —
- Monthly P&I
- —
- Monthly cashflow
- —
- DSCR
- —
- Eligible?
- —
Short-term bridge; refi at stabilization.
Rent comps 6 comps
| Address | Beds | Baths | Sqft | Rent | $/sqft | DOM | Units | Dist |
|---|---|---|---|---|---|---|---|---|
| 1450 Oak Meadows Dr North Vernon, IN | 2.0–3.0 | 1.0–2.0 | 872 | $875 | $1.00 | 43d | 1 | 0.31mi |
| 205 Long St North Vernon, IN | 2.0 | 1.0 | 750 | $875 | $1.17 | 43d | 1 | 0.68mi |
| 105 Greensburg St Unit 2 North Vernon, IN | 1.0 | 1.0 | 638 | $875 | $1.37 | 43d | 1 | 0.81mi |
| 8 Westside Ct North Vernon, IN | 2.0 | 1.0 | 870 | $950 | $1.09 | 43d | 1 | 0.84mi |
| 450 N Greensburg St North Vernon, IN | 2.0 | 1.0 | 720 | $875 | $1.22 | 43d | 1 | 0.92mi |
| 2985 N State St North Vernon, IN | 2.0 | 1.0 | 1055 | $1,350 | $1.28 | 43d | 1 | 0.96mi |
Listing history 3 events
-
2026-05-26$85,000 Active
-
2015-10-19historical
-
2015-05-18$67,900
ⓘ Source: listings_history table (triggers on properties + properties_extension) + one-shot
backfill from property_details.listing_events for pre-trigger history.
Tax reassessment forecast IN · Partial reset (capped growth)
- Current annual tax
- $365 · $30/mo
- Projected year-2 tax
- $544 · $45/mo
- Expected delta
- +$179/yr (+$15/mo · 49.0%)
ⓘ Screening estimate from a state-policy table — verify with the county assessor before closing.
Climate risk First Street
- Flood 1/10 Low FEMA zone X (unshaded) · 0% chance over 30 yrs
- Wildfire 1/10 Low
- Heat 4/10 Moderate 7 d/yr ≥105°F today · 19 d/yr by 30 yrs out
- Wind 2/10 Low 100% chance of damaging wind over 30 yrs
- Air quality 2/10 Low 0 unhealthy d/yr today · 1 by 30 yrs out
Nearby sold comps map
Loading sold comps map…
Walkable amenities ~0.75 mi
Loading nearby amenities…
Taxation est. · year 1
- Rental income
- $11,156
- − Mortgage interest
- −$4,761
- − Property taxes
- −$365
- − Insurance
- −$425
- − Repairs & maintenance
- −$893
- − Management
- −$893
- − Depreciation
- −$2,473
- Taxable income
- $1,347
- Est. tax owed @ 24.0%
- −$323
- After-tax cash flow
- $2,351/yr
For passive investors: Depreciation is non-cash, so a rental often shows a tax loss while cash-flowing — sheltering income. Rental losses are passive: they offset passive income freely, and up to $25,000/yr can offset ordinary (W-2) income if you actively participate and your MAGI is under $100k (phasing out to $0 by $150k); unused losses carry forward. On sale, claimed depreciation is recaptured at up to 25%, and gains may owe capital-gains tax (a 1031 exchange can defer both). Figures are a year-1 estimate at your 24.0% rate — not tax advice; consult a CPA.
Schools (NCES district)
- District
- Jennings County School Corporation
- NCES district ID
- 1805190
- Math proficiency
- 32% ▼ -11.00%
- Reading proficiency
- 38% ▼ -6.00%
- Median HH income
- $45,418
- Composite
- 29.89/100
- National rank
- #6394
- State rank
- #194 of 301 in IN
Livability — North Vernon
- Score
- 79/100
- State rank
- #29
- US rank
- #2347
Category grades
Schools grade is shown separately in the Schools card above.
Census & demographics
- Census place
- North Vernon, IN
- City population
- 20,981
- Population (ZIP)
- 20,981
Population outlook (Jennings County) Hauer SSP2
- Today (2025)
- 26,584 people
- By 2030
- 25,591 · -3.7%
- By 2040
- 23,423 · -11.9%
- By 2050
- 20,973 · -21.1%
- By 2075
- 15,445 · -41.9%
- By 2100
- 10,714 · -59.7%
Race, ethnicity, and origin ACS 2023
- Neighborhood character
- Predominantly White (92%)
- Race & ethnicity
- White 92% Hispanic / Latino 4% Two or more races 3%
- Common ancestry
- Slovak 2% Romanian 1% Italian 1%
- Foreign-born
- 1% · Canada
- Languages at home
- 96% English-only · Spanish 2% German/W. Germanic 1%
Political lean MEDSL · Jennings
- 2024 margin
- Solid R (+58.8) · D 19.7% · R 78.5% · Other 1.8%
- 2008→2024 swing
- -50.8pp toward R · 2008: -8.0pp · 2024: -58.8pp
- All cycles
- 2024: R+58.8 2020: R+56.9 2016: R+52.7 2012: R+22.4 2008: R+8.0
Not yet ingested
- Civics
- —
Market trends
- HPI YoY
- ▼ -107.36%
- Current HPI
- 233.0275
- Rent YoY
- —
- Metro
- —
- State GDP YoY
- ▲ 2.90%
- F500 in state
- 18
Industry mix (Fortune 500 HQ in IN)
| Industry | F500 HQs | Revenue |
|---|---|---|
| Industrial Machinery | 2 | $37B |
|
||
| Healthcare | 1 | $177B |
|
||
| Pharmaceuticals | 1 | $45B |
|
||
| Metals / Steel | 1 | $18B |
|
||
| Agriculture | 1 | $17B |
|
||
| Packaging | 1 | $12B |
|
||
Price history
+25.2% since first listed3 events — show timeline
- 2026-05-26 Listed $85,000 MIBOR as Distributed by MLS Grid
- 2015-10-19 Listing Removed — MIBOR as Distributed by MLS Grid
- 2015-05-18 Listed $67,900 MIBOR as Distributed by MLS Grid
Property tax history
-11.9%/yrLatest (2024): $365 · +5.5% YoY. Source: county tax records.
Cash-flow waterfall
monthlySold comps — $/sqft
last 12 mo · ≤1 miLoading sold comps…