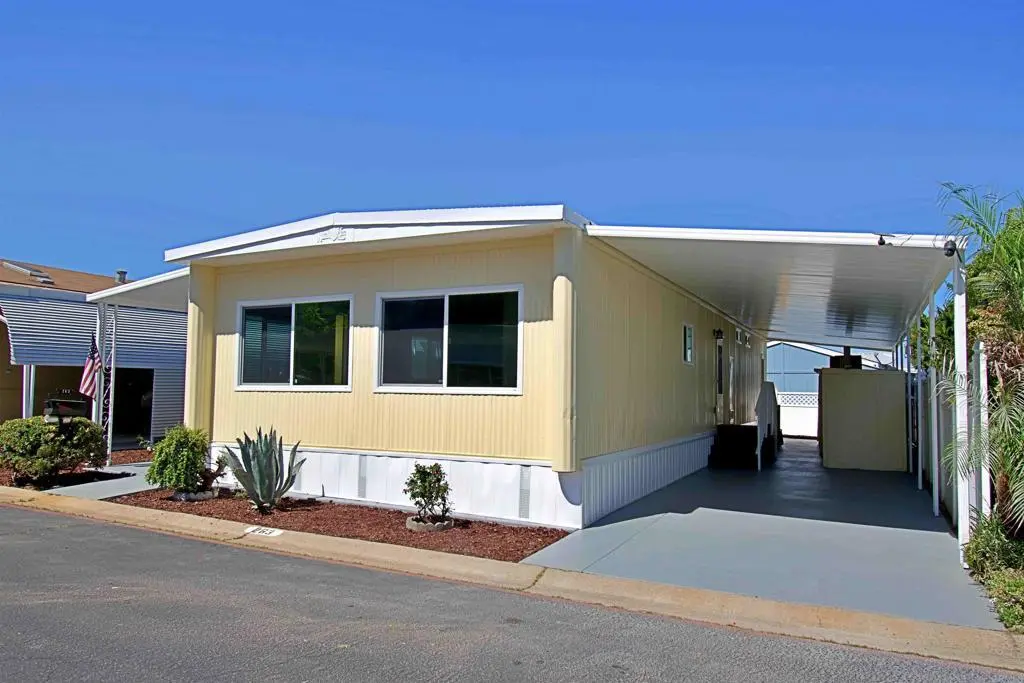
8301 Mission Gorge #263 · Santee, CA
Flood risk 1/10 · Minimal
- FEMA flood zone
- X (unshaded)
- Chance of flooding over 30 yrs
- 0.0%
- Est. flood insurance / yr
- $507 – $1,088
Fire risk 5/10 · Moderate
- Est. fire insurance / yr
- $659 – $1,223
Heat risk 4/10 · Minor
- Hot days now (above 96°F)
- 4 days/yr
- Hot days in 30 yrs
- 11 days/yr
Wind risk 1/10 · Minimal
- Chance of severe wind over 30 yrs
- —
Air-quality risk 3/10 · Minor
- Unhealthy air days now
- 4 days/yr
- Unhealthy air days in 30 yrs
- 4 days/yr
Risk factors via First Street. Map © Google.
Why this score? — see what drove the C+ grade
The composite is a weighted blend of 9 inputs, each scored 0–100. Each bar is that input's sub-score; the figure is the points it added to the 100-point composite (weight × sub-score).
- Cash flow +29.7/30.0
- DSCR +10.0/10.0
- 1% rule +8.4/10.0
- Schools +4.5/10.0
- ARV discount +3.4/15.0
- Livability +3.2/5.0
- Rent growth +2.7/5.0
- Condition / age +2.5/5.0
- Appreciation +0.0/10.0
$229,000
🖨 Deal sheet 📄 Offer letter ✓ Due diligence
Listing remarks MLS
REDUCED!!! A great value in this outstanding park. Large comfortable rooms, great kitchen, and separate laundry room. Needs a flooring redo and a little TLC and you will have a great home to retire in. THIS HOME HAS BEEN REDUCED AGAIN. .. JUST WAITING FOR YOU TO MAKE IT YOUR OWN.
Key facts
- Move-in ready
- Updated finishes
- Natural light
Tags
Property features AI
Finance
- Other: Lot size and living area listed as estimated; Location coordinates available
- Financial info: Assessments: Unknown
- HOA & community: Senior community; Community features include biking, hiking, and park; Land lease: $1,244
Exterior
- Parking: 2 total parking spaces; 2 carport spaces; Located in Meadowbrook Mobile Estates
- Security: Manager approval required
- Utilities: Public sewer
- Home design: Mobile home (20' x 60'); Mobile home remains on site; Single-story
- Construction: Construction details not specified
- Exterior features: Community pool; Level lot with street access
Interior
- Kitchen: Kitchen
- Bedrooms: Bedrooms not specified
- Flooring: Flooring not specified
- Bathrooms: 2 full bathrooms
- Heating & cooling: Wall/window cooling
- Interior features: One-level home; Entry on left and right; Entry; Living Room
- Laundry & utility: Washer hookup; Gas dryer hookup; Laundry in closet
Neighborhood map
What this means for you Summary
Snapshot
- This is a 2-bed/2.0-bath manufactured listed at $229k.
Deal economics
- At list price, monthly cash flow is $837 ($10k/yr) — positive.
- The deal already cash-flows at list — no discount required.
- Meets the 1% rule at list price ($3k rent vs $229k).
- Recommended offer: $222k (3.0% below list) — sets the bar for market timing.
- Cap rate 10.7% vs local median 2.6% in Santee — top-decile yield for the area; either an underpriced asset or a hidden risk that comps aren't pricing in. Stress-test before assuming the spread holds.
Location & tenants
- Location reads 65/100 on livability (#361 in CA) — a middle-class / working-renter tenant base. Strengths: commute A+, employment A+, crime A-; Watch: health & safety C-, amenities D, cost of living F.
- Santee (suburban): math 46% / reading 54% proficiency, ranked #130 of 517 in CA (top 25%) — acceptable for families but not a draw, mixed tenant base, ~2y average lease.
- Market conditions: Rents flat; 197 active listings in the ZIP; 11 comparable units currently listed for rent nearby; rentals leasing fast (median 2d on market — plan ~1-2 weeks tenant-placement turnaround); high-income renter base; 11,759 units permitted in San Diego County in 2024 (7,244 in 5+ unit buildings).
- This rent runs 32% of the median local income ($114k/yr) — at the standard rent-burdened threshold; future hikes will face affordability resistance.
Forward outlook
- Local home prices are declining (-3.0%/yr); year-one equity from $2k of loan paydown is wiped out by about $7k of value loss. Plan a longer hold.
- San Diego County population projected at +20% by 2050 — long-run rental-demand tailwind backs the buy-and-hold thesis.
- At projected returns (-3.0% appreciation + 0.8% rent growth), your $64k cash investment doubles in ~10 years — after that, you're playing with house money.
Negotiation context
- It's been on market 55 days — a 3% lower offer ($222k) is reasonable based on typical stale-listing flexibility.
- 2 sale attempts since 17y ago with the ask held roughly flat each time — persistent listings suggest the price (not the market) is what's stuck; bring a comps-based counter.
- Current owner paid $15k; list at $229k implies a 1437% gain — meaningful room to come down on a strong offer.
Risks & watch-outs
- Climate carrying-cost: moderate wildfire risk — expect insurance premiums to compound above CPI over the hold.
Questions for the listing agent
- It's been on market 55 days. Have you received any prior offers? Is the seller open to a 3% concession, seller financing, or rate buy-down credit?
- Built in 1968 — when were the roof, HVAC, electrical panel, plumbing, and water heater last replaced?
- Is there a deadline driving the sale (1031 exchange, divorce, estate, relocation)? That informs how much negotiation room exists.
- What's the average days-on-market for RENTAL listings here right now (not sales)? A rising rental-DOM trend means longer vacancies and softer asking-rent achievability than the comps imply.
- What's the recent tenant-quality profile in this submarket — average credit score on applications, eviction rate, late-payment / NSF rate, and stable-employment percentage? A property-management company in the area should have these aggregated.
- How much new for-sale + rental construction is in the pipeline within 1–3 miles? Heavy new supply typically softens prices + rents 12–24 months out; constrained supply supports both.
Investment metrics
- 1% rule
- 1.34% ✓
- Cap rate
- 10.68%
- Cash-on-cash
- 15.66%
- DSCR
- 1.70
- GRM
- 6.2
CMA / ARV
- ARV (on-the-fly)
- $210,000
- Comps found
- 12
Show comp detail 12 sales within ~0.75 mi
| Address | Dist | Beds/Ba | Sqft | Sold | Price | $/sf | Match |
|---|---|---|---|---|---|---|---|
| 8301 Mission Gorge Rd #282 | 0.10mi | 2/2.0 | 1,248 (+4%) | 5mo | $310,000 | $248 | 84 |
| 8301 Mission Gorge Rd #86 | 0.10mi | 2/2.0 | 1,272 (+6%) | 2mo | $223,000 | $175 | 84 |
| 8301 Mission Gorge Rd #124 | 0.00mi | 2/2.0 | 1,368 (+14%) | 0mo | $100,000 | $73 | 76 |
| 8301 Mission Gorge Rd #172 | 0.08mi | 2/2.0 | 1,344 (+12%) | 3mo | $220,000 | $164 | 73 |
| 8301 Mission Gorge Rd #154 | 0.10mi | 2/2.0 | 1,344 (+12%) | 5mo | $160,000 | $119 | 71 |
| 8301 Mission Gorge Road 301 | 0.10mi | 3/2.0 (+1) | 1,320 (+10%) | 4mo | $295,000 | $223 | 70 |
| 8301 Mission Gorge Rd #286 | 0.10mi | 2/2.0 | 1,368 (+14%) | 4mo | $189,000 | $138 | 69 |
| 8301 Mission Gorge Rd #351 | 0.10mi | 2/2.0 | 1,368 (+14%) | 8mo | $240,000 | $175 | 66 |
| 8301 Mission Gorge Rd Spc 382 | 0.10mi | 2/2.0 | 1,368 (+14%) | 8mo | $225,000 | $164 | 65 |
| 8545 Mission Gorge Rd Spc 232 | 0.31mi | 3/2.0 (+1) | 1,325 (+10%) | 3mo | $299,000 | $226 | 61 |
| 8545 Mission Gorge Rd Spc 147 | 0.36mi | 3/2.0 (+1) | 1,325 (+10%) | 2mo | $315,000 | $238 | 60 |
| 8545 Mission Gorge Rd Spc 141 | 0.33mi | 2/2.0 | 1,040 (-13%) | 7mo | $230,000 | $221 | 56 |
Match score weights: distance 35% · size 25% · config 20% · recency 20%. Top-matched comps best support the ARV.
Projected returns pro-forma
-3.0% appreciation · 0.85% rent growth · sell at horizon
- IRR
- 4.0%
- Equity multiple
- 1.15×
- Total profit
- $9,740
- Equity at exit
- $34,145
- IRR
- 11.4%
- Equity multiple
- 1.81×
- Total profit
- $51,796
- Equity at exit
- $19,800
Cash invested: $64,120 (down + closing). Projections, not guarantees.
Landlord ↔ Tenant lean methodology
- Overall (STATE)
- 18 Strongly Tenant-Friendly
- State California
- 18 Strongly Tenant-Friendly · D+13
- County
- — inherits STATE
- City
- — inherits STATE
ZIP-level market 92071
- Rents YoY
- 0.8%
- Active inventory
- 197
- Price-to-rent
- 6.2×
Monthly cashflow live
- Estimated rent
- $3,062 high interval (Pro) →
- Mortgage (P&I)
- −$1,201
- Tax est. 1.5%
- −$286 /mo · $3,435/yr
- Insurance
- −$95
- HOA
- −$0
- Vacancy / Maint / Mgmt
- −$643
- Net cashflow
- $837
Break-even live
UW: 25.0% down · 7.5% · 30yr · 1.5% tax · 5.0% vac · 8.0% maint · 8.0% mgmt
Financing live
Cash to close
- Down payment
- $57,250
- Closing costs
- $6,870
- Reserves months
- —
- Total cash needed
- —
Loan-product check · same deal, 3 products live
Conventional
25% down · 7.5% · 30yr
- Down + closing
- —
- Monthly P&I
- —
- Monthly cashflow
- —
- DSCR
- —
- Eligible?
- —
Personal DTI + credit; lowest rate.
DSCR
20% down · 8.5% · 30yr
- Down + closing
- —
- Monthly P&I
- —
- Monthly cashflow
- —
- DSCR
- —
- Eligible?
- —
No personal income docs; deal must DSCR.
Hard money
10% down · 12.0% · 12mo
- Down + closing
- —
- Monthly P&I
- —
- Monthly cashflow
- —
- DSCR
- —
- Eligible?
- —
Short-term bridge; refi at stabilization.
Rent comps 11 comps
| Address | Beds | Baths | Sqft | Rent | $/sqft | DOM | Units | Dist |
|---|---|---|---|---|---|---|---|---|
| 7962 Arly Ct #12 Santee, CA | 2.0 | 2.0 | 945 | $2,800 | $2.96 | 2d | 1 | 0.38mi |
| 8605 Arminda Cir Santee, CA | 2.0 | 2.0 | 958 | $2,650 | $2.77 | 2d | 1 | 0.40mi |
| 8609 Arminda Cir #13 Santee, CA | 2.0 | 2.0 | 984 | $3,000 | $3.05 | 2d | 1 | 0.42mi |
| 7847 Mission Gorge Rd Santee, CA | 1.0 | 1.0–2.0 | 870 | $2,845 | $3.27 | 2d | 4 | 0.47mi |
| 177 Via Montisi Santee, CA | 2.0 | 2.5 | 1239 | $3,450 | $2.78 | 2d | 1 | 0.52mi |
| 69 Via Sovana Santee, CA | 3.0 | 3.0 | 1342 | $3,600 | $2.68 | 2d | 1 | 0.52mi |
| 8434 Kreiner Way Santee, CA | 3.0 | 2.0 | 1305 | $4,213 | $3.23 | 22d | 1 | 0.76mi |
| 8617 Bushy Hill Dr Santee, CA | 2.0–3.0 | 2.0–3.0 | 1299 | $2,700 | $2.08 | 2d | 1 | 1.01mi |
| 8745 Redwood Dr Santee, CA | 2.0–3.0 | 1.5–2.5 | 1264 | $2,850 | $2.25 | 2d | 1 | 1.03mi |
| 8009 Calle Fanita Santee, CA | 2.0 | 1.5 | 1024 | $2,995 | $2.92 | 2d | 1 | 1.12mi |
| 9409 Lake Murray Blvd San Diego, CA | 2.0 | 2.5 | 1290 | $3,300 | $2.56 | 18d | 1 | 1.43mi |
Listing history 24 events
-
2026-06-18days on market $229,000 Active 55 DOM
-
2026-06-17days on market $229,000 Active 54 DOM
-
2026-06-16days on market $229,000 Active 53 DOM
-
2026-06-15days on market $229,000 Active 52 DOM
-
2026-06-13days on market $229,000 Active 50 DOM
-
2026-06-13days on market $229,000 Active 49 DOM
-
2026-06-09days on market $229,000 Active 46 DOM
-
2026-06-08days on market $229,000 Active 45 DOM
-
2026-06-07days on market $229,000 Active 44 DOM
-
2026-06-04days on market $229,000 Active 41 DOM
-
2026-06-03days on market $229,000 Active 40 DOM
-
2026-06-02days on market $229,000 Active 39 DOM
-
2026-06-01days on market $229,000 Active 38 DOM
-
2026-05-31days on market $229,000 Active 37 DOM
-
2026-04-24price $229,000
-
2026-04-23$234,900 Active
-
2009-10-28soldstatus $14,900 280-char remark
Show marketing remark (280 chars)
REDUCED!!! A great value in this outstanding park. Large comfortable rooms, great kitchen, and separate laundry room. Needs a flooring redo and a little TLC and you will have a great home to retire in. THIS HOME HAS BEEN REDUCED AGAIN. .. JUST WAITING FOR YOU TO MAKE IT YOUR OWN.
-
2009-09-08price $14,900
-
2009-08-15price $17,900
-
2009-07-23price $18,400
-
2009-05-14price $18,900
-
2009-04-16price $24,900
-
2009-03-13price $28,000
-
2009-02-07$14,900 280-char remark
Show marketing remark (280 chars)
REDUCED!!! A great value in this outstanding park. Large comfortable rooms, great kitchen, and separate laundry room. Needs a flooring redo and a little TLC and you will have a great home to retire in. THIS HOME HAS BEEN REDUCED AGAIN. .. JUST WAITING FOR YOU TO MAKE IT YOUR OWN.
ⓘ Source: listings_history table (triggers on properties + properties_extension) + one-shot
backfill from property_details.listing_events for pre-trigger history.
Climate risk First Street
- Flood 1/10 Low FEMA zone X (unshaded) · 0% chance over 30 yrs
- Wildfire 5/10 Major
- Heat 4/10 Moderate 4 d/yr ≥96°F today · 11 d/yr by 30 yrs out
- Wind 1/10 Low
- Air quality 3/10 Moderate 4 unhealthy d/yr today · 4 by 30 yrs out
Nearby sold comps map
Loading sold comps map…
Walkable amenities ~0.75 mi
Loading nearby amenities…
Taxation est. · year 1
- Rental income
- $36,748
- − Mortgage interest
- −$12,828
- − Property taxes
- −$3,435
- − Insurance
- −$1,145
- − Repairs & maintenance
- −$2,940
- − Management
- −$2,940
- − Depreciation
- −$6,662
- Taxable income
- $6,799
- Est. tax owed @ 24.0%
- −$1,632
- After-tax cash flow
- $8,408/yr
For passive investors: Depreciation is non-cash, so a rental often shows a tax loss while cash-flowing — sheltering income. Rental losses are passive: they offset passive income freely, and up to $25,000/yr can offset ordinary (W-2) income if you actively participate and your MAGI is under $100k (phasing out to $0 by $150k); unused losses carry forward. On sale, claimed depreciation is recaptured at up to 25%, and gains may owe capital-gains tax (a 1031 exchange can defer both). Figures are a year-1 estimate at your 24.0% rate — not tax advice; consult a CPA.
Schools (NCES district)
- District
- Santee
- NCES district ID
- 0635880
- Math proficiency
- 46% ▼ -3.00%
- Reading proficiency
- 54% ▼ -2.00%
- Median HH income
- $73,452
- Composite
- 45.0/100
- National rank
- #2698
- State rank
- #130 of 517 in CA
Livability — Santee
- Score
- 65/100
- State rank
- #361
- US rank
- #12272
Category grades
Schools grade is shown separately in the Schools card above.
Census & demographics
- Census place
- Santee, CA
- County
- San Diego County · 3,178,799 people
- City population
- 59,590
- Metro
- San Diego-Chula Vista-Carlsbad, CA
- Population (ZIP)
- 59,590
- Household income
- $113,618
- Rent vs Own
- Severe rent burden
- 1719.0
Population outlook (San Diego County) Hauer SSP2
- Today (2025)
- 3,678,185 people
- By 2030
- 3,856,546 · +4.8%
- By 2040
- 4,171,407 · +13.4%
- By 2050
- 4,421,607 · +20.2%
- By 2075
- 4,831,599 · +31.4%
- By 2100
- 4,832,502 · +31.4%
Race, ethnicity, and origin ACS 2023
- Neighborhood character
- Majority White (63%)
- Race & ethnicity
- White 63% Hispanic / Latino 22% Two or more races 16% Asian 5% Black 2%
- Hispanic origin (detail)
- Mexican 18%
- Common ancestry
- Slovak 3% Italian 3% Lithuanian 2%
- Foreign-born
- 13% · Canada, Vietnam, China
- Languages at home
- 81% English-only · Spanish 8% Arabic 3% Other Asian/Pacific 1%
Political lean MEDSL · San Diego
- 2024 margin
- D (+16.8) · D 56.9% · R 40.1% · Other 2.9%
- 2008→2024 swing
- +6.6pp toward D · 2008: 10.2pp · 2024: 16.8pp
- All cycles
- 2024: D+16.8 2020: D+22.8 2016: D+17.8 2012: D+5.1 2008: D+10.2
Not yet ingested
- Civics
- —
Market trends
- HPI YoY
- ▼ -607.00%
- Current HPI
- 393.1781
- Rent YoY
- ▲ 0.85%
- Metro
- San Diego-Chula Vista-Carlsbad, CA
- State GDP YoY
- ▲ 3.21%
- F500 in state
- 116
Industry mix (Fortune 500 HQ in CA)
| Industry | F500 HQs | Revenue |
|---|---|---|
| Technology | 27 | $1,492B |
|
||
| Financial Services | 3 | $174B |
|
||
| Retail | 3 | $44B |
|
||
| Insurance | 3 | $26B |
|
||
| Media / Entertainment | 2 | $115B |
|
||
| Pharmaceuticals / Biotech | 2 | $62B |
|
||
Price history
+1436.9% since first listed10 events — show timeline
- 2026-04-24 Price Changed $229,000 CRMLS
- 2026-04-23 Listed $234,900 CRMLS
- 2009-10-28 Sold (MLS) $14,900 CRMLS
- 2009-09-08 Price Changed $14,900 SDMLS
- 2009-08-15 Price Changed $17,900 SDMLS
- 2009-07-23 Price Changed $18,400 SDMLS
- 2009-05-14 Price Changed $18,900 SDMLS
- 2009-04-16 Price Changed $24,900 SDMLS
- 2009-03-13 Price Changed $28,000 SDMLS
- 2009-02-07 Listed $14,900 CRMLS
Cash-flow waterfall
monthlySold comps — $/sqft
last 12 mo · ≤1 miLoading sold comps…