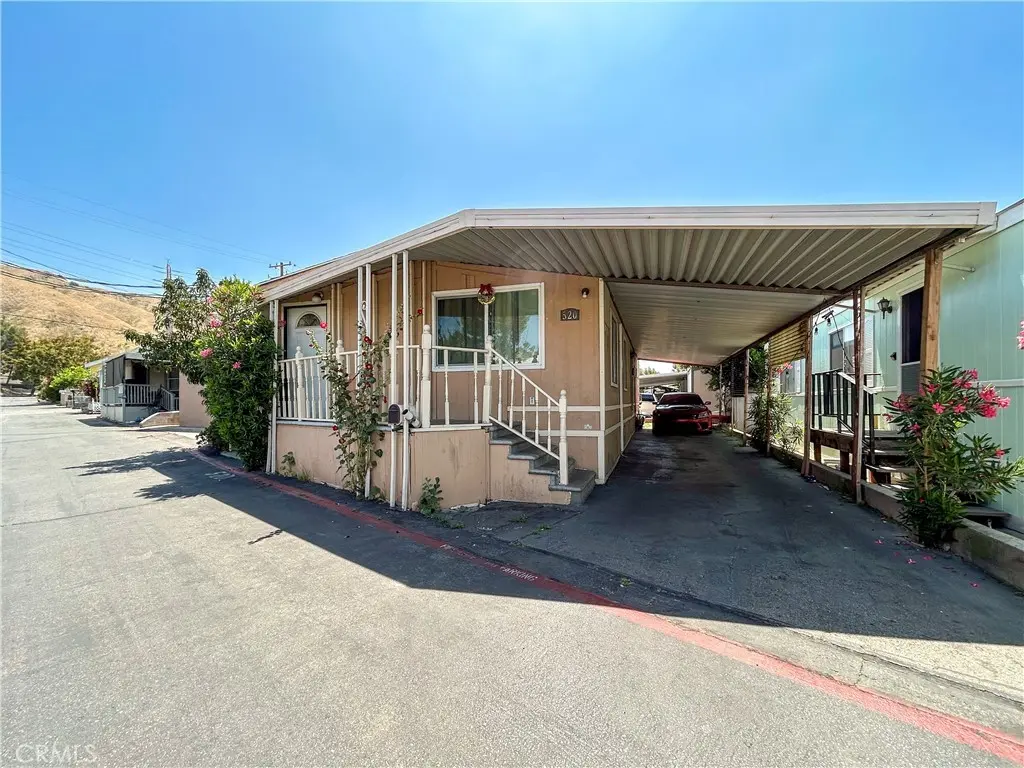
12401 Filmore St #520 · Los Angeles, CA
Flood risk 1/10 · Minimal
- FEMA flood zone
- X (unshaded)
- Chance of flooding over 30 yrs
- 0.0%
- Est. flood insurance / yr
- $507 – $1,088
Fire risk 8/10 · Major
- Est. fire insurance / yr
- $659 – $1,223
Heat risk 6/10 · Moderate
- Hot days now (above 100°F)
- 7 days/yr
- Hot days in 30 yrs
- 19 days/yr
Wind risk 1/10 · Minimal
- Chance of severe wind over 30 yrs
- —
Air-quality risk 7/10 · Major
- Unhealthy air days now
- 13 days/yr
- Unhealthy air days in 30 yrs
- 16 days/yr
Risk factors via First Street. Map © Google.
Why this score? — see what drove the B- grade
The composite is a weighted blend of 9 inputs, each scored 0–100. Each bar is that input's sub-score; the figure is the points it added to the 100-point composite (weight × sub-score).
- Cash flow +30.0/30.0
- DSCR +10.0/10.0
- 1% rule +9.0/10.0
- ARV discount +7.5/15.0
- Condition / age +3.8/5.0
- Schools +3.6/10.0
- Livability +3.4/5.0
- Rent growth +2.5/5.0
- Appreciation +0.0/10.0
$179,900
🖨 Deal sheet (PDF) 📄 Offer letter ✓ Due diligence
Listing remarks
Welcome to this well-maintained manufactured home in the desirable Sylmar area. Offering approximately 960 square feet of living space, this residence features 2 bedrooms and 2 full bathrooms, including a spacious primary suite with a private bath. The interior showcases tile flooring throughout and a separate laundry room for added convenience. Recent improvements include an upgraded electrical panel and roof, both completed approximately two years ago. Outside, the property offers a covered two-car driveway. Conveniently located near shopping, dining, parks, and major transportation routes.
Key facts
- Tile flooring
- 2 garage spots
- Community pool
Tags
Property features AI
Finance
- Other: Located in a land-lease community (Blue Star MHP)
- Financial info: $1,656 monthly land lease (park-provided)
- HOA & community: Land lease in park (Blue Star MHP) — monthly land lease; Community features: valley, suburban; Manager approval required; Pets allowed
Exterior
- Parking: 2 garage spaces; 2 carport spaces (attached); Total of 4 parking spaces; On-site parking spaces
- Security: Carbon monoxide detector(s); Smoke detector
- Utilities: Natural gas connected; Electricity connected (standard); Water connected (district/public); Public sewer; Cable available
- Home design: Single-story mobile home; Entry level 1; Facing front
- Construction: Model 75P7; Mobile home dimensions approximately 10 ft by 48 ft; Built (year source: public records)
- Exterior features: Porch; Community pool; Near public transit; Access via paved city streets
Interior
- Kitchen: Gas range; Free-standing range; Range/stove hood; Water line to refrigerator; Water heater unit; Kitchen open to family room
- Bedrooms: Primary bedroom
- Flooring: Tile
- Bathrooms: 2 full bathrooms with shower and shower-in-tub options
- Heating & cooling: Ductless heating; Ductless cooling
- Interior features: Open floor plan; Front entry; One level; Carbon monoxide and smoke detectors
- Laundry & utility: Community laundry available
Neighborhood map
What this means for you Summary
Snapshot
- This is a 2-bed/2.0-bath manufactured listed at $180k. Condition is rated good.
Deal economics
- At list price, monthly cash flow is $934 ($11k/yr) — positive.
- The deal already cash-flows at list — no discount required.
- Meets the 1% rule at list price ($3k rent vs $180k).
- Cap rate 12.5% vs local median 2.1% in Los Angeles — top-decile yield for the area; either an underpriced asset or a hidden risk that comps aren't pricing in. Stress-test before assuming the spread holds.
Location & tenants
- Location reads 68/100 on livability (#273 in CA) — a middle-class / working-renter tenant base. Strengths: amenities A+, commute A+, employment B; Watch: health & safety C-, crime F, cost of living F.
- Los Angeles Unified (urban): math 29% / reading 54% proficiency, ranked #223 of 517 in CA (top 43%) — families likely to look elsewhere, expect single-tenant / working-renter base with shorter leases; 67% free/reduced lunch — lower-income household profile, screen leases tightly.
- Zoned schools: Charles Maclay Middle (349 students, 97% FRL); San Fernando Senior High (math 20% / reading 51%, grade F, #609 of 1,170 statewide, top 52%, 1,745 students, 94% FRL) — zoned schools average 95% FRL vs 67% district-wide (28 pts higher); higher-poverty schools than district average — tighter screening recommended.
- Market conditions: Rents flat; 183 active listings in the ZIP; 10 comparable units currently listed for rent nearby; rentals leasing fast (median 13d on market — plan ~1-2 weeks tenant-placement turnaround); solid renter incomes; 19,697 units permitted in Los Angeles County in 2024 (9,426 in 5+ unit buildings).
- This rent runs 31% of the median local income ($98k/yr) — at the standard rent-burdened threshold; future hikes will face affordability resistance.
Forward outlook
- Local home prices are declining (-3.0%/yr); year-one equity from $1k of loan paydown is wiped out by about $5k of value loss. Plan a longer hold.
- Los Angeles County population projected at +9% by 2050 — modest demand growth; plan on rents tracking national, not racing it.
- At projected returns (-3.0% appreciation + 0.0% rent growth), your $50k cash investment doubles in ~7 years — after that, you're playing with house money.
Negotiation context
- Only 12 days on market — expect competitive offers; lowballing is unlikely to land.
Risks & watch-outs
- Climate carrying-cost: severe wildfire risk; extreme-heat days projected 7→19/yr by 2055 (HVAC capex compounding) — expect insurance premiums to compound above CPI over the hold.
Questions for the listing agent
- Is there a deadline driving the sale (1031 exchange, divorce, estate, relocation)? That informs how much negotiation room exists.
- Schools are D-rated, which usually means shorter tenancies and higher turnover. Who's the typical renter profile here, and what's been the actual vacancy rate?
- Crime grade is F in this area — have there been break-ins, vandalism, or insurance claims at this property in the last 3 years? What carrier currently insures it and at what premium?
- What's the average days-on-market for RENTAL listings here right now (not sales)? A rising rental-DOM trend means longer vacancies and softer asking-rent achievability than the comps imply.
- What's the recent tenant-quality profile in this submarket — average credit score on applications, eviction rate, late-payment / NSF rate, and stable-employment percentage? A property-management company in the area should have these aggregated.
- How much new for-sale + rental construction is in the pipeline within 1–3 miles? Heavy new supply typically softens prices + rents 12–24 months out; constrained supply supports both.
Investment metrics
- 1% rule
- 1.40% ✓
- Cap rate
- 12.52%
- Cash-on-cash
- 22.24%
- DSCR
- 1.99
- GRM
- 6.0
CMA / ARV
No comps found within radius.
Projected returns pro-forma
-3.0% appreciation · 0.02% rent growth · sell at horizon
- IRR
- 11.9%
- Equity multiple
- 1.46×
- Total profit
- $22,920
- Equity at exit
- $26,824
- IRR
- 18.5%
- Equity multiple
- 2.35×
- Total profit
- $67,911
- Equity at exit
- $15,554
Cash invested: $50,372 (down + closing). Projections, not guarantees.
Landlord ↔ Tenant lean methodology
- Overall (CITY)
- 0 Strongly Tenant-Friendly
- State California
- 18 Strongly Tenant-Friendly · D+13
- County
- — inherits STATE
- City Los Angeles
- 0 Strongly Tenant-Friendly · D+22
ZIP-level market 91342
- Rents YoY
- 0.0%
- Active inventory
- 183
- Price-to-rent
- 6.0×
Monthly cashflow live
- Estimated rent
- $2,514 high interval (Pro) →
- Mortgage (P&I)
- −$943
- Tax from tax record
- −$34 /mo · $412/yr
- Insurance
- −$75
- HOA
- −$0
- Vacancy / Maint / Mgmt
- −$528
- Net cashflow
- $934
Break-even live
Sensitivity live
| Price | -10% $1,036 | -5% $985 | +0% $934 | +5% $883 | +10% $832 |
|---|---|---|---|---|---|
| Rent | -10% $735 | -5% $834 | +0% $934 | +5% $1,033 | +10% $1,132 |
| Rate | -1.0pp $1,024 | -0.5pp $980 | base $934 | +0.5pp $887 | +1.0pp $840 |
UW: 25.0% down · 7.5% · 30yr · 1.5% tax · 5.0% vac · 8.0% maint · 8.0% mgmt
Financing live
Cash to close
- Down payment
- $44,975
- Closing costs
- $5,397
- Reserves months
- —
- Total cash needed
- —
Loan-product check · same deal, 3 products live
Conventional
25% down · 7.5% · 30yr
- Down + closing
- —
- Monthly P&I
- —
- Monthly cashflow
- —
- DSCR
- —
- Eligible?
- —
Personal DTI + credit; lowest rate.
DSCR
20% down · 8.5% · 30yr
- Down + closing
- —
- Monthly P&I
- —
- Monthly cashflow
- —
- DSCR
- —
- Eligible?
- —
No personal income docs; deal must DSCR.
Hard money
10% down · 12.0% · 12mo
- Down + closing
- —
- Monthly P&I
- —
- Monthly cashflow
- —
- DSCR
- —
- Eligible?
- —
Short-term bridge; refi at stabilization.
Rent comps 10 comps
| Address | Beds | Baths | Sqft | Rent | $/sqft | DOM | Units | Dist |
|---|---|---|---|---|---|---|---|---|
| 12110 Bromont Ave San Fernando, CA | 2.0 | 1.0 | 610 | $2,295 | $3.76 | 0d | 1 | 0.70mi |
| 13621 N Fellows Ave Pacoima, CA | 3.0 | 2.0 | 1000 | $2,875 | $2.88 | 21d | 1 | 0.85mi |
| 11150 Glenoaks Blvd #104 Pacoima, CA | 2.0 | 1.0 | 792 | $2,500 | $3.16 | 45d | 1 | 0.92mi |
| 11886 Foothill Blvd Sylmar, CA | 2.0 | 2.0 | 810 | $2,485 | $3.07 | 5d | 3 | 0.94mi |
| 11777 Foothill Blvd Sylmar, CA | 1.0–2.0 | 1.0–2.0 | 788 | $2,596 | $3.29 | 45d | 1 | 1.04mi |
| 13102 Filmore St Pacoima, CA | 3.0 | 2.0 | 738 | $3,000 | $4.07 | 45d | 1 | 1.20mi |
| 10820 Glenoaks Blvd Pacoima, CA | 1.0 | 1.0 | 524 | $1,895 | $3.62 | 0d | 2 | 1.35mi |
| 650 Glenoaks Blvd San Fernando, CA | 1.0 | 1.0 | 675 | $1,660 | $2.46 | 6d | 2 | 1.40mi |
| 13110 Pinney St Pacoima, CA | 1.0 | 2.0 | 800 | $2,500 | $3.12 | 12d | 1 | 1.41mi |
| 728 Glenoaks Blvd San Fernando, CA | 2.0 | 2.0 | 815 | $2,600 | $3.19 | 5d | 1 | 1.47mi |
Listing history 8 events
-
2026-06-21days on market $179,900 Active 12 DOM
-
2026-06-18days on market $179,900 Active 9 DOM
-
2026-06-17days on market $179,900 Active 8 DOM
-
2026-06-16days on market $179,900 Active 7 DOM
-
2026-06-15days on market $179,900 Active 6 DOM
-
2026-06-13days on market $179,900 Active 4 DOM
-
2026-06-10remarks 599-char remark
-
2026-06-10$179,900 Active 1 DOM
ⓘ Source: listings_history table (triggers on properties + properties_extension) + one-shot
backfill from property_details.listing_events for pre-trigger history.
Tax reassessment forecast CA · Resets to sale price
- Current annual tax
- $412 · $34/mo
- Projected year-2 tax
- $1,367 · $114/mo
- Expected delta
- +$955/yr (+$80/mo · 232.0%)
ⓘ Screening estimate from a state-policy table — verify with the county assessor before closing.
Climate risk First Street
- Flood 1/10 Low FEMA zone X (unshaded) · 0% chance over 30 yrs
- Wildfire 8/10 Severe
- Heat 6/10 Major 7 d/yr ≥100°F today · 19 d/yr by 30 yrs out
- Wind 1/10 Low
- Air quality 7/10 Severe 13 unhealthy d/yr today · 16 by 30 yrs out
Nearby sold comps map
Loading sold comps map…
Walkable amenities ~0.75 mi
Loading nearby amenities…
Taxation est. · year 1
- Rental income
- $30,174
- − Mortgage interest
- −$10,077
- − Property taxes
- −$412
- − Insurance
- −$900
- − Repairs & maintenance
- −$2,414
- − Management
- −$2,414
- − Depreciation
- −$5,233
- Taxable income
- $8,724
- Est. tax owed @ 24.0%
- −$2,094
- After-tax cash flow
- $9,111/yr
For passive investors: Depreciation is non-cash, so a rental often shows a tax loss while cash-flowing — sheltering income. Rental losses are passive: they offset passive income freely, and up to $25,000/yr can offset ordinary (W-2) income if you actively participate and your MAGI is under $100k (phasing out to $0 by $150k); unused losses carry forward. On sale, claimed depreciation is recaptured at up to 25%, and gains may owe capital-gains tax (a 1031 exchange can defer both). Figures are a year-1 estimate at your 24.0% rate — not tax advice; consult a CPA.
Condition & rehab AI · 12 photos
This well-maintained manufactured home in Sylmar offers a good condition with recent upgrades and a good ROI potential.
Value-add opportunities
- Resale Paint exterior siding — Enhances curb appeal and value
- Both Replace outdated light fixtures — Improves aesthetics and energy efficiency
- Both Install smart home devices — Enhances convenience and marketability
Renovation cost estimate screening
Value-add ROI direction
- Resale Paint exterior siding — Enhances curb appeal and value ↑
- Both Replace outdated light fixtures — Improves aesthetics and energy efficiency ↑
- Both Install smart home devices — Enhances convenience and marketability ↑
ⓘ Cost ranges are severity-bucket heuristics (US national rule-of-thumb). Get contractor quotes + a written scope before underwriting a rehab budget.
Schools (NCES district)
- District
- Los Angeles Unified
- NCES district ID
- 0622710
- Math proficiency
- 29% ▼ -4.00%
- Reading proficiency
- 54% ▲ 10.00%
- Median HH income
- $50,403
- Composite
- 35.67/100
- National rank
- #4875
- State rank
- #223 of 517 in CA
Livability — Los Angeles
- Score
- 68/100
- State rank
- #273
- US rank
- #9237
Category grades
Schools grade is shown separately in the Schools card above.
Census & demographics
- County
- Los Angeles County · 9,444,647 people
- City population
- 3,838,149
- Metro
- Los Angeles-Long Beach-Anaheim, CA
- Population (ZIP)
- 93,301
- Household income
- $98,118
- Rent vs Own
- Severe rent burden
- 2559.0
Population outlook (Los Angeles County) Hauer SSP2
- Today (2025)
- 10,940,515 people
- By 2030
- 11,256,481 · +2.9%
- By 2040
- 11,729,929 · +7.2%
- By 2050
- 11,948,407 · +9.2%
- By 2075
- 11,818,114 · +8.0%
- By 2100
- 10,842,928 · -0.9%
Race, ethnicity, and origin ACS 2023
- Neighborhood character
- Predominantly Hispanic (74%)
- Race & ethnicity
- Hispanic / Latino 74% Two or more races 23% White 12% Asian 7% Black 3% Native American 2%
- Hispanic origin (detail)
- Mexican 59%
- Common ancestry
- Italian 1%
- Foreign-born
- 36% · Canada, South Korea, Dominican Republic
- Languages at home
- 32% English-only · Spanish 59% Tagalog/Filipino 4% Other Indo-European 3%
Political lean MEDSL · Los Angeles
- 2024 margin
- Solid D (+32.9) · D 64.8% · R 31.9% · Other 3.3%
- 2008→2024 swing
- -7.4pp toward R · 2008: 40.4pp · 2024: 32.9pp
- All cycles
- 2024: D+32.9 2020: D+44.2 2016: D+48.0 2012: D+40.0 2008: D+40.4
Not yet ingested
- Civics
- —
Market trends
- HPI YoY
- ▼ -921.77%
- Current HPI
- 440.1462
- Rent YoY
- ▬ 0.02%
- Metro
- Los Angeles-Long Beach-Anaheim, CA
- State GDP YoY
- ▲ 3.21%
- F500 in state
- 116
Industry mix (Fortune 500 HQ in CA)
| Industry | F500 HQs | Revenue |
|---|---|---|
| Technology | 27 | $1,492B |
|
||
| Financial Services | 3 | $174B |
|
||
| Retail | 3 | $44B |
|
||
| Insurance | 3 | $26B |
|
||
| Media / Entertainment | 2 | $115B |
|
||
| Pharmaceuticals / Biotech | 2 | $62B |
|
||
Price history
1 event — show timeline
- 2026-06-09 Listed $179,900 CRMLS
Property tax history
+4.4%/yrLatest (2025): $412 · +4.4% YoY. Source: county tax records.
Cash-flow waterfall
monthlySold comps — $/sqft
last 12 mo · ≤1 miLoading sold comps…