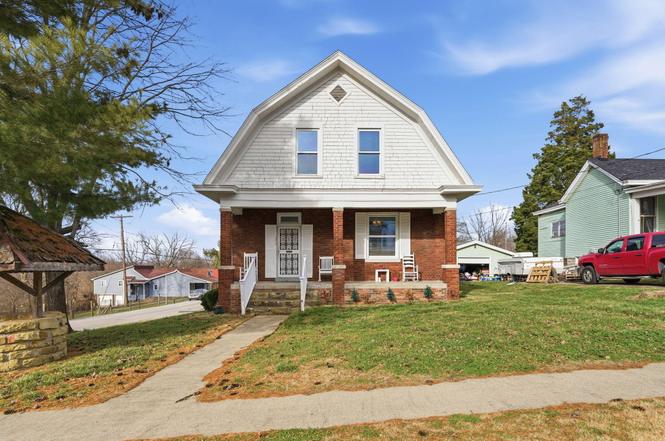
242 Wilson Ave · Cynthiana, KY
Flood risk 1/10 · Minimal
- FEMA flood zone
- X (unshaded)
- Chance of flooding over 30 yrs
- 0.0%
- Est. flood insurance / yr
- $507 – $1,088
Fire risk 1/10 · Minimal
- Est. fire insurance / yr
- $839 – $1,559
Heat risk 4/10 · Minor
- Hot days now (above 102°F)
- 7 days/yr
- Hot days in 30 yrs
- 19 days/yr
Wind risk 2/10 · Minimal
- Chance of severe wind over 30 yrs
- 2.0%
Air-quality risk 2/10 · Minimal
- Unhealthy air days now
- 1 days/yr
- Unhealthy air days in 30 yrs
- 2 days/yr
Risk factors via First Street. Map © Google.
Why this score? — see what drove the D grade
The composite is a weighted blend of 9 inputs, each scored 0–100. Each bar is that input's sub-score; the figure is the points it added to the 100-point composite (weight × sub-score).
- Cash flow +10.0/30.0
- Appreciation +10.0/10.0
- ARV discount +7.5/15.0
- Livability +3.7/5.0
- DSCR +2.9/10.0
- Rent growth +2.5/5.0
- Condition / age +2.5/5.0
- Schools +2.2/10.0
- 1% rule +1.9/10.0
$319,000
🖨 Deal sheet (PDF) 📄 Offer letter ✓ Due diligence
Listing remarks MLS
Lot's of potential with this home. Road frontage on 3 sides and the separate metal building is waiting for a hobbyist, wood worker or mechanic The enclosed rear porch has beautiful hand laid stone patio table and fireplace for relaxing evenings.
Key facts
- Thoughtful updates
- Detached workshop
- 0.26 acre lot
Tags
Property features AI
Exterior
- Parking: Attached garage (garage faces side); Has garage
- Utilities: Public water; Public sewer; Electricity connected; Natural gas connected; Sewer connected; Water connected
- Home design: One and one-half story; Brick veneer and wood siding
- Construction: Shingle roof; Block foundation
- Exterior features: Workshop on the property; Other exterior features
Interior
- Kitchen: Eat-in kitchen
- Flooring: Hardwood; Laminate
- Bathrooms: 2 full bathrooms
- Heating & cooling: Forced air heating (natural gas); Electric cooling
- Interior features: Entrance foyer; Eat-in kitchen; Ceiling fan(s)
- Laundry & utility: Main level laundry
Neighborhood map
What this means for you Summary
Snapshot
- This is a 3-bed/2.0-bath single-family listed at $319k.
Deal economics
- At list price, monthly cash flow is $-191 ($-2k/yr) — negative.
- To cash-flow at today's rent, offer at most $285k (10.6% below list).
- To meet the 1% rule (rent ≥ 1% of price), the offer needs to be $220k (31.0% below list).
- Recommended offer: $220k (31.0% below list) — sets the bar for 1% rule.
- Cap rate 5.6% vs local median 3.5% in Cynthiana — top-decile yield for the area; either an underpriced asset or a hidden risk that comps aren't pricing in. Stress-test before assuming the spread holds.
Location & tenants
- Location reads 74/100 on livability (#113 in KY, #4,911 nationally) — a middle-class / working-renter tenant base. Strengths: cost of living A+, housing A+, health & safety A+; Watch: amenities F, commute F, employment D-.
- Harrison County (town): math 21% / reading 32% proficiency, ranked #133 of 165 in KY (top 81%) — low school quality limits family demand, transient renter base, plan for 1-2y turnover.
- Zoned schools: Eastside Elementary School (math 22% / reading 27%, grade F, #489 of 676 statewide, top 76%, 411 students, 61% FRL); Harrison County Middle School (math 19% / reading 35%, grade F, #172 of 217 statewide, top 80%, 607 students, 58% FRL); Harrison County High School (math 29% / reading 41%, grade F, #74 of 254 statewide, top 29%, 865 students, 46% FRL).
- Market conditions: 97 active listings in the ZIP; 1 comparable units currently listed for rent nearby; 69 units permitted in Harrison County in 2024 (0 in 5+ unit buildings).
Forward outlook
- In year one you build about $34k of equity ($2k loan paydown + $32k appreciation (10.0% local appreciation)).
- Harrison County population projected to shrink 10% by 2050 — rents likely to lag national; underwrite the cash flow, not the appreciation.
- By year 2, paydown + projected appreciation supports a ~$55k cash-out refi (75% LTV) — recoverable capital for the next deal without selling this one.
Negotiation context
- It's been on market 157 days — a 12% lower offer ($281k) is reasonable based on typical stale-listing flexibility.
- 2 sale attempts since 2y ago with the ask held roughly flat each time — persistent listings suggest the price (not the market) is what's stuck; bring a comps-based counter.
- Current owner paid $150k; list at $319k implies a 113% gain — meaningful room to come down on a strong offer.
Questions for the listing agent
- What do current leases actually rent for vs. the listed asking? Can we see a recent rent roll and the last 12 months of T-12 income?
- It's been on market 157 days. Have you received any prior offers? Is the seller open to a 31% concession, seller financing, or rate buy-down credit?
- Why hasn't it sold? Are there any deal-killer items the seller is aware of (foundation, flood, title, zoning, code violations)?
- Is there a deadline driving the sale (1031 exchange, divorce, estate, relocation)? That informs how much negotiation room exists.
- The area grade is low — what's the realistic commute time and amenity access for the typical tenant pool here? Any planned neighborhood developments (good or bad) we should know about?
- What's the average days-on-market for RENTAL listings here right now (not sales)? A rising rental-DOM trend means longer vacancies and softer asking-rent achievability than the comps imply.
- What's the recent tenant-quality profile in this submarket — average credit score on applications, eviction rate, late-payment / NSF rate, and stable-employment percentage? A property-management company in the area should have these aggregated.
- How much new for-sale + rental construction is in the pipeline within 1–3 miles? Heavy new supply typically softens prices + rents 12–24 months out; constrained supply supports both.
Investment metrics
- 1% rule
- 0.69% ✗
- Cap rate
- 5.57%
- Cash-on-cash
- -2.57%
- DSCR
- 0.89
- GRM
- 12.1
CMA / ARV
- ARV (on-the-fly)
- $208,236
- Comps found
- 12
Show comp detail 12 sales within ~0.75 mi
| Address | Dist | Beds/Ba | Sqft | Sold | Price | $/sf | Match |
|---|---|---|---|---|---|---|---|
| 105 Taylor Dr | 0.21mi | 3/1.0 | 1,654 (+6%) | 2mo | $275,000 | $166 | 74 |
| 235 Wilson Ave | 0.05mi | 2/1.0 (-1) | 1,464 (-6%) | 8mo | $160,000 | $109 | 73 |
| 145 N Elmarch Ave | 0.13mi | 3/1.0 | 1,668 (+7%) | 6mo | $190,000 | $114 | 72 |
| 101 Charlotte Dr | 0.34mi | 3/2.0 | 1,678 (+8%) | 2mo | $250,000 | $149 | 69 |
| 102 Reynolds Ave | 0.33mi | 2/1.5 (-1) | 1,666 (+7%) | 3mo | $285,000 | $171 | 63 |
| 122 Reynolds Ave | 0.38mi | 2/1.0 (-1) | 1,664 (+7%) | 0mo | $235,000 | $141 | 61 |
| 146 North Walnut St | 0.45mi | 4/2.0 (+1) | 1,576 (+1%) | 15mo | $200,000 | $127 | 59 |
| 412 East Pleasant St | 0.19mi | 2/1.0 (-1) | 1,369 (-12%) | 11mo | $140,000 | $102 | 54 |
| 316 S Elmarch Ave | 0.37mi | 2/1.5 (-1) | 1,721 (+11%) | 9mo | $195,000 | $113 | 50 |
| 101 Stone Ave | 0.64mi | 3/1.0 | 1,402 (-10%) | 1mo | $239,900 | $171 | 49 |
| 129 Old Lair Rd | 0.47mi | 3/2.0 | 1,364 (-12%) | 11mo | $146,000 | $107 | 49 |
| 105 Sonley Dr | 0.47mi | 4/2.0 (+1) | 1,677 (+8%) | 18mo | $224,900 | $134 | 45 |
Match score weights: distance 35% · size 25% · config 20% · recency 20%. Top-matched comps best support the ARV.
Projected returns pro-forma
10.0% appreciation · 3.0% rent growth · sell at horizon
- IRR
- 22.4%
- Equity multiple
- 2.81×
- Total profit
- $161,425
- Equity at exit
- $287,380
- IRR
- 20.1%
- Equity multiple
- 6.43×
- Total profit
- $484,673
- Equity at exit
- $619,747
Cash invested: $89,320 (down + closing). Projections, not guarantees.
Landlord ↔ Tenant lean methodology
- Overall (STATE)
- 83 Strongly Landlord-Friendly
- State Kentucky
- 83 Strongly Landlord-Friendly · R+16
- County
- — inherits STATE
- City
- — inherits STATE
ZIP-level market 41031
- Home prices YoY
- 4.4%
- Active inventory
- 97
- Price-to-rent
- 12.1×
Monthly cashflow live
- Estimated rent
- $2,200 medium interval (Pro) →
- Mortgage (P&I)
- −$1,673
- Tax from tax record
- −$123 /mo · $1,480/yr
- Insurance
- −$133
- HOA
- −$0
- Vacancy / Maint / Mgmt
- −$462
- Net cashflow
- $-191
Break-even live
Sensitivity live
| Price | -10% $-11 | -5% $-101 | +0% $-191 | +5% $-281 | +10% $-372 |
|---|---|---|---|---|---|
| Rent | -10% $-365 | -5% $-278 | +0% $-191 | +5% $-104 | +10% $-17 |
| Rate | -1.0pp $-31 | -0.5pp $-110 | base $-191 | +0.5pp $-274 | +1.0pp $-358 |
UW: 25.0% down · 7.5% · 30yr · 1.5% tax · 5.0% vac · 8.0% maint · 8.0% mgmt
Financing live
Cash to close
- Down payment
- $79,750
- Closing costs
- $9,570
- Reserves months
- —
- Total cash needed
- —
Loan-product check · same deal, 3 products live
Conventional
25% down · 7.5% · 30yr
- Down + closing
- —
- Monthly P&I
- —
- Monthly cashflow
- —
- DSCR
- —
- Eligible?
- —
Personal DTI + credit; lowest rate.
DSCR
20% down · 8.5% · 30yr
- Down + closing
- —
- Monthly P&I
- —
- Monthly cashflow
- —
- DSCR
- —
- Eligible?
- —
No personal income docs; deal must DSCR.
Hard money
10% down · 12.0% · 12mo
- Down + closing
- —
- Monthly P&I
- —
- Monthly cashflow
- —
- DSCR
- —
- Eligible?
- —
Short-term bridge; refi at stabilization.
Rent comps 1 comps
| Address | Beds | Baths | Sqft | Rent | $/sqft | DOM | Units | Dist |
|---|---|---|---|---|---|---|---|---|
| 28 Heron Pl Cynthiana, KY | 2.0 | 2.0 | 1296 | $2,200 | $1.70 | 15d | 1 | 0.96mi |
Listing history 21 events
-
2026-06-21days on market $319,000 Active 157 DOM
-
2026-06-18days on market $319,000 Active 154 DOM
-
2026-06-17days on market $319,000 Active 153 DOM
-
2026-06-16days on market $319,000 Active 152 DOM
-
2026-06-15days on market $319,000 Active 151 DOM
-
2026-06-14days on market $319,000 Active 149 DOM
-
2026-06-10days on market $319,000 Active 146 DOM
-
2026-06-09days on market $319,000 Active 145 DOM
-
2026-06-08days on market $319,000 Active 144 DOM
-
2026-06-07days on market $319,000 Active 143 DOM
-
2026-06-03days on market $319,000 Active 139 DOM
-
2026-06-02days on market $319,000 Active 138 DOM
-
2026-06-01days on market $319,000 Active 137 DOM
-
2026-05-31days on market $319,000 Active 136 DOM
-
2026-05-31days on market $319,000 Active 135 DOM
-
2026-01-14$319,000 Active
-
2024-09-10soldstatus $150,000 Closed 248-char remark
Show marketing remark (248 chars)
Lot's of potential with this home. Road frontage on 3 sides and the separate metal building is waiting for a hobbyist, wood worker or mechanic The enclosed rear porch has beautiful hand laid stone patio table and fireplace for relaxing evenings.
-
2024-08-03status Pending 248-char remark
Show marketing remark (248 chars)
Lot's of potential with this home. Road frontage on 3 sides and the separate metal building is waiting for a hobbyist, wood worker or mechanic The enclosed rear porch has beautiful hand laid stone patio table and fireplace for relaxing evenings.
-
2024-07-29$160,000 Active 248-char remark
Show marketing remark (248 chars)
Lot's of potential with this home. Road frontage on 3 sides and the separate metal building is waiting for a hobbyist, wood worker or mechanic The enclosed rear porch has beautiful hand laid stone patio table and fireplace for relaxing evenings.
-
2016-07-08soldstatus $109,160
-
2013-04-04soldstatus $109,160
ⓘ Source: listings_history table (triggers on properties + properties_extension) + one-shot
backfill from property_details.listing_events for pre-trigger history.
Tax reassessment forecast KY · Resets to sale price
- Current annual tax
- $1,480 · $123/mo
- Projected year-2 tax
- $2,743 · $229/mo
- Expected delta
- +$1,263/yr (+$105/mo · 85.3%)
ⓘ Screening estimate from a state-policy table — verify with the county assessor before closing.
Climate risk First Street
- Flood 1/10 Low FEMA zone X (unshaded) · 0% chance over 30 yrs
- Wildfire 1/10 Low
- Heat 4/10 Moderate 7 d/yr ≥102°F today · 19 d/yr by 30 yrs out
- Wind 2/10 Low 2% chance of damaging wind over 30 yrs
- Air quality 2/10 Low 1 unhealthy d/yr today · 2 by 30 yrs out
Nearby sold comps map
Loading sold comps map…
Walkable amenities ~0.75 mi
Loading nearby amenities…
Taxation est. · year 1
- Rental income
- $26,400
- − Mortgage interest
- −$17,869
- − Property taxes
- −$1,480
- − Insurance
- −$1,595
- − Repairs & maintenance
- −$2,112
- − Management
- −$2,112
- − Depreciation
- −$9,280
- Taxable loss
- −$8,048
- Est. tax savings @ 24.0%
- +$1,932
- After-tax cash flow
- $-362/yr
For passive investors: Depreciation is non-cash, so a rental often shows a tax loss while cash-flowing — sheltering income. Rental losses are passive: they offset passive income freely, and up to $25,000/yr can offset ordinary (W-2) income if you actively participate and your MAGI is under $100k (phasing out to $0 by $150k); unused losses carry forward. On sale, claimed depreciation is recaptured at up to 25%, and gains may owe capital-gains tax (a 1031 exchange can defer both). Figures are a year-1 estimate at your 24.0% rate — not tax advice; consult a CPA.
Schools (NCES district)
- District
- Harrison County
- NCES district ID
- 2102580
- Math proficiency
- 21% ▼ -25.00%
- Reading proficiency
- 32% ▼ -19.00%
- Median HH income
- $39,744
- Composite
- 22.28/100
- National rank
- #8138
- State rank
- #133 of 165 in KY
Livability — Cynthiana
- Score
- 74/100
- State rank
- #113
- US rank
- #4911
Category grades
Schools grade is shown separately in the Schools card above.
Census & demographics
- Census place
- Cynthiana, KY
- Population (ZIP)
- 16,748
Population outlook (Harrison County) Hauer SSP2
- Today (2025)
- 18,605 people
- By 2030
- 18,361 · -1.3%
- By 2040
- 17,685 · -4.9%
- By 2050
- 16,845 · -9.5%
- By 2075
- 14,882 · -20.0%
- By 2100
- 12,314 · -33.8%
Race, ethnicity, and origin ACS 2023
- Neighborhood character
- Predominantly White (93%)
- Race & ethnicity
- White 93% Two or more races 4% Hispanic / Latino 2% Black 2%
- Common ancestry
- Slovak 2% Serbian 2% Italian 2%
- Foreign-born
- 1% · Canada
- Languages at home
- 97% English-only · Spanish 1% German/W. Germanic 1%
Political lean MEDSL · Harrison
- 2024 margin
- Solid R (+48.5) · D 25.1% · R 73.6% · Other 1.3%
- 2008→2024 swing
- -27.4pp toward R · 2008: -21.1pp · 2024: -48.5pp
- All cycles
- 2024: R+48.5 2020: R+44.4 2016: R+43.8 2012: R+29.1 2008: R+21.1
Not yet ingested
- Civics
- —
Market trends
- HPI YoY
- ▲ 14.31%
- Current HPI
- 339.482
- Rent YoY
- —
- Metro
- —
- State GDP YoY
- ▲ 1.81%
- F500 in state
- 4
Industry mix (Fortune 500 HQ in KY)
| Industry | F500 HQs | Revenue |
|---|---|---|
| Healthcare | 1 | $118B |
|
||
| Food / Beverage | 1 | $7B |
|
||
Price history
+192.2% since first listed6 events — show timeline
- 2026-01-14 Listed $319,000 ImagineMLS
- 2024-09-10 Sold (MLS) $150,000 ImagineMLS
- 2024-08-03 Pending — ImagineMLS
- 2024-07-29 Listed $160,000 ImagineMLS
- 2016-07-08 Sold (Public Records) $109,160 Public Records
- 2013-04-04 Sold (Public Records) $109,160 Public Records
Property tax history
+4.1%/yrLatest (2025): $1,480 · +36.6% YoY. Source: county tax records.
Cash-flow waterfall
monthlySold comps — $/sqft
last 12 mo · ≤1 miLoading sold comps…