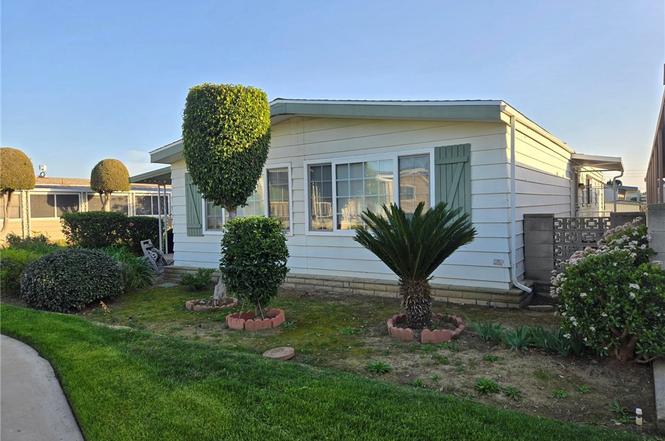
2261 Lake crest Ln #83 · La Habra, CA
Flood risk 1/10 · Minimal
- FEMA flood zone
- X (unshaded)
- Chance of flooding over 30 yrs
- 0.0%
- Est. flood insurance / yr
- $507 – $1,088
Fire risk 2/10 · Minimal
- Est. fire insurance / yr
- $659 – $1,223
Heat risk 6/10 · Moderate
- Hot days now (above 96°F)
- 7 days/yr
- Hot days in 30 yrs
- 21 days/yr
Wind risk 1/10 · Minimal
- Chance of severe wind over 30 yrs
- —
Air-quality risk 5/10 · Moderate
- Unhealthy air days now
- 7 days/yr
- Unhealthy air days in 30 yrs
- 9 days/yr
Risk factors via First Street. Map © Google.
Why this score? — see what drove the D+ grade
The composite is a weighted blend of 9 inputs, each scored 0–100. Each bar is that input's sub-score; the figure is the points it added to the 100-point composite (weight × sub-score).
- Cash flow +21.4/30.0
- DSCR +6.8/10.0
- 1% rule +5.6/10.0
- Schools +5.1/10.0
- Rent growth +3.3/5.0
- Livability +3.2/5.0
- Condition / age +2.5/5.0
- ARV discount +1.4/15.0
- Appreciation +0.0/10.0
$299,000
🖨 Deal sheet 📄 Offer letter ✓ Due diligence
Listing remarks
Senior Living 55 + This spacious 2-bedroom, 2 bath home features a light antique white interior, with laminate flooring throughout. The spacious kitchen features white cabinetry providing plenty of storage, gas cooktop and breakfast bar opening into a den area, and generous laundry room. Master bedroom features a large walk in closet, with attached beautifully remodeled bath featuring a large walk in shower, built in vanity and linen closet. Guest bedroom has a walk-in closet and attached, newly remodeled bath. Extras include energy efficient dual paned windows, ceiling fans, large storage shed, side by side parking and attractive curb appeal and plenty of gardening area. The roof is new an
Key facts
- Gas cooktop
- Spacious kitchen
- Den area
Tags
Property features AI
Finance
- Other: Pets allowed; Subdivision: Lake Park La Habra; Access via paved city streets; Directions: Cross Street Lambert and Palm, north on Palm to the entrance
- Financial info: Monthly land lease: $1,733.70
- HOA & community: Senior community; Community features: lake, fishing, sidewalks, street lighting, curbs, gutters; Park name: Lake Park La Habra; Land lease (monthly)
Exterior
- Parking: Attached carport (side-by-side) with covered parking; Concrete driveway; 2 parking spaces (including 2 carport spaces)
- Security: Smoke detector; Resident manager; Manager approval required
- Utilities: Public/district water; Public sewer (sewer connected); Natural gas connected; Electricity connected; Telephone available in street; Cable available (or not available depending on location)
- Home design: Single-story mobile home (Model: Westwind, 24' x 60'); Mobile home remains on property; Faces north; One total story; Pillar/post/pier foundation
- Construction: Composition/shingle roof; Aluminum skirting; Pillar/post/pier foundation
- Exterior features: Shingle/composition roof; Awning; Rain gutters; Concrete and tile porch/patio; Porch; In-ground community heated pool; In-ground community heated spa; Aluminum skirting; Shed; Block/masonry fencing; Landscaped lot; Has view
Interior
- Kitchen: Gas cooktop; Gas range; Double oven; Microwave; Dishwasher; Garbage disposal; Kitchen open to family room; Gas water heater
- Bedrooms: Primary bedroom
- Flooring: Laminated flooring
- Bathrooms: 2 full bathrooms; Exhaust fan(s); Walk-in shower
- Heating & cooling: Central heating (natural gas furnace); Central electric cooling
- Interior features: Block walls; Unfurnished; Ceiling fan; Storage space; Screens on windows; Front door entry; One level
- Laundry & utility: Inside laundry area
Neighborhood map
What this means for you Summary
Snapshot
- This is a 2-bed/2.0-bath manufactured listed at $299k.
Deal economics
- At list price, monthly cash flow is $442 ($5k/yr) — positive.
- The deal already cash-flows at list — no discount required.
- Meets the 1% rule at list price ($3k rent vs $299k).
- Recommended offer: $263k (12.0% below list) — sets the bar for market timing.
- Cap rate 8.1% vs local median 2.1% in La Habra — top-decile yield for the area; either an underpriced asset or a hidden risk that comps aren't pricing in. Stress-test before assuming the spread holds.
Location & tenants
- Location reads 65/100 on livability (#384 in CA) — a middle-class / working-renter tenant base. Strengths: commute A+, employment A+; Watch: schools D+, crime D+, health & safety D+.
- Fullerton Joint Union High (suburban): math 51% / reading 66% proficiency, ranked #82 of 517 in CA (top 16%) — acceptable for families but not a draw, mixed tenant base, ~2y average lease.
- Market conditions: Rents rising (+3.4%/yr); 139 active listings in the ZIP; 36 comparable units currently listed for rent nearby; rentals leasing fast (median 5d on market — plan ~1-2 weeks tenant-placement turnaround); solid renter incomes; 6,974 units permitted in Orange County in 2024 (3,839 in 5+ unit buildings).
- This rent runs 37% of the median local income ($104k/yr) — at the standard rent-burdened threshold; future hikes will face affordability resistance.
Forward outlook
- Local home prices are declining (-3.0%/yr); year-one equity from $2k of loan paydown is wiped out by about $9k of value loss. Plan a longer hold.
- Orange County population projected at +14% by 2050 — modest demand growth; plan on rents tracking national, not racing it.
Negotiation context
- It's been on market 135 days — a 12% lower offer ($263k) is reasonable based on typical stale-listing flexibility.
Risks & watch-outs
- Climate carrying-cost: extreme-heat days projected 7→21/yr by 2055 (HVAC capex compounding) — expect insurance premiums to compound above CPI over the hold.
Questions for the listing agent
- It's been on market 135 days. Have you received any prior offers? Is the seller open to a 12% concession, seller financing, or rate buy-down credit?
- Built in 1975 — when were the roof, HVAC, electrical panel, plumbing, and water heater last replaced?
- Why hasn't it sold? Are there any deal-killer items the seller is aware of (foundation, flood, title, zoning, code violations)?
- Is there a deadline driving the sale (1031 exchange, divorce, estate, relocation)? That informs how much negotiation room exists.
- Schools are D-rated, which usually means shorter tenancies and higher turnover. Who's the typical renter profile here, and what's been the actual vacancy rate?
- Crime grade is D in this area — have there been break-ins, vandalism, or insurance claims at this property in the last 3 years? What carrier currently insures it and at what premium?
- The area grade is low — what's the realistic commute time and amenity access for the typical tenant pool here? Any planned neighborhood developments (good or bad) we should know about?
- What's the average days-on-market for RENTAL listings here right now (not sales)? A rising rental-DOM trend means longer vacancies and softer asking-rent achievability than the comps imply.
- What's the recent tenant-quality profile in this submarket — average credit score on applications, eviction rate, late-payment / NSF rate, and stable-employment percentage? A property-management company in the area should have these aggregated.
- How much new for-sale + rental construction is in the pipeline within 1–3 miles? Heavy new supply typically softens prices + rents 12–24 months out; constrained supply supports both.
Investment metrics
- 1% rule
- 1.06% ✓
- Cap rate
- 8.07%
- Cash-on-cash
- 6.34%
- DSCR
- 1.28
- GRM
- 7.8
CMA / ARV
- ARV (on-the-fly)
- $263,520
- Comps found
- 12
Show comp detail 12 sales within ~0.75 mi
| Address | Dist | Beds/Ba | Sqft | Sold | Price | $/sf | Match |
|---|---|---|---|---|---|---|---|
| 2201 Lake Vw #20 | 0.13mi | 2/2.0 | 1,440 (0%) | 1mo | $220,000 | $153 | 94 |
| 1235 Harbor Lk #13 | 0.36mi | 2/2.0 | 1,440 (0%) | 1mo | $228,000 | $158 | 82 |
| 686 Wood Lake Dr #8 | 0.35mi | 2/2.0 | 1,440 (0%) | 7mo | $264,000 | $183 | 78 |
| 2240 Lake Glen Dr #56 | 0.06mi | 2/2.0 | 1,248 (-13%) | 7mo | $338,000 | $271 | 69 |
| 1341 Harbor Lake Ave #24 | 0.22mi | 2/2.0 | 1,296 (-10%) | 5mo | $215,000 | $166 | 69 |
| 1414 W Central #69 | 0.34mi | 3/2.0 (+1) | 1,344 (-7%) | 0mo | $265,000 | $197 | 68 |
| 1414 W Central Ave #88 | 0.34mi | 3/2.0 (+1) | 1,344 (-7%) | 5mo | $255,000 | $190 | 64 |
| 755 Village Lake Mall #337 | 0.35mi | 2/2.0 | 1,296 (-10%) | 6mo | $150,000 | $116 | 62 |
| 1261 Glen Lake Ave #279 | 0.44mi | 2/2.0 | 1,296 (-10%) | 6mo | $149,000 | $115 | 58 |
| 726 Knoll Lake Dr #264 | 0.41mi | 2/2.0 | 1,296 (-10%) | 8mo | $210,000 | $162 | 58 |
| 1414 W Central Ave #81 | 0.34mi | 3/2.0 (+1) | 1,248 (-13%) | 0mo | $289,000 | $232 | 57 |
| 685 View Lake Dr #161 | 0.30mi | 2/2.0 | 1,640 (+14%) | 8mo | $385,000 | $235 | 56 |
Match score weights: distance 35% · size 25% · config 20% · recency 20%. Top-matched comps best support the ARV.
Projected returns pro-forma
-3.0% appreciation · 3.38% rent growth · sell at horizon
- IRR
- -6.1%
- Equity multiple
- 0.77×
- Total profit
- $-19,034
- Equity at exit
- $44,582
- IRR
- 4.0%
- Equity multiple
- 1.30×
- Total profit
- $24,907
- Equity at exit
- $25,852
Cash invested: $83,720 (down + closing). Projections, not guarantees.
Landlord ↔ Tenant lean methodology
- Overall (STATE)
- 18 Strongly Tenant-Friendly
- State California
- 18 Strongly Tenant-Friendly · D+13
- County
- — inherits STATE
- City
- — inherits STATE
ZIP-level market 90631
- Rents YoY
- 3.4%
- Active inventory
- 139
- Price-to-rent
- 7.8×
Monthly cashflow live
- Estimated rent
- $3,175 high interval (Pro) →
- Mortgage (P&I)
- −$1,568
- Tax est. 1.5%
- −$374 /mo · $4,485/yr
- Insurance
- −$125
- HOA
- −$0
- Vacancy / Maint / Mgmt
- −$667
- Net cashflow
- $442
Break-even live
UW: 25.0% down · 7.5% · 30yr · 1.5% tax · 5.0% vac · 8.0% maint · 8.0% mgmt
Financing live
Cash to close
- Down payment
- $74,750
- Closing costs
- $8,970
- Reserves months
- —
- Total cash needed
- —
Loan-product check · same deal, 3 products live
Conventional
25% down · 7.5% · 30yr
- Down + closing
- —
- Monthly P&I
- —
- Monthly cashflow
- —
- DSCR
- —
- Eligible?
- —
Personal DTI + credit; lowest rate.
DSCR
20% down · 8.5% · 30yr
- Down + closing
- —
- Monthly P&I
- —
- Monthly cashflow
- —
- DSCR
- —
- Eligible?
- —
No personal income docs; deal must DSCR.
Hard money
10% down · 12.0% · 12mo
- Down + closing
- —
- Monthly P&I
- —
- Monthly cashflow
- —
- DSCR
- —
- Eligible?
- —
Short-term bridge; refi at stabilization.
Rent comps 36 comps
| Address | Beds | Baths | Sqft | Rent | $/sqft | DOM | Units | Dist |
|---|---|---|---|---|---|---|---|---|
| 1511 Kinsler Ct Brea, CA | 3.0 | 2.5 | 1605 | $4,095 | $2.55 | 15d | 1 | 0.28mi |
| 209 S Fonda St La Habra, CA | 2.0 | 2.0 | 1200 | $3,500 | $2.92 | 1d | 1 | 0.57mi |
| 160 N Fonda St La Habra, CA | 2.0 | 2.0 | 1000 | $2,500 | $2.50 | 1d | 1 | 0.65mi |
| 160 N Fonda St Unit 2 La Habra, CA | 2.0 | 1.5 | 1000 | $2,500 | $2.50 | 1d | 1 | 0.65mi |
| 141 N Fonda St Unit 1 La Habra, CA | 3.0 | 2.5 | 1300 | $3,400 | $2.62 | 10d | 1 | 0.66mi |
| 1500 Eastpark Dr Unit 3 La Habra, CA | 2.0 | 1.5 | 1286 | $2,500 | $1.94 | 1d | 1 | 0.69mi |
| 160 Greentree Ln La Habra, CA | 2.0 | 1.5 | 1050 | $2,800 | $2.67 | 1d | 1 | 0.73mi |
| 171 S Valencia St Unit 3 La Habra, CA | 2.0 | 2.0 | 1000 | $2,450 | $2.45 | 1d | 1 | 0.93mi |
| 1301 Las Riendas Dr La Habra, CA | 1.0–2.0 | 1.0–1.5 | 900 | $2,970 | $3.30 | 1d | 1 | 0.93mi |
| 2598 Associated Rd Fullerton, CA | 2.0 | 2.0 | 988 | $3,535 | $3.58 | 20d | 1 | 0.98mi |
| 2598 Associated Rd Fullerton, CA | 1.0 | 1.0 | 896 | $3,215 | $3.59 | 3d | 1 | 0.98mi |
| 2598 Associated Rd Fullerton, CA | 1.0 | 1.0 | 885 | $3,030 | $3.42 | 16d | 1 | 0.98mi |
| 2598 Associated Rd Fullerton, CA | 1.0 | 1.0 | 885 | $3,280 | $3.71 | 15d | 1 | 0.98mi |
| 1401 S Harbor Blvd La Habra, CA | 1.0–2.0 | 1.0–2.0 | 875 | $2,550 | $2.91 | 1d | 2 | 1.11mi |
| 640 Ward St Unit 2 La Habra, CA | 2.0 | 1.0 | 950 | $2,195 | $2.31 | 16d | 1 | 1.13mi |
| 703 E Stearns Ave Unit 707-C La Habra, CA | 2.0 | 1.0 | 950 | $2,695 | $2.84 | 1d | 1 | 1.13mi |
| 1236 Devonshire Ln La Habra, CA | 3.0 | 2.5 | 1175 | $3,895 | $3.31 | 1d | 1 | 1.18mi |
| 730 Brooklyn Dr Brea, CA | 2.0 | 2.5 | 1210 | $3,400 | $2.81 | 24d | 1 | 1.21mi |
| 350 W Central Ave Brea, CA | 1.0–3.0 | 1.0–2.5 | 1024 | $3,538 | $3.45 | 1d | 8 | 1.23mi |
| 825 Tamarack Ave Brea, CA | 1.0–2.0 | 1.0–2.0 | 837 | $2,640 | $3.15 | 1d | 5 | 1.26mi |
| 650 Tamarack Ave Brea, CA | 2.0 | 1.0–2.0 | 750 | $2,850 | $3.80 | 1d | 18 | 1.28mi |
| 1001 N Harbor Blvd La Habra, CA | 1.0–2.0 | 1.0–1.5 | 880 | $2,750 | $3.12 | 1d | 2 | 1.29mi |
| 319 W Lambert Rd Brea, CA | 2.0 | 2.0 | 1120 | $3,333 | $2.98 | 4d | 9 | 1.29mi |
| 334 S Walnut Ave Unit F Brea, CA | 2.0 | 1.5 | 904 | $2,995 | $3.31 | 16d | 1 | 1.31mi |
| 250 W Central Ave Brea, CA | 2.0 | 2.0 | 1100 | $2,930 | $2.66 | 16d | 2 | 1.37mi |
| 108 E Date St Unit 108 Brea, CA | 2.0 | 1.0 | 950 | $3,095 | $3.26 | 43d | 1 | 1.40mi |
| 843 Bernard Dr Fullerton, CA | 3.0 | 2.0 | 1679 | $5,500 | $3.28 | 10d | 1 | 1.41mi |
| 843 Bernard Dr Fullerton, CA | 3.0 | 2.0 | 1679 | $5,500 | $3.28 | 1d | 1 | 1.41mi |
| 137 N Orange Ave Brea, CA | 2.0 | 2.0 | 975 | $2,585 | $2.65 | 43d | 1 | 1.41mi |
| 715 S Walnut Ave Apt 3 Brea, CA | 2.0 | 2.5 | 1300 | $3,400 | $2.62 | 4d | 1 | 1.42mi |
| 719 S Walnut Ave Brea, CA | 3.0 | 2.0 | 1339 | $3,800 | $2.84 | 43d | 1 | 1.43mi |
| 716 S Walnut Ave Brea, CA | 3.0 | 2.0 | 1357 | $3,800 | $2.80 | 44d | 1 | 1.46mi |
| 101 W Olive Ave Unit A La Habra, CA | 3.0 | 1.5 | 1100 | $2,950 | $2.68 | 17d | 1 | 1.46mi |
| 410 S Orange Ave Unit B Brea, CA | 2.0 | 1.0 | 950 | $2,550 | $2.68 | 43d | 1 | 1.47mi |
| 203 E Elm St Brea, CA | 3.0 | 2.0 | 1142 | $3,800 | $3.33 | 24d | 1 | 1.48mi |
| 655 N Brea Blvd Brea, CA | 1.0–2.0 | 1.0–2.0 | 830 | $2,745 | $3.31 | 1d | 1 | 1.49mi |
Listing history 15 events
-
2026-06-18days on market $299,000 Active 135 DOM
-
2026-06-17days on market $299,000 Active 134 DOM
-
2026-06-16days on market $299,000 Active 133 DOM
-
2026-06-15days on market $299,000 Active 132 DOM
-
2026-06-13days on market $299,000 Active 130 DOM
-
2026-06-09days on market $299,000 Active 126 DOM
-
2026-06-08days on market $299,000 Active 125 DOM
-
2026-06-07days on market $299,000 Active 124 DOM
-
2026-06-04days on market $299,000 Active 121 DOM
-
2026-06-03days on market $299,000 Active 120 DOM
-
2026-06-02days on market $299,000 Active 119 DOM
-
2026-06-01days on market $299,000 Active 118 DOM
-
2026-05-31days on market $299,000 Active 117 DOM
-
2026-04-07price $299,000
-
2026-02-03$304,000 Active
ⓘ Source: listings_history table (triggers on properties + properties_extension) + one-shot
backfill from property_details.listing_events for pre-trigger history.
Climate risk First Street
- Flood 1/10 Low FEMA zone X (unshaded) · 0% chance over 30 yrs
- Wildfire 2/10 Low
- Heat 6/10 Major 7 d/yr ≥96°F today · 21 d/yr by 30 yrs out
- Wind 1/10 Low
- Air quality 5/10 Major 7 unhealthy d/yr today · 9 by 30 yrs out
Nearby sold comps map
Loading sold comps map…
Walkable amenities ~0.75 mi
Loading nearby amenities…
Taxation est. · year 1
- Rental income
- $38,101
- − Mortgage interest
- −$16,749
- − Property taxes
- −$4,485
- − Insurance
- −$1,495
- − Repairs & maintenance
- −$3,048
- − Management
- −$3,048
- − Depreciation
- −$8,698
- Taxable income
- $578
- Est. tax owed @ 24.0%
- −$139
- After-tax cash flow
- $5,165/yr
For passive investors: Depreciation is non-cash, so a rental often shows a tax loss while cash-flowing — sheltering income. Rental losses are passive: they offset passive income freely, and up to $25,000/yr can offset ordinary (W-2) income if you actively participate and your MAGI is under $100k (phasing out to $0 by $150k); unused losses carry forward. On sale, claimed depreciation is recaptured at up to 25%, and gains may owe capital-gains tax (a 1031 exchange can defer both). Figures are a year-1 estimate at your 24.0% rate — not tax advice; consult a CPA.
Schools (NCES district)
- District
- Fullerton Joint Union High
- NCES district ID
- 0614760
- Math proficiency
- 51% ▲ 7.00%
- Reading proficiency
- 66% ▲ 1.00%
- Median HH income
- $66,666
- Composite
- 51.37/100
- National rank
- #1735
- State rank
- #82 of 517 in CA
Livability — La Habra
- Score
- 65/100
- State rank
- #384
- US rank
- #13097
Category grades
Schools grade is shown separately in the Schools card above.
Census & demographics
- Census place
- La Habra, CA
- County
- Orange County · 3,096,323 people
- City population
- 68,309
- Metro
- Los Angeles-Long Beach-Anaheim, CA
- Population (ZIP)
- 68,309
- Household income
- $104,251
- Rent vs Own
- Severe rent burden
- 2093.0
Population outlook (Orange County) Hauer SSP2
- Today (2025)
- 3,477,456 people
- By 2030
- 3,613,117 · +3.9%
- By 2040
- 3,835,945 · +10.3%
- By 2050
- 3,968,736 · +14.1%
- By 2075
- 4,097,053 · +17.8%
- By 2100
- 3,903,633 · +12.3%
Race, ethnicity, and origin ACS 2023
- Neighborhood character
- Diverse neighborhood (Simpson 0.60)
- Race & ethnicity
- Hispanic / Latino 56% White 26% Two or more races 22% Asian 12% Black 2% Native American 2%
- Hispanic origin (detail)
- Mexican 49%
- Common ancestry
- Lithuanian 1% Italian 1% Slovak 1%
- Foreign-born
- 25% · Canada, South Korea, China
- Languages at home
- 53% English-only · Spanish 36% Korean 4% Chinese 2%
Political lean MEDSL · Orange
- 2024 margin
- Toss-up / Even · D 49.7% · R 47.1% · Other 3.2%
- 2008→2024 swing
- +5.2pp toward D · 2008: -2.6pp · 2024: 2.6pp
- All cycles
- 2024: D+2.6 2020: D+9.0 2016: D+7.7 2012: R+8.3 2008: R+2.6
Not yet ingested
- Civics
- —
Market trends
- HPI YoY
- ▼ -757.47%
- Current HPI
- 399.4947
- Rent YoY
- ▲ 3.38%
- Metro
- Los Angeles-Long Beach-Anaheim, CA
- State GDP YoY
- ▲ 3.21%
- F500 in state
- 116
Industry mix (Fortune 500 HQ in CA)
| Industry | F500 HQs | Revenue |
|---|---|---|
| Technology | 27 | $1,492B |
|
||
| Financial Services | 3 | $174B |
|
||
| Retail | 3 | $44B |
|
||
| Insurance | 3 | $26B |
|
||
| Media / Entertainment | 2 | $115B |
|
||
| Pharmaceuticals / Biotech | 2 | $62B |
|
||
Price history
-1.6% since first listed2 events — show timeline
- 2026-04-07 Price Changed $299,000 CRMLS
- 2026-02-03 Listed $304,000 CRMLS
Cash-flow waterfall
monthlySold comps — $/sqft
last 12 mo · ≤1 miLoading sold comps…