514 Seascape 1/13 Share · Isle of Palms, SC
Flood risk 9/10 · Severe
- FEMA flood zone
- AE
- Chance of flooding over 30 yrs
- 0.99%
- Est. flood insurance / yr
- $1,737 – $8,500
Fire risk 3/10 · Minor
- Est. fire insurance / yr
- $783 – $1,453
Heat risk No data
- Hot days now (above threshold)
- —
- Hot days in 30 yrs
- —
Wind risk 9/10 · Severe
- Chance of severe wind over 30 yrs
- 99.0%
Air-quality risk 2/10 · Minimal
- Unhealthy air days now
- 0 days/yr
- Unhealthy air days in 30 yrs
- 1 days/yr
Risk factors via First Street. Map © Google.
Why this score? — see what drove the A- grade
The composite is a weighted blend of 9 inputs, each scored 0–100. Each bar is that input's sub-score; the figure is the points it added to the 100-point composite (weight × sub-score).
- Cash flow +30.0/30.0
- 1% rule +10.0/10.0
- DSCR +10.0/10.0
- Appreciation +8.4/10.0
- ARV discount +7.5/15.0
- Condition / age +4.8/5.0
- Schools +4.3/10.0
- Livability +3.1/5.0
- Rent growth +2.5/5.0
$205,000
🖨 Deal sheet (PDF) 📄 Offer letter ✓ Due diligence
Listing remarks
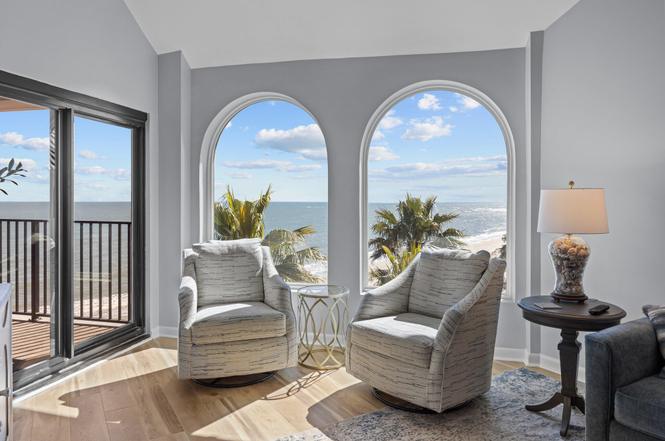
Welcome to Seascape Villas where an extensive 2 year building renovation is now complete and ready for its owners to enjoy breathtaking ocean views. This penthouse (top floor) villa has a new interior design complementing the calming ocean color palettes complete with vaulted ceilings and an open kitchen / dining / living space perfect for spending time with family and friends. 3 bedrooms and 3 bathrooms allow for ample sleeping space. Seascape is located in the renowned Wild Dunes Resort just outside Charleston, SC. Enjoy 4 weeks per year at this stunning villa.
Key facts
- New interior design
- Vaulted ceilings
- Community pool
Tags
Property features AI
Finance
- Other: Located in Wild Dunes community with clubhouse, fitness center, pool, tennis courts, gated access, golf course and memberships available, elevators, security, trash service, and walk/jog trails
- HOA & community: Annual association fee; Association fee: billed annually
Exterior
- Utilities: Public sewer; Dominion Energy (electric); Isle of Palms water/sewer
- Home design: Residential fractional ownership; One-and-one-half story
- Exterior features: Balcony; Beach access and beachfront
Interior
- Kitchen: Dishwasher; Electric range; Microwave; Refrigerator
- Bedrooms: 3 bedrooms; Primary bedroom with ceiling fan(s) and outside access
- Flooring: Ceramic tile; Luxury vinyl
- Bathrooms: 3 bathrooms
- Heating & cooling: Heat pump heating; Central air conditioning
- Interior features: Cathedral/vaulted and smooth ceilings; High ceilings; Living/dining combo; Loft
- Laundry & utility: Laundry room with washer and dryer
Neighborhood map
What this means for you Summary
Snapshot
- This is a 3-bed/3.0-bath single-family listed at $205k. Condition is rated excellent.
Deal economics
- At list price, monthly cash flow is $3k ($33k/yr) — positive.
- The deal already cash-flows at list — no discount required.
- Meets the 1% rule at list price ($6k rent vs $205k).
- Recommended offer: $180k (12.0% below list) — sets the bar for market timing.
Location & tenants
- Location reads 61/100 on livability (#217 in SC) — a middle-class / working-renter tenant base. Strengths: employment A+, crime A-; Watch: housing C-, amenities F, commute F.
- Charleston 01 (urban): math 48% / reading 53% proficiency, ranked #7 of 80 in SC (top 9%) — acceptable for families but not a draw, mixed tenant base, ~2y average lease.
- Zoned schools: Sullivan'S Island Elementary (math 88% / reading 81%, grade A+, #2 of 597 statewide, top 0%, 475 students, 9% FRL); Moultrie Middle (math 68% / reading 74%, grade A, #6 of 229 statewide, top 2%, 1,119 students, 22% FRL); Wando High (math 81% / reading 95%, grade A, #6 of 196 statewide, top 3%, 2,596 students, 19% FRL) — zoned schools average 17% FRL vs 44% district-wide (28 pts lower); this property's tenant base skews higher-income than the district average.
- Zoned-school proficiency averages 81% at this address vs 50% district-wide (+31 pts) — the actual schools serving this property are materially stronger than the Charleston 01 average implies; a family-tenant draw the district grade alone would hide.
- Market conditions: 121 active listings in the ZIP; high-income renter base; 4,156 units permitted in Charleston County in 2024 (857 in 5+ unit buildings).
Forward outlook
- In year one you build about $15k of equity ($1k loan paydown + $14k appreciation (6.8% local appreciation)).
- Charleston County population projected at +44% by 2050 — long-run rental-demand tailwind backs the buy-and-hold thesis.
- At projected returns (6.8% appreciation + 3.0% rent growth), your $57k cash investment doubles in ~2 years — after that, you're playing with house money.
- By year 3, paydown + projected appreciation supports a ~$38k cash-out refi (75% LTV) — recoverable capital for the next deal without selling this one.
Negotiation context
- It's been on market 475 days — a 12% lower offer ($180k) is reasonable based on typical stale-listing flexibility.
- 2 sale attempts with the ask held roughly flat each time — persistent listings suggest the price (not the market) is what's stuck; bring a comps-based counter.
Risks & watch-outs
- Watch-outs: flood insurance adds $427/mo.
- Climate carrying-cost: in FEMA flood zone AE (mandatory federal flood insurance); severe wind risk, 99% chance of damaging wind over 30y — expect insurance premiums to compound above CPI over the hold.
Questions for the listing agent
- It's been on market 475 days. Have you received any prior offers? Is the seller open to a 12% concession, seller financing, or rate buy-down credit?
- What's the actual annual flood-insurance premium (NFIP or private), and is the property in a SFHA with mandatory coverage?
- What does the HOA fee cover, when was the last increase, and are there any pending special assessments or reserve-fund shortfalls?
- Why hasn't it sold? Are there any deal-killer items the seller is aware of (foundation, flood, title, zoning, code violations)?
- Is there a deadline driving the sale (1031 exchange, divorce, estate, relocation)? That informs how much negotiation room exists.
- What's the average days-on-market for RENTAL listings here right now (not sales)? A rising rental-DOM trend means longer vacancies and softer asking-rent achievability than the comps imply.
- What's the recent tenant-quality profile in this submarket — average credit score on applications, eviction rate, late-payment / NSF rate, and stable-employment percentage? A property-management company in the area should have these aggregated.
- How much new for-sale + rental construction is in the pipeline within 1–3 miles? Heavy new supply typically softens prices + rents 12–24 months out; constrained supply supports both.
Investment metrics
- 1% rule
- 3.07% ✓
- Cap rate
- 25.11%
- Cash-on-cash
- 67.21%
- DSCR
- 3.99
- GRM
- 2.7
CMA / ARV
- ARV (on-the-fly)
- $110,592
- Comps found
- 11
Show comp detail 11 sales within ~0.75 mi
| Address | Dist | Beds/Ba | Sqft | Sold | Price | $/sf | Match |
|---|---|---|---|---|---|---|---|
| 311 Seascape (share H) | 0.02mi | 3/3.0 | 1,635 (+6%) | 10mo | $125,000 | $76 | 80 |
| 8000 Palmetto Dr #506 | 0.20mi | 3/3.0 | 1,593 (+4%) | 10mo | $115,000 | $72 | 76 |
| 71 Fairway Dunes Ln | 0.44mi | 3/3.5 | 1,585 (+3%) | 9mo | $1,350,000 | $852 | 65 |
| 36 Pelican Reach | 0.60mi | 3/2.5 | 1,444 (-6%) | 5mo | $1,250,000 | $866 | 56 |
| 55 Fairway Dunes Ln Unit Week 2 | 0.48mi | 3/3.0 | 1,644 (+7%) | 12mo | $100,000 | $61 | 56 |
| 55 Fairway Dunes Ln Unit Week 1 | 0.48mi | 3/3.0 | 1,644 (+7%) | 12mo | $100,000 | $61 | 56 |
| 7600 Palmetto Dr Unit C117 | 0.32mi | 3/3.0 | 1,322 (-14%) | 17mo | $100,000 | $76 | 47 |
| 2 Pelican Reach Unit Share 11 | 0.47mi | 3/2.5 | 1,354 (-12%) | 12mo | $95,000 | $70 | 46 |
| 2 Pelican Reach Unit Share 10 | 0.47mi | 3/2.5 | 1,354 (-12%) | 13mo | $95,000 | $70 | 46 |
| 40 Pelican Reach | 0.63mi | 3/2.5 | 1,703 (+11%) | 7mo | $1,438,000 | $844 | 45 |
| 305 Shipwatch-a (1/13th Share) Dr | 0.31mi | 3/3.0 | 1,322 (-14%) | 21mo | $92,500 | $70 | 45 |
Match score weights: distance 35% · size 25% · config 20% · recency 20%. Top-matched comps best support the ARV.
Projected returns pro-forma
6.84% appreciation · 3.0% rent growth · sell at horizon
- IRR
- 67.4%
- Equity multiple
- 5.32×
- Total profit
- $247,731
- Equity at exit
- $139,924
- IRR
- 63.7%
- Equity multiple
- 11.25×
- Total profit
- $588,553
- Equity at exit
- $263,881
Cash invested: $57,400 (down + closing). Projections, not guarantees.
Landlord ↔ Tenant lean methodology
- Overall (STATE)
- 90 Strongly Landlord-Friendly
- State South Carolina
- 90 Strongly Landlord-Friendly · R+6
- County
- — inherits STATE
- City
- — inherits STATE
ZIP-level market 29451
- Home prices YoY
- 2.0%
- Active inventory
- 121
- Price-to-rent
- 2.7×
Monthly cashflow live
- Estimated rent
- $6,284 medium interval (Pro) →
- Mortgage (P&I)
- −$1,075
- Tax est. 1.5%
- −$256 /mo · $3,075/yr
- Insurance
- −$85
- Flood insurance flood zone
- −$427 /mo · $5,118/yr
- HOA
- −$333
- Vacancy / Maint / Mgmt
- −$1,320
- Net cashflow
- $2,788
Break-even live
Sensitivity live
| Price | -10% $2,930 | -5% $2,859 | +0% $2,788 | +5% $2,718 | +10% $2,647 |
|---|---|---|---|---|---|
| Rent | -10% $2,292 | -5% $2,540 | +0% $2,788 | +5% $3,037 | +10% $3,285 |
| Rate | -1.0pp $2,892 | -0.5pp $2,840 | base $2,788 | +0.5pp $2,735 | +1.0pp $2,681 |
UW: 25.0% down · 7.5% · 30yr · 1.5% tax · 5.0% vac · 8.0% maint · 8.0% mgmt
Financing live
Cash to close
- Down payment
- $51,250
- Closing costs
- $6,150
- Reserves months
- —
- Total cash needed
- —
Loan-product check · same deal, 3 products live
Conventional
25% down · 7.5% · 30yr
- Down + closing
- —
- Monthly P&I
- —
- Monthly cashflow
- —
- DSCR
- —
- Eligible?
- —
Personal DTI + credit; lowest rate.
DSCR
20% down · 8.5% · 30yr
- Down + closing
- —
- Monthly P&I
- —
- Monthly cashflow
- —
- DSCR
- —
- Eligible?
- —
No personal income docs; deal must DSCR.
Hard money
10% down · 12.0% · 12mo
- Down + closing
- —
- Monthly P&I
- —
- Monthly cashflow
- —
- DSCR
- —
- Eligible?
- —
Short-term bridge; refi at stabilization.
HOA detail
- Monthly dues
- $333 · $3,996/yr
Listing history 15 events
-
2026-06-18days on market $205,000 Active 475 DOM
-
2026-06-17days on market $205,000 Active 474 DOM
-
2026-06-16days on market $205,000 Active 473 DOM
-
2026-06-15days on market $205,000 Active 472 DOM
-
2026-06-10days on market $205,000 Active 467 DOM
-
2026-06-09days on market $205,000 Active 466 DOM
-
2026-06-08days on market $205,000 Active 465 DOM
-
2026-06-07days on market $205,000 Active 464 DOM
-
2026-06-05days on market $205,000 Active 461 DOM
-
2026-06-03days on market $205,000 Active 460 DOM
-
2026-06-01days on market $205,000 Active 458 DOM
-
2026-05-31days on market $205,000 Active 457 DOM
-
2026-03-03status Active
-
2026-02-28historical
-
2025-02-24$205,000 Active
ⓘ Source: listings_history table (triggers on properties + properties_extension) + one-shot
backfill from property_details.listing_events for pre-trigger history.
Climate risk First Street
- Flood 9/10 Extreme FEMA zone AE · 99% chance over 30 yrs
- Wildfire 3/10 Moderate
- Wind 9/10 Extreme 99% chance of damaging wind over 30 yrs
- Air quality 2/10 Low 0 unhealthy d/yr today · 1 by 30 yrs out
Nearby sold comps map
Loading sold comps map…
Walkable amenities ~0.75 mi
Loading nearby amenities…
Taxation est. · year 1
- Rental income
- $75,412
- − Mortgage interest
- −$11,483
- − Property taxes
- −$3,075
- − Insurance
- −$6,144
- − Repairs & maintenance
- −$6,033
- − Management
- −$6,033
- − HOA
- −$3,996
- − Depreciation
- −$5,964
- Taxable income
- $32,685
- Est. tax owed @ 24.0%
- −$7,844
- After-tax cash flow
- $25,616/yr
For passive investors: Depreciation is non-cash, so a rental often shows a tax loss while cash-flowing — sheltering income. Rental losses are passive: they offset passive income freely, and up to $25,000/yr can offset ordinary (W-2) income if you actively participate and your MAGI is under $100k (phasing out to $0 by $150k); unused losses carry forward. On sale, claimed depreciation is recaptured at up to 25%, and gains may owe capital-gains tax (a 1031 exchange can defer both). Figures are a year-1 estimate at your 24.0% rate — not tax advice; consult a CPA.
Condition & rehab AI · 13 photos
This penthouse villa is in excellent condition with a modern interior and ocean views. It is move-in ready and would benefit from some minor updates to the exterior and interior to further enhance its appeal.
Value-add opportunities
- Both Painting the exterior and interior walls — Fresh paint can enhance the curb appeal and interior aesthetics, making the property more attractive to potential buyers and renters.
- Both Updating the kitchen backsplash — A fresh backsplash can add a modern touch to the kitchen and make it more appealing to potential buyers and renters.
- Both Landscaping improvements — Enhancing the landscaping around the pool and exterior can improve the curb appeal and make the property more attractive to potential buyers and renters.
Renovation cost estimate screening
Value-add ROI direction
- Both Painting the exterior and interior walls — Fresh paint can enhance the curb appeal and interior aesthetics, making the property more attractive to potential buyers and renters. ↑
- Both Updating the kitchen backsplash — A fresh backsplash can add a modern touch to the kitchen and make it more appealing to potential buyers and renters. ↑
- Both Landscaping improvements — Enhancing the landscaping around the pool and exterior can improve the curb appeal and make the property more attractive to potential buyers and renters. ↑
ⓘ Cost ranges are severity-bucket heuristics (US national rule-of-thumb). Get contractor quotes + a written scope before underwriting a rehab budget.
Schools (NCES district)
- District
- Charleston 01
- NCES district ID
- 4501440
- Math proficiency
- 48% ▼ -2.00%
- Reading proficiency
- 53% ▬ 0.00%
- Median HH income
- $52,376
- Composite
- 43.41/100
- National rank
- #3018
- State rank
- #7 of 80 in SC
Livability — Isle of Palms
- Score
- 61/100
- State rank
- #217
- US rank
- #18296
Category grades
Schools grade is shown separately in the Schools card above.
Census & demographics
- Census place
- Isle of Palms, SC
- County
- Charleston County · 366,793 people
- City population
- 4,362
- Metro
- Charleston-North Charleston, SC
- Population (ZIP)
- 4,362
- Household income
- $156,979
- Rent vs Own
- Severe rent burden
- 20.0
Population outlook (Charleston County) Hauer SSP2
- Today (2025)
- 480,562 people
- By 2030
- 525,921 · +9.4%
- By 2040
- 612,189 · +27.4%
- By 2050
- 691,627 · +43.9%
- By 2075
- 847,979 · +76.5%
- By 2100
- 926,482 · +92.8%
Race, ethnicity, and origin ACS 2023
- Neighborhood character
- Predominantly White (97%)
- Race & ethnicity
- White 97% Asian 2%
- Common ancestry
- Lithuanian 5% Slovak 4% Scotch-Irish 2%
- Foreign-born
- 7% · China, Canada
- Languages at home
- 92% English-only · French/Haitian/Cajun 3% Other Asian/Pacific 3% Spanish 1%
Political lean MEDSL · Charleston
- 2024 margin
- Lean D (+5.7) · D 51.9% · R 46.3% · Other 1.8%
- 2008→2024 swing
- -2.7pp toward R · 2008: 8.3pp · 2024: 5.7pp
- All cycles
- 2024: D+5.7 2020: D+12.9 2016: D+7.9 2012: D+2.4 2008: D+8.3
Not yet ingested
- Civics
- —
Market trends
- HPI YoY
- ▲ 6.84%
- Current HPI
- 348.8655
- Rent YoY
- —
- Metro
- Charleston-North Charleston, SC
- State GDP YoY
- ▲ 4.51%
- F500 in state
- 2
Industry mix (Fortune 500 HQ in SC)
| Industry | F500 HQs | Revenue |
|---|---|---|
| Packaging | 1 | $7B |
|
||
Price history
3 events — show timeline
- 2026-03-03 Relisted — Charleston Trident MLS
- 2026-02-28 Listing Removed — Charleston Trident MLS
- 2025-02-24 Listed $205,000 Charleston Trident MLS
Cash-flow waterfall
monthlySold comps — $/sqft
last 12 mo · ≤1 miLoading sold comps…