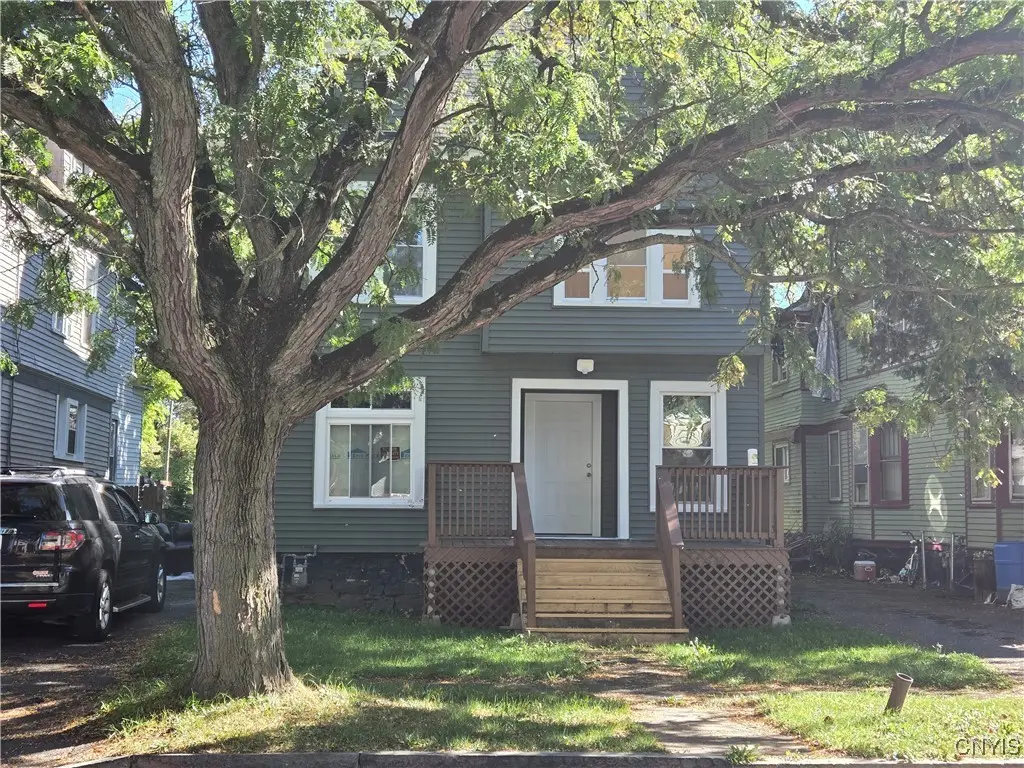
147 Coolidge Ave · Syracuse, NY
Flood risk 7/10 · Major
- FEMA flood zone
- AE
- Chance of flooding over 30 yrs
- 0.76%
- Est. flood insurance / yr
- $2,026 – $9,024
Fire risk 1/10 · Minimal
- Est. fire insurance / yr
- $691 – $1,283
Heat risk 3/10 · Minor
- Hot days now (above 95°F)
- 7 days/yr
- Hot days in 30 yrs
- 16 days/yr
Wind risk 1/10 · Minimal
- Chance of severe wind over 30 yrs
- 0.0%
Air-quality risk 2/10 · Minimal
- Unhealthy air days now
- 0 days/yr
- Unhealthy air days in 30 yrs
- 1 days/yr
Risk factors via First Street. Map © Google.
Why this score? — see what drove the B grade
The composite is a weighted blend of 9 inputs, each scored 0–100. Each bar is that input's sub-score; the figure is the points it added to the 100-point composite (weight × sub-score).
- Cash flow +30.0/30.0
- DSCR +10.0/10.0
- Appreciation +10.0/10.0
- 1% rule +7.5/10.0
- Rent growth +4.6/5.0
- Livability +3.9/5.0
- Condition / age +2.5/5.0
- Schools +1.8/10.0
- ARV discount +0.0/15.0
$149,900
🖨 Deal sheet (PDF) 📄 Offer letter ✓ Due diligence
Listing remarks MLS
Lead remediated and ready to go. Like New home all remodeled and ready to make this your home. New roof, siding, windows, plumbing and so much more. Large eat in kitchen, formal dining room, living room, and 1/2 bath on 1st floor. 2nd floor has 4 bedrooms and full bath. Large yard and paved driveway. Lead tested and remediated.
Key facts
- New plumbing
- Large eat in kitchen
- New siding
Tags
Neighborhood map
What this means for you Summary
Snapshot
- This is a 4-bed/1.0-bath single-family listed at $150k.
Deal economics
- At list price, monthly cash flow is $111 ($1k/yr) — positive.
- The deal already cash-flows at list — no discount required.
- Meets the 1% rule at list price ($2k rent vs $150k).
- Recommended offer: $136k (9.0% below list) — sets the bar for market timing.
Location & tenants
- Location reads 77/100 on livability (#187 in NY, #2,869 nationally) — a middle-class / working-renter tenant base. Strengths: amenities A+, commute A+, cost of living A+; Watch: crime F, employment D-.
- Syracuse City School District (urban): math 18% / reading 26% proficiency, ranked #590 of 590 in NY (top 100%) — low school quality limits family demand, transient renter base, plan for 1-2y turnover; 74% free/reduced lunch — lower-income household profile, screen leases tightly.
- Zoned schools: Syracuse Latin School (math 31% / reading 62%, grade D-, #1,262 of 2,108 statewide, top 60%, 642 students, 42% FRL); Expeditionary Learning Middle School (math 17% / reading 32%, grade F, #611 of 729 statewide, top 88%, 170 students, 76% FRL); Institute of Technology At Syracuse Central (math 87% / reading 92%, grade A+, #265 of 1,100 statewide, top 26%, 581 students, 68% FRL).
- Zoned-school proficiency averages 54% at this address vs 22% district-wide (+32 pts) — the actual schools serving this property are materially stronger than the Syracuse City School District average implies; a family-tenant draw the district grade alone would hide.
- Market conditions: Rents rising fast (+8.2%/yr); 121 active listings in the ZIP; 15 comparable units currently listed for rent nearby; rentals at typical pace (median 23d on market — plan ~3-4 weeks tenant-placement turnaround); 616 units permitted in Onondaga County in 2024 (256 in 5+ unit buildings).
Forward outlook
- In year one you build about $16k of equity ($1k loan paydown + $15k appreciation (10.0% local appreciation)).
- Onondaga County population projected to shrink 9% by 2050 — rents likely to lag national; underwrite the cash flow, not the appreciation.
- At projected returns (10.0% appreciation + 8.0% rent growth), your $42k cash investment doubles in ~3 years — after that, you're playing with house money.
- By year 3, paydown + projected appreciation supports a ~$41k cash-out refi (75% LTV) — recoverable capital for the next deal without selling this one.
Negotiation context
- It's been on market 95 days — a 9% lower offer ($136k) is reasonable based on typical stale-listing flexibility.
- 2 sale attempts; this cycle's ask has dropped $15k (9%) from the opening price — seller is motivated, your offer sets the floor, not the list.
- Current owner paid $12k; list at $150k implies a 1203% gain — meaningful room to come down on a strong offer.
Risks & watch-outs
- Watch-outs: flood insurance adds $460/mo; built in 1900 — expect roof / HVAC / electrical / plumbing capex.
Questions for the listing agent
- It's been on market 95 days. Have you received any prior offers? Is the seller open to a 9% concession, seller financing, or rate buy-down credit?
- Built in 1900 — when were the roof, HVAC, electrical panel, plumbing, and water heater last replaced?
- What's the actual annual flood-insurance premium (NFIP or private), and is the property in a SFHA with mandatory coverage?
- Why hasn't it sold? Are there any deal-killer items the seller is aware of (foundation, flood, title, zoning, code violations)?
- Is there a deadline driving the sale (1031 exchange, divorce, estate, relocation)? That informs how much negotiation room exists.
- Schools are D-rated, which usually means shorter tenancies and higher turnover. Who's the typical renter profile here, and what's been the actual vacancy rate?
- Crime grade is F in this area — have there been break-ins, vandalism, or insurance claims at this property in the last 3 years? What carrier currently insures it and at what premium?
- What's the average days-on-market for RENTAL listings here right now (not sales)? A rising rental-DOM trend means longer vacancies and softer asking-rent achievability than the comps imply.
- What's the recent tenant-quality profile in this submarket — average credit score on applications, eviction rate, late-payment / NSF rate, and stable-employment percentage? A property-management company in the area should have these aggregated.
- How much new for-sale + rental construction is in the pipeline within 1–3 miles? Heavy new supply typically softens prices + rents 12–24 months out; constrained supply supports both.
Investment metrics
- 1% rule
- 1.25% ✓
- Cap rate
- 10.87%
- Cash-on-cash
- 16.35%
- DSCR
- 1.73
- GRM
- 6.7
CMA / ARV
- ARV (median comp)
- $121,212
- List price
- $149,900
- Delta
- 23.67%
- Verdict
- OVERPRICED
- Comps
- 20 within 1.0 mi
Show comp detail 12 sales within ~0.75 mi
| Address | Dist | Beds/Ba | Sqft | Sold | Price | $/sf | Match |
|---|---|---|---|---|---|---|---|
| 326 Coolidge Ave | 0.23mi | 4/1.0 | 1,578 (-7%) | 5mo | $107,000 | $68 | 74 |
| 806 Tallman St | 0.20mi | 4/1.5 | 1,938 (+14%) | 1mo | $140,000 | $72 | 64 |
| 412 Roberts Ave | 0.58mi | 4/1.0 | 1,639 (-3%) | 7mo | $219,300 | $134 | 62 |
| 404 Tioga St | 0.70mi | 4/2.0 | 1,680 (-1%) | 6mo | $118,500 | $71 | 57 |
| 101 Bradley St | 0.45mi | 4/2.0 | 1,604 (-5%) | 12mo | $99,000 | $62 | 56 |
| 1110 Midland Ave | 0.70mi | 4/1.5 | 1,751 (+4%) | 6mo | $70,000 | $40 | 55 |
| 108 Congress Ave | 0.40mi | 4/2.0 | 1,516 (-10%) | 11mo | $44,000 | $29 | 51 |
| 520 Stinard Ave | 0.67mi | 4/1.5 | 1,752 (+4%) | 13mo | $199,000 | $114 | 50 |
| 626 Roberts Ave | 0.73mi | 4/1.5 | 1,760 (+4%) | 10mo | $235,000 | $134 | 49 |
| 413 Fitch St | 0.72mi | 3/2.0 (-1) | 1,624 (-4%) | 9mo | $50,000 | $31 | 44 |
| 310 Merriman Ave | 0.51mi | 4/1.5 | 1,469 (-13%) | 11mo | $130,000 | $88 | 43 |
| 505 Stinard Ave | 0.63mi | 4/2.0 | 1,496 (-12%) | 7mo | $242,500 | $162 | 42 |
Match score weights: distance 35% · size 25% · config 20% · recency 20%. Top-matched comps best support the ARV.
Projected returns pro-forma
10.0% appreciation · 8.0% rent growth · sell at horizon
- IRR
- 29.1%
- Equity multiple
- 3.36×
- Total profit
- $98,880
- Equity at exit
- $135,042
- IRR
- 27.2%
- Equity multiple
- 8.40×
- Total profit
- $310,624
- Equity at exit
- $291,223
Cash invested: $41,972 (down + closing). Projections, not guarantees.
Landlord ↔ Tenant lean methodology
- Overall (STATE)
- 15 Strongly Tenant-Friendly
- State New York
- 15 Strongly Tenant-Friendly · D+10
- County
- — inherits STATE
- City
- — inherits STATE
ZIP-level market 13204
- Home prices YoY
- 31.6%
- Rents YoY
- 8.2%
- Active inventory
- 121
- Price-to-rent
- 6.7×
Monthly cashflow live
- Estimated rent
- $1,875 high interval (Pro) →
- Mortgage (P&I)
- −$786
- Tax from tax record
- −$61 /mo · $734/yr
- Insurance
- −$62
- Flood insurance flood zone
- −$460 /mo · $5,525/yr
- HOA
- −$0
- Vacancy / Maint / Mgmt
- −$394
- Net cashflow
- $111
Break-even live
Sensitivity live
| Price | -10% $196 | -5% $154 | +0% $111 | +5% $69 | +10% $27 |
|---|---|---|---|---|---|
| Rent | -10% $-37 | -5% $37 | +0% $111 | +5% $185 | +10% $260 |
| Rate | -1.0pp $187 | -0.5pp $150 | base $111 | +0.5pp $73 | +1.0pp $33 |
UW: 25.0% down · 7.5% · 30yr · 1.5% tax · 5.0% vac · 8.0% maint · 8.0% mgmt
Financing live
Cash to close
- Down payment
- $37,475
- Closing costs
- $4,497
- Reserves months
- —
- Total cash needed
- —
Loan-product check · same deal, 3 products live
Conventional
25% down · 7.5% · 30yr
- Down + closing
- —
- Monthly P&I
- —
- Monthly cashflow
- —
- DSCR
- —
- Eligible?
- —
Personal DTI + credit; lowest rate.
DSCR
20% down · 8.5% · 30yr
- Down + closing
- —
- Monthly P&I
- —
- Monthly cashflow
- —
- DSCR
- —
- Eligible?
- —
No personal income docs; deal must DSCR.
Hard money
10% down · 12.0% · 12mo
- Down + closing
- —
- Monthly P&I
- —
- Monthly cashflow
- —
- DSCR
- —
- Eligible?
- —
Short-term bridge; refi at stabilization.
Rent comps 15 comps
| Address | Beds | Baths | Sqft | Rent | $/sqft | DOM | Units | Dist |
|---|---|---|---|---|---|---|---|---|
| 326 Holland St Unit 1 Syracuse, NY | 3.0 | 1.0 | 2100 | $1,825 | $0.87 | 45d | 1 | 0.23mi |
| 318 Kellogg St Unit 2 Syracuse, NY | 3.0 | 1.0 | 1523 | $1,675 | $1.10 | 45d | 1 | 0.29mi |
| 318 Kellogg St Unit 1 Syracuse, NY | 3.0 | 1.0 | 1523 | $1,650 | $1.08 | 45d | 1 | 0.29mi |
| 122 Putnam St Syracuse, NY | 3.0 | 1.0 | 1064 | $2,050 | $1.93 | 22d | 1 | 0.29mi |
| 409 Stolp Ave Syracuse, NY | 1.0–3.0 | 1.0 | 849 | $1,575 | $1.86 | 15d | 5 | 0.49mi |
| 1110 Bellevue Ave Syracuse, NY | 3.0 | 1.0 | 1449 | $1,500 | $1.04 | 45d | 1 | 0.52mi |
| 214 Rowland St Syracuse, NY | 4.0 | 1.0 | 2092 | $1,800 | $0.86 | 15d | 1 | 0.53mi |
| 315 Grant Ave #17 Syracuse, NY | 3.0 | 2.0 | 1477 | $1,275 | $0.86 | 15d | 1 | 0.68mi |
| 269 W Borden Ave Syracuse, NY | 4.0 | 1.5 | 1800 | $650 | $0.36 | 22d | 1 | 0.80mi |
| 1330 Midland Ave Syracuse, NY | 4.0 | 1.0 | 1870 | $2,000 | $1.07 | 22d | 1 | 0.82mi |
| 121 Whittier Ave Syracuse, NY | 4.0 | 1.0 | 1400 | $600 | $0.43 | 45d | 1 | 1.16mi |
| 213 Fletcher Ave Unit 2 Syracuse, NY | 3.0 | 1.0 | 1200 | $1,700 | $1.42 | 15d | 1 | 1.29mi |
| 349 Bryant Ave Syracuse, NY | 3.0 | 1.5 | 1500 | $2,300 | $1.53 | 15d | 1 | 1.33mi |
| 447 E Washington St Syracuse, NY | 3.0 | 1.5 | 2095 | $2,100 | $1.00 | 15d | 1 | 1.38mi |
| 2331 Midland Ave Syracuse, NY | 4.0 | 1.5 | 1664 | $2,300 | $1.38 | 22d | 1 | 1.42mi |
Listing history 20 events
-
2026-06-18days on market $149,900 Active 95 DOM
-
2026-06-17days on market $149,900 Active 94 DOM
-
2026-06-16days on market $149,900 Active 93 DOM
-
2026-06-15days on market $149,900 Active 92 DOM
-
2026-06-14days on market $149,900 Active 90 DOM
-
2026-06-13days on market $149,900 Active 89 DOM
-
2026-06-10days on market $149,900 Active 87 DOM
-
2026-06-09days on market $149,900 Active 86 DOM
-
2026-06-08days on market $149,900 Active 85 DOM
-
2026-06-07days on market $149,900 Active 84 DOM
-
2026-06-05days on market $149,900 Active 81 DOM
-
2026-06-02days on market $149,900 Active 79 DOM
-
2026-06-01days on market $149,900 Active 78 DOM
-
2026-05-31days on market $149,900 Active 77 DOM
-
2026-05-30days on market $149,900 Active 76 DOM
-
2026-05-15status Active 329-char remark
Show marketing remark (329 chars)
Lead remediated and ready to go. Like New home all remodeled and ready to make this your home. New roof, siding, windows, plumbing and so much more. Large eat in kitchen, formal dining room, living room, and 1/2 bath on 1st floor. 2nd floor has 4 bedrooms and full bath. Large yard and paved driveway. Lead tested and remediated.
-
2026-03-20status Pending 329-char remark
Show marketing remark (329 chars)
Lead remediated and ready to go. Like New home all remodeled and ready to make this your home. New roof, siding, windows, plumbing and so much more. Large eat in kitchen, formal dining room, living room, and 1/2 bath on 1st floor. 2nd floor has 4 bedrooms and full bath. Large yard and paved driveway. Lead tested and remediated.
-
2026-02-19price $159,900 329-char remark
Show marketing remark (329 chars)
Lead remediated and ready to go. Like New home all remodeled and ready to make this your home. New roof, siding, windows, plumbing and so much more. Large eat in kitchen, formal dining room, living room, and 1/2 bath on 1st floor. 2nd floor has 4 bedrooms and full bath. Large yard and paved driveway. Lead tested and remediated.
-
2026-01-18$164,900 Active 329-char remark
Show marketing remark (329 chars)
Lead remediated and ready to go. Like New home all remodeled and ready to make this your home. New roof, siding, windows, plumbing and so much more. Large eat in kitchen, formal dining room, living room, and 1/2 bath on 1st floor. 2nd floor has 4 bedrooms and full bath. Large yard and paved driveway. Lead tested and remediated.
-
2009-04-22soldstatus $11,500
ⓘ Source: listings_history table (triggers on properties + properties_extension) + one-shot
backfill from property_details.listing_events for pre-trigger history.
Tax reassessment forecast NY · Partial reset (capped growth)
- Current annual tax
- $734 · $61/mo
- Projected year-2 tax
- $1,634 · $136/mo
- Expected delta
- +$900/yr (+$75/mo · 122.6%)
ⓘ Screening estimate from a state-policy table — verify with the county assessor before closing.
Climate risk First Street
- Flood 7/10 Severe FEMA zone AE · 76% chance over 30 yrs
- Wildfire 1/10 Low
- Heat 3/10 Moderate 7 d/yr ≥95°F today · 16 d/yr by 30 yrs out
- Wind 1/10 Low 0% chance of damaging wind over 30 yrs
- Air quality 2/10 Low 0 unhealthy d/yr today · 1 by 30 yrs out
Nearby sold comps map
Loading sold comps map…
Walkable amenities ~0.75 mi
Loading nearby amenities…
Taxation est. · year 1
- Rental income
- $22,505
- − Mortgage interest
- −$8,397
- − Property taxes
- −$734
- − Insurance
- −$6,274
- − Repairs & maintenance
- −$1,800
- − Management
- −$1,800
- − Depreciation
- −$4,361
- Taxable loss
- −$862
- Est. tax savings @ 24.0%
- +$207
- After-tax cash flow
- $1,544/yr
For passive investors: Depreciation is non-cash, so a rental often shows a tax loss while cash-flowing — sheltering income. Rental losses are passive: they offset passive income freely, and up to $25,000/yr can offset ordinary (W-2) income if you actively participate and your MAGI is under $100k (phasing out to $0 by $150k); unused losses carry forward. On sale, claimed depreciation is recaptured at up to 25%, and gains may owe capital-gains tax (a 1031 exchange can defer both). Figures are a year-1 estimate at your 24.0% rate — not tax advice; consult a CPA.
Schools (NCES district)
- District
- Syracuse City School District
- NCES district ID
- 3628590
- Math proficiency
- 18% ▼ -5.00%
- Reading proficiency
- 26% ▬ 0.00%
- Median HH income
- $32,097
- Composite
- 17.83/100
- National rank
- #9007
- State rank
- #590 of 590 in NY
Livability — Syracuse
- Score
- 77/100
- State rank
- #187
- US rank
- #2869
Category grades
Schools grade is shown separately in the Schools card above.
Census & demographics
- Census place
- Syracuse, NY
- County
- Onondaga County · 247,257 people
- City population
- 152,627
- Metro
- Syracuse, NY
- Population (ZIP)
- 19,440
- Household income
- $45,351
- Rent vs Own
- Severe rent burden
- 2073.0
Population outlook (Onondaga County) Hauer SSP2
- Today (2025)
- 467,894 people
- By 2030
- 463,381 · -1.0%
- By 2040
- 447,697 · -4.3%
- By 2050
- 426,399 · -8.9%
- By 2075
- 373,661 · -20.1%
- By 2100
- 307,967 · -34.2%
Race, ethnicity, and origin ACS 2023
- Neighborhood character
- Diverse neighborhood (Simpson 0.68)
- Race & ethnicity
- White 47% Black 26% Hispanic / Latino 17% Two or more races 13% Native American 1%
- Hispanic origin (detail)
- Puerto Rican 12% Cuban 2% Dominican 1%
- Common ancestry
- Romanian 5% Lithuanian 2% Subsaharan African 2%
- Foreign-born
- 7% · Canada, Jamaica
- Languages at home
- 83% English-only · Spanish 11% Russian/Polish/Slavic 3% Arabic 1%
Political lean MEDSL · Onondaga
- 2024 margin
- D (+17.3) · D 58.6% · R 41.4%
- 2008→2024 swing
- -3.0pp toward R · 2008: 20.3pp · 2024: 17.3pp
- All cycles
- 2024: D+17.3 2020: D+20.6 2016: D+12.8 2012: D+21.1 2008: D+20.3
Not yet ingested
- Civics
- —
Market trends
- HPI YoY
- ▲ 100.14%
- Current HPI
- 416.7272
- Rent YoY
- ▲ 8.24%
- Metro
- Syracuse, NY
- State GDP YoY
- ▲ 2.60%
- F500 in state
- 92
Industry mix (Fortune 500 HQ in NY)
| Industry | F500 HQs | Revenue |
|---|---|---|
| Financial Services | 10 | $950B |
|
||
| Consumer Goods | 9 | $162B |
|
||
| Insurance | 4 | $225B |
|
||
| Telecommunications | 2 | $144B |
|
||
| Pharmaceuticals | 2 | $112B |
|
||
| Media / Entertainment | 2 | $69B |
|
||
Price history
+1290.4% since first listed5 events — show timeline
- 2026-05-15 Relisted — CNYIS
- 2026-03-20 Pending — CNYIS
- 2026-02-19 Price Changed $159,900 CNYIS
- 2026-01-18 Listed $164,900 CNYIS
- 2009-04-22 Sold (Public Records) $11,500 Public Records
Property tax history
+0.0%/yrLatest (2025): $734 · +0.0% YoY. Source: county tax records.
Cash-flow waterfall
monthlySold comps — $/sqft
last 12 mo · ≤1 miLoading sold comps…