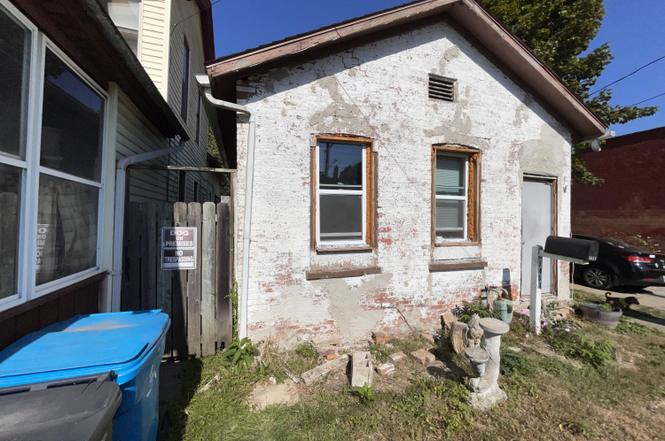
1431 N Michigan St · Toledo, OH
Flood risk 1/10 · Minimal
- FEMA flood zone
- X (unshaded)
- Chance of flooding over 30 yrs
- 0.0%
- Est. flood insurance / yr
- $507 – $1,088
Fire risk 1/10 · Minimal
- Est. fire insurance / yr
- $713 – $1,323
Heat risk 3/10 · Minor
- Hot days now (above 100°F)
- 7 days/yr
- Hot days in 30 yrs
- 16 days/yr
Wind risk 2/10 · Minimal
- Chance of severe wind over 30 yrs
- —
Air-quality risk 2/10 · Minimal
- Unhealthy air days now
- 1 days/yr
- Unhealthy air days in 30 yrs
- 3 days/yr
Risk factors via First Street. Map © Google.
Why this score? — see what drove the B grade
The composite is a weighted blend of 9 inputs, each scored 0–100. Each bar is that input's sub-score; the figure is the points it added to the 100-point composite (weight × sub-score).
- Cash flow +30.0/30.0
- 1% rule +10.0/10.0
- DSCR +10.0/10.0
- ARV discount +7.5/15.0
- Appreciation +6.2/10.0
- Livability +3.3/5.0
- Rent growth +2.5/5.0
- Condition / age +2.5/5.0
- Schools +1.6/10.0
$39,900
🖨 Deal sheet 📄 Offer letter ✓ Due diligence
Listing remarks MLS
Tiny home with over 125 years of history. Needs work but a great investment! Call now!
Key facts
- Tenant occupied
- Off-street parking
- 2,900 sq ft lot
Tags
Property features AI
Exterior
- Parking: Off-street parking for 1 vehicle
- Utilities: Electricity connected (100 Amp service); Natural gas connected; Public water; Public sewer
- Home design: Single-family residence; One story
- Construction: Brick and other construction materials; Other foundation details
- Exterior features: Shingle roof
Interior
- Kitchen: Main-level kitchen (approximately 8 x 10)
- Bedrooms: Bedroom 2 on the main level (approximately 10 x 12)
- Flooring: Other flooring
- Bathrooms: 1 full bathroom
- Heating & cooling: Forced air heating; Natural gas heating
- Interior features: Five total rooms; Other interior details
- Laundry & utility: Accessible utilities or laundry
Neighborhood map
What this means for you Summary
Snapshot
- This is a 1-bed/1.0-bath single-family listed at $40k.
Deal economics
- At list price, monthly cash flow is $581 ($7k/yr) — positive.
- The deal already cash-flows at list — no discount required.
- Meets the 1% rule at list price ($1k rent vs $40k).
- Cap rate 23.8% vs local median 7.6% in Toledo — top-decile yield for the area; either an underpriced asset or a hidden risk that comps aren't pricing in. Stress-test before assuming the spread holds.
Location & tenants
- Location reads 66/100 on livability (#645 in OH) — a middle-class / working-renter tenant base. Strengths: cost of living A+, housing A+, health & safety A+; Watch: amenities C-, crime F, commute F.
- Toledo City (urban): math 15% / reading 24% proficiency, ranked #634 of 656 in OH (top 97%) — low school quality limits family demand, transient renter base, plan for 1-2y turnover; 72% free/reduced lunch — lower-income household profile, screen leases tightly.
- Zoned schools: Riverside Elementary School (math 8% / reading 12%, grade F, #1,471 of 1,584 statewide, top 95%, 361 students, 0% FRL); Woodward High School (math 2% / reading 22%, grade F, #726 of 781 statewide, top 94%, 672 students, 0% FRL) — zoned schools average 0% FRL vs 72% district-wide (72 pts lower); this property's tenant base skews higher-income than the district average.
- Market conditions: 16 active listings in the ZIP; 10 comparable units currently listed for rent nearby; rentals at typical pace (median 24d on market — plan ~3-4 weeks tenant-placement turnaround); 40% of comp listings sitting > 30 days — soft ceiling on asking rent; lower-income renter base — watch delinquency; 415 units permitted in Lucas County in 2024 (122 in 5+ unit buildings).
- At $1,076/mo this rent would consume 62% of the median local household income ($21k/yr) (locally 693% of renters already pay >50% of income on rent) — very limited rent-growth headroom before tenants either downsize or default.
Forward outlook
- In year one you build about $1k of equity ($276 loan paydown + $938 appreciation (2.4% local appreciation)).
- Lucas County population projected at -16% by 2050 — secular population decline; favor cash flow + early exit over multi-decade hold.
- At projected returns (2.4% appreciation + 3.0% rent growth), your $11k cash investment doubles in ~2 years — after that, you're playing with house money.
Negotiation context
- Only 1 days on market — expect competitive offers; lowballing is unlikely to land.
- 2 sale attempts since 2y ago; this cycle's ask has dropped $5k (11%) from the opening price — seller is motivated, your offer sets the floor, not the list.
- Current owner paid $10k; list at $40k implies a 299% gain — meaningful room to come down on a strong offer.
Risks & watch-outs
- Watch-outs: built in 1897 — expect roof / HVAC / electrical / plumbing capex.
Questions for the listing agent
- Built in 1897 — when were the roof, HVAC, electrical panel, plumbing, and water heater last replaced?
- Is there a deadline driving the sale (1031 exchange, divorce, estate, relocation)? That informs how much negotiation room exists.
- Schools are D-rated, which usually means shorter tenancies and higher turnover. Who's the typical renter profile here, and what's been the actual vacancy rate?
- Crime grade is F in this area — have there been break-ins, vandalism, or insurance claims at this property in the last 3 years? What carrier currently insures it and at what premium?
- What's the average days-on-market for RENTAL listings here right now (not sales)? A rising rental-DOM trend means longer vacancies and softer asking-rent achievability than the comps imply.
- What's the recent tenant-quality profile in this submarket — average credit score on applications, eviction rate, late-payment / NSF rate, and stable-employment percentage? A property-management company in the area should have these aggregated.
- How much new for-sale + rental construction is in the pipeline within 1–3 miles? Heavy new supply typically softens prices + rents 12–24 months out; constrained supply supports both.
Investment metrics
- 1% rule
- 2.70% ✓
- Cap rate
- 23.75%
- Cash-on-cash
- 62.35%
- DSCR
- 3.77
- GRM
- 3.1
CMA / ARV
- ARV (on-the-fly)
- $16,950
- Comps found
- 3
Show comp detail 3 sales within ~0.75 mi
| Address | Dist | Beds/Ba | Sqft | Sold | Price | $/sf | Match |
|---|---|---|---|---|---|---|---|
| 1431 N Michigan St | 0.00mi | 1/1.0 | 678 (0%) | 18mo | $10,000 | $15 | 85 |
| 703 Ashwood Ave | 0.75mi | 2/1.0 (+1) | 680 (+0%) | 1mo | $36,000 | $53 | 59 |
| 1142 Page St | 0.62mi | 1/1.0 | 772 (+14%) | 12mo | $19,500 | $25 | 38 |
Match score weights: distance 35% · size 25% · config 20% · recency 20%. Top-matched comps best support the ARV.
Projected returns pro-forma
2.35% appreciation · 3.0% rent growth · sell at horizon
- IRR
- 66.5%
- Equity multiple
- 4.62×
- Total profit
- $40,439
- Equity at exit
- $16,502
- IRR
- 66.6%
- Equity multiple
- 9.40×
- Total profit
- $93,895
- Equity at exit
- $24,364
Cash invested: $11,172 (down + closing). Projections, not guarantees.
Landlord ↔ Tenant lean methodology
- Overall (STATE)
- 73 Landlord-Friendly
- State Ohio
- 73 Landlord-Friendly · R+6
- County
- — inherits STATE
- City
- — inherits STATE
ZIP-level market 43604
- Home prices YoY
- 2.1%
- Active inventory
- 16
- Price-to-rent
- 3.1×
Monthly cashflow live
- Estimated rent
- $1,076 high interval (Pro) →
- Mortgage (P&I)
- −$209
- Tax from tax record
- −$44 /mo · $526/yr
- Insurance
- −$17
- HOA
- −$0
- Vacancy / Maint / Mgmt
- −$226
- Net cashflow
- $581
Break-even live
UW: 25.0% down · 7.5% · 30yr · 1.5% tax · 5.0% vac · 8.0% maint · 8.0% mgmt
Financing live
Cash to close
- Down payment
- $9,975
- Closing costs
- $1,197
- Reserves months
- —
- Total cash needed
- —
Loan-product check · same deal, 3 products live
Conventional
25% down · 7.5% · 30yr
- Down + closing
- —
- Monthly P&I
- —
- Monthly cashflow
- —
- DSCR
- —
- Eligible?
- —
Personal DTI + credit; lowest rate.
DSCR
20% down · 8.5% · 30yr
- Down + closing
- —
- Monthly P&I
- —
- Monthly cashflow
- —
- DSCR
- —
- Eligible?
- —
No personal income docs; deal must DSCR.
Hard money
10% down · 12.0% · 12mo
- Down + closing
- —
- Monthly P&I
- —
- Monthly cashflow
- —
- DSCR
- —
- Eligible?
- —
Short-term bridge; refi at stabilization.
Rent comps 10 comps
| Address | Beds | Baths | Sqft | Rent | $/sqft | DOM | Units | Dist |
|---|---|---|---|---|---|---|---|---|
| 1007 N Summit St Unit 1010 Toledo, OH | 1.0 | 1.0 | 468 | $797 | $1.70 | 44d | 1 | 0.53mi |
| 1007 N Summit St Unit 1010 Toledo, OH | 1.0 | 1.0 | 420 | $697 | $1.66 | 23d | 1 | 0.53mi |
| 426 Beacon St Toledo, OH | 1.0–2.0 | 1.0–1.5 | 809 | $750 | $0.93 | 14d | 10 | 0.90mi |
| 2807 Chestnut St Unit 2 Toledo, OH | 1.0 | 1.0 | 745 | $495 | $0.66 | 21d | 1 | 0.93mi |
| 625 Riverside Dr Toledo, OH | 1.0–2.0 | 1.0–2.0 | 860 | $1,205 | $1.40 | 14d | 37 | 0.94mi |
| 251 Graham St Apt A Toledo, OH | 2.0 | 1.0 | 625 | $850 | $1.36 | 44d | 1 | 1.11mi |
| 200 N St Clair St Toledo, OH | 2.0 | 1.0–2.0 | 835 | $1,762 | $2.11 | 14d | 15 | 1.20mi |
| 21 Magyar St Toledo, OH | 2.0 | 1.0 | 680 | $1,050 | $1.54 | 44d | 1 | 1.25mi |
| 2039 Genesee St Toledo, OH | 1.0 | 1.0 | 660 | $625 | $0.95 | 44d | 1 | 1.25mi |
| 123 Water St Unit 411 Toledo, OH | 1.0 | 1.0 | 747 | $1,380 | $1.85 | 23d | 1 | 1.29mi |
Listing history 2 events
-
2026-06-18remarks 699-char remark
-
2026-06-18$39,900 Coming Soon 1 DOM
ⓘ Source: listings_history table (triggers on properties + properties_extension) + one-shot
backfill from property_details.listing_events for pre-trigger history.
Tax reassessment forecast OH · Partial reset (capped growth)
- Current annual tax
- $526 · $44/mo
- Projected year-2 tax
- $574 · $48/mo
- Expected delta
- +$48/yr (+$4/mo · 9.2%)
ⓘ Screening estimate from a state-policy table — verify with the county assessor before closing.
Climate risk First Street
- Flood 1/10 Low FEMA zone X (unshaded) · 0% chance over 30 yrs
- Wildfire 1/10 Low
- Heat 3/10 Moderate 7 d/yr ≥100°F today · 16 d/yr by 30 yrs out
- Wind 2/10 Low
- Air quality 2/10 Low 1 unhealthy d/yr today · 3 by 30 yrs out
Nearby sold comps map
Loading sold comps map…
Walkable amenities ~0.75 mi
Loading nearby amenities…
Taxation est. · year 1
- Rental income
- $12,915
- − Mortgage interest
- −$2,235
- − Property taxes
- −$526
- − Insurance
- −$200
- − Repairs & maintenance
- −$1,033
- − Management
- −$1,033
- − Depreciation
- −$1,161
- Taxable income
- $6,727
- Est. tax owed @ 24.0%
- −$1,614
- After-tax cash flow
- $5,352/yr
For passive investors: Depreciation is non-cash, so a rental often shows a tax loss while cash-flowing — sheltering income. Rental losses are passive: they offset passive income freely, and up to $25,000/yr can offset ordinary (W-2) income if you actively participate and your MAGI is under $100k (phasing out to $0 by $150k); unused losses carry forward. On sale, claimed depreciation is recaptured at up to 25%, and gains may owe capital-gains tax (a 1031 exchange can defer both). Figures are a year-1 estimate at your 24.0% rate — not tax advice; consult a CPA.
Schools (NCES district)
- District
- Toledo City
- NCES district ID
- 3904490
- Math proficiency
- 15% ▼ -16.00%
- Reading proficiency
- 24% ▼ -13.00%
- Median HH income
- $32,137
- Composite
- 15.76/100
- National rank
- #9276
- State rank
- #634 of 656 in OH
Livability — Toledo
- Score
- 66/100
- State rank
- #645
- US rank
- #11442
Category grades
Schools grade is shown separately in the Schools card above.
Census & demographics
- Census place
- Toledo, OH
- County
- Lucas County · 380,724 people
- City population
- 280,811
- Metro
- Toledo, OH
- Population (ZIP)
- 9,594
- Household income
- $20,734
- Rent vs Own
- Severe rent burden
- 693.0
Population outlook (Lucas County) Hauer SSP2
- Today (2025)
- 420,751 people
- By 2030
- 410,187 · -2.5%
- By 2040
- 384,019 · -8.7%
- By 2050
- 355,125 · -15.6%
- By 2075
- 291,683 · -30.7%
- By 2100
- 233,670 · -44.5%
Race, ethnicity, and origin ACS 2023
- Neighborhood character
- Diverse neighborhood (Simpson 0.61)
- Race & ethnicity
- Black 51% White 34% Two or more races 9% Hispanic / Latino 9%
- Hispanic origin (detail)
- Mexican 8%
- Common ancestry
- Romanian 2% Slovak 1% Lithuanian 1%
- Foreign-born
- 4% · Canada, South Korea, China
- Languages at home
- 95% English-only · Spanish 3% Arabic 1%
Political lean MEDSL · Lucas
- 2024 margin
- D (+12.6) · D 55.8% · R 43.2%
- 2008→2024 swing
- -18.9pp toward R · 2008: 31.4pp · 2024: 12.6pp
- All cycles
- 2024: D+12.6 2020: D+16.8 2016: D+17.4 2012: D+30.4 2008: D+31.4
Not yet ingested
- Civics
- —
Market trends
- HPI YoY
- ▲ 2.35%
- Current HPI
- 111.6154
- Rent YoY
- —
- Metro
- Toledo, OH
- State GDP YoY
- ▲ 1.98%
- F500 in state
- 48
Industry mix (Fortune 500 HQ in OH)
| Industry | F500 HQs | Revenue |
|---|---|---|
| Insurance | 3 | $145B |
|
||
| Industrial Machinery | 3 | $49B |
|
||
| Financial Services | 3 | $24B |
|
||
| Consumer Goods | 2 | $93B |
|
||
| Aerospace / Defense | 2 | $47B |
|
||
| Utilities | 2 | $33B |
|
||
Price history
+59.6% since first listed12 events — show timeline
- 2026-06-18 Coming Soon $39,900 NORIS
- 2026-02-04 Listing Removed — NORIS
- 2025-10-31 Listed $44,900 NORIS
- 2025-10-24 Coming Soon — NORIS
- 2025-10-14 Price Changed $10,000 NORIS
- 2024-12-09 Sold (MLS) $10,000 NORIS
- 2024-11-03 Pending — NORIS
- 2024-10-08 Price Changed $17,500 NORIS
- 2024-09-24 Price Changed $19,900 NORIS
- 2024-07-22 Price Changed $24,500 NORIS
- 2024-06-18 Listed $25,000 NORIS
- 2024-06-13 Coming Soon $25,000 NORIS
Property tax history
+13.4%/yrLatest (2025): $526 · +7.2% YoY. Source: county tax records.
Cash-flow waterfall
monthlySold comps — $/sqft
last 12 mo · ≤1 miLoading sold comps…