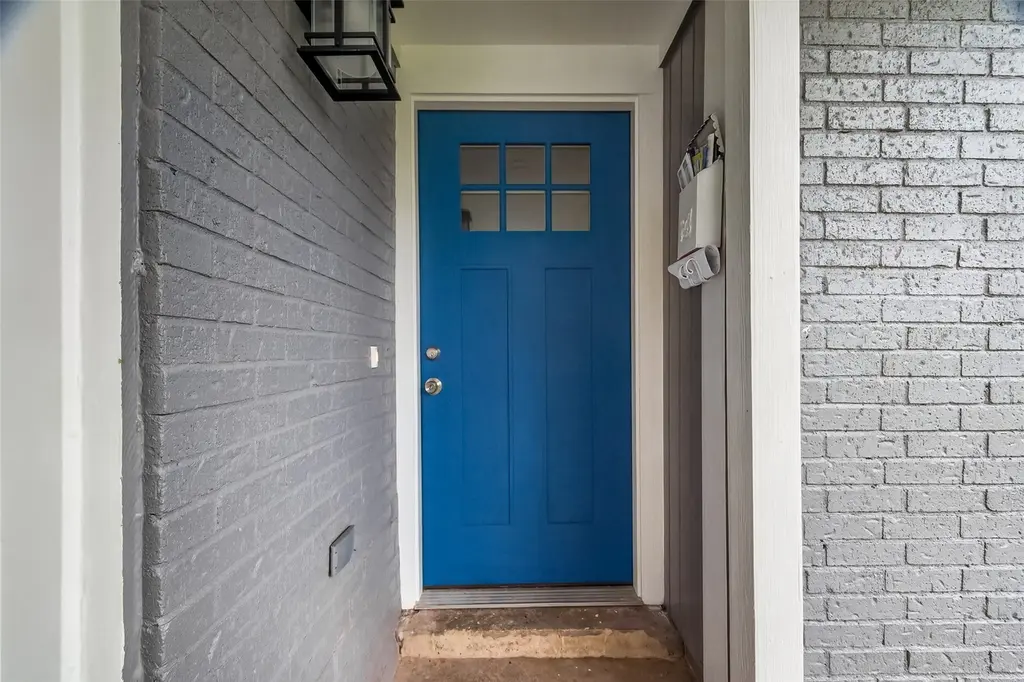
12711 Claygate Dr · Houston, TX
Flood risk 3/10 · Minor
- FEMA flood zone
- X (unshaded)
- Chance of flooding over 30 yrs
- 0.2%
- Est. flood insurance / yr
- $507 – $1,088
Fire risk 1/10 · Minimal
- Est. fire insurance / yr
- $1,222 – $2,270
Heat risk 9/10 · Severe
- Hot days now (above 109°F)
- 7 days/yr
- Hot days in 30 yrs
- 23 days/yr
Wind risk 9/10 · Severe
- Chance of severe wind over 30 yrs
- 99.0%
Air-quality risk 2/10 · Minimal
- Unhealthy air days now
- 2 days/yr
- Unhealthy air days in 30 yrs
- 2 days/yr
Risk factors via First Street. Map © Google.
Why this score? — see what drove the D grade
The composite is a weighted blend of 9 inputs, each scored 0–100. Each bar is that input's sub-score; the figure is the points it added to the 100-point composite (weight × sub-score).
- Cash flow +15.5/30.0
- ARV discount +7.5/15.0
- DSCR +4.8/10.0
- 1% rule +3.8/10.0
- Livability +3.7/5.0
- Schools +2.7/10.0
- Condition / age +2.5/5.0
- Rent growth +2.4/5.0
- Appreciation +0.0/10.0
$210,000
🖨 Deal sheet (PDF) 📄 Offer letter ✓ Due diligence
Listing remarks
Wonderful fully remodeled home with three bedrooms and two baths single story in Houston. Everything is brand new. Single car garage. Located near Almeda Genoa in South Acres. Please reach out to agent for more information. Lease to own only.
Key facts
- Fully remodeled home
- Single car garage
- Near almeda genoa
Tags
Property features AI
Finance
- Financial info: Lease considered
Exterior
- Parking: Detached garage (1 car)
- Utilities: Public water; Public sewer
- Home design: Residential property; Built in 1968; Slab foundation
- Construction: Brick construction; Composition roof
- Exterior features: Concrete road access; Located in a subdivision
Interior
- Bedrooms: Three bedrooms, all on the first floor (each approx. 12 x 12); Primary bedroom on the first floor (approx. 12 x 12)
- Flooring: Plank flooring; Vinyl flooring
- Bathrooms: Two full bathrooms
- Heating & cooling: Central heating (electric); Central air conditioning (electric)
- Interior features: Plank and vinyl flooring; Seller disclosure provided
Neighborhood map
What this means for you Summary
Snapshot
- This is a 3-bed/1.0-bath single-family listed at $210k.
Deal economics
- At list price, monthly cash flow is $83 ($995/yr) — positive.
- The deal already cash-flows at list — no discount required.
- To meet the 1% rule (rent ≥ 1% of price), the offer needs to be $184k (12.2% below list).
- Recommended offer: $184k (12.2% below list) — sets the bar for 1% rule.
- Cap rate 6.8% vs local median 3.2% in Houston — top-decile yield for the area; either an underpriced asset or a hidden risk that comps aren't pricing in. Stress-test before assuming the spread holds.
Location & tenants
- Location reads 74/100 on livability (#184 in TX, #4,771 nationally) — a middle-class / working-renter tenant base. Strengths: amenities A+, cost of living A+, housing A+; Watch: crime F.
- Houston ISD (urban): math 27% / reading 35% proficiency, ranked #593 of 826 in TX (top 72%) — families likely to look elsewhere, expect single-tenant / working-renter base with shorter leases; 71% free/reduced lunch — lower-income household profile, screen leases tightly.
- Zoned schools: Law El (math 22% / reading 32%, grade F, #2,791 of 4,322 statewide, top 68%, 514 students, 91% FRL); Thomas Middle (math 3% / reading 13%, grade F, #1,654 of 1,662 statewide, top 100%, 526 students, 98% FRL); Worthing H S (math 22% / reading 21%, grade F, #1,377 of 1,632 statewide, top 85%, 827 students, 96% FRL) — zoned schools average 95% FRL vs 71% district-wide (24 pts higher); higher-poverty schools than district average — tighter screening recommended.
- Zoned-school proficiency averages 19% at this address vs 31% district-wide (-12 pts) — the specific schools serving this property underperform the Houston ISD average; the district grade overstates school quality for this exact location.
- Market conditions: Rents soft (-0.2%/yr); 284 active listings in the ZIP; 17 comparable units currently listed for rent nearby; rentals at typical pace (median 15d on market — plan ~3-4 weeks tenant-placement turnaround); solid renter incomes; 29,883 units permitted in Harris County in 2024 (8,621 in 5+ unit buildings).
Forward outlook
- Local home prices are declining (-3.0%/yr); year-one equity from $1k of loan paydown is wiped out by about $6k of value loss. Plan a longer hold.
- Harris County population projected at +47% by 2050 — long-run rental-demand tailwind backs the buy-and-hold thesis.
Negotiation context
- It's been on market 35 days — a 3% lower offer ($204k) is reasonable based on typical stale-listing flexibility.
- 4 sale attempts with the ask held roughly flat each time — persistent listings suggest the price (not the market) is what's stuck; bring a comps-based counter.
Risks & watch-outs
- Climate carrying-cost: severe wind risk, 99% chance of damaging wind over 30y; extreme-heat days projected 7→23/yr by 2055 (HVAC capex compounding) — expect insurance premiums to compound above CPI over the hold.
Questions for the listing agent
- It's been on market 35 days. Have you received any prior offers? Is the seller open to a 12% concession, seller financing, or rate buy-down credit?
- Built in 1968 — when were the roof, HVAC, electrical panel, plumbing, and water heater last replaced?
- Is there a deadline driving the sale (1031 exchange, divorce, estate, relocation)? That informs how much negotiation room exists.
- Schools are D-rated, which usually means shorter tenancies and higher turnover. Who's the typical renter profile here, and what's been the actual vacancy rate?
- Crime grade is F in this area — have there been break-ins, vandalism, or insurance claims at this property in the last 3 years? What carrier currently insures it and at what premium?
- The area grade is low — what's the realistic commute time and amenity access for the typical tenant pool here? Any planned neighborhood developments (good or bad) we should know about?
- What's the average days-on-market for RENTAL listings here right now (not sales)? A rising rental-DOM trend means longer vacancies and softer asking-rent achievability than the comps imply.
- What's the recent tenant-quality profile in this submarket — average credit score on applications, eviction rate, late-payment / NSF rate, and stable-employment percentage? A property-management company in the area should have these aggregated.
- How much new for-sale + rental construction is in the pipeline within 1–3 miles? Heavy new supply typically softens prices + rents 12–24 months out; constrained supply supports both.
Investment metrics
- 1% rule
- 0.88% ✗
- Cap rate
- 6.77%
- Cash-on-cash
- 1.69%
- DSCR
- 1.08
- GRM
- 9.5
CMA / ARV
- ARV (on-the-fly)
- $132,858
- Comps found
- 9
Show comp detail 9 sales within ~0.75 mi
| Address | Dist | Beds/Ba | Sqft | Sold | Price | $/sf | Match |
|---|---|---|---|---|---|---|---|
| 12506 S Coast Dr | 0.19mi | 3/1.5 | 1,026 (-6%) | 3mo | $120,000 | $117 | 77 |
| 12922 Claygate Dr | 0.22mi | 3/1.5 | 1,184 (+9%) | 11mo | $124,900 | $105 | 64 |
| 12539 Claygate Dr | 0.10mi | 3/1.0 | 998 (-8%) | 23mo | $139,900 | $140 | 62 |
| 12930 Segrest Dr | 0.25mi | 3/1.5 | 1,219 (+12%) | 6mo | $122,000 | $100 | 61 |
| 11707 Segrest Dr | 0.56mi | 3/1.0 | 1,020 (-6%) | 9mo | $149,900 | $147 | 56 |
| 3630 Almeda Genoa Rd | 0.61mi | 3/1.0 | 1,063 (-2%) | 21mo | $128,900 | $121 | 50 |
| 4307 Bungalow Ln | 0.56mi | 3/1.0 | 1,141 (+5%) | 19mo | $139,000 | $122 | 50 |
| 4414 Tavenor Ln | 0.72mi | 3/1.0 | 970 (-11%) | 3mo | $149,000 | $154 | 46 |
| 4415 Madden Ln | 0.70mi | 3/1.0 | 965 (-11%) | 16mo | $140,000 | $145 | 35 |
Match score weights: distance 35% · size 25% · config 20% · recency 20%. Top-matched comps best support the ARV.
Projected returns pro-forma
-3.0% appreciation · 0.0% rent growth · sell at horizon
- IRR
- -16.9%
- Equity multiple
- 0.42×
- Total profit
- $-34,173
- Equity at exit
- $31,312
- IRR
- -15.1%
- Equity multiple
- 0.25×
- Total profit
- $-43,926
- Equity at exit
- $18,157
Cash invested: $58,800 (down + closing). Projections, not guarantees.
Landlord ↔ Tenant lean methodology
- Overall (STATE)
- 87 Strongly Landlord-Friendly
- State Texas
- 87 Strongly Landlord-Friendly · R+5
- County
- — inherits STATE
- City
- — inherits STATE
ZIP-level market 77047
- Home prices YoY
- -10.1%
- Rents YoY
- -0.2%
- Active inventory
- 284
- Price-to-rent
- 9.5×
Monthly cashflow live
- Estimated rent
- $1,844 high interval (Pro) →
- Mortgage (P&I)
- −$1,101
- Tax from tax record
- −$185 /mo · $2,225/yr
- Insurance
- −$88
- HOA
- −$0
- Vacancy / Maint / Mgmt
- −$387
- Net cashflow
- $83
Break-even live
Sensitivity live
| Price | -10% $202 | -5% $142 | +0% $83 | +5% $23 | +10% $-36 |
|---|---|---|---|---|---|
| Rent | -10% $-63 | -5% $10 | +0% $83 | +5% $156 | +10% $229 |
| Rate | -1.0pp $189 | -0.5pp $136 | base $83 | +0.5pp $28 | +1.0pp $-27 |
UW: 25.0% down · 7.5% · 30yr · 1.5% tax · 5.0% vac · 8.0% maint · 8.0% mgmt
Financing live
Cash to close
- Down payment
- $52,500
- Closing costs
- $6,300
- Reserves months
- —
- Total cash needed
- —
Loan-product check · same deal, 3 products live
Conventional
25% down · 7.5% · 30yr
- Down + closing
- —
- Monthly P&I
- —
- Monthly cashflow
- —
- DSCR
- —
- Eligible?
- —
Personal DTI + credit; lowest rate.
DSCR
20% down · 8.5% · 30yr
- Down + closing
- —
- Monthly P&I
- —
- Monthly cashflow
- —
- DSCR
- —
- Eligible?
- —
No personal income docs; deal must DSCR.
Hard money
10% down · 12.0% · 12mo
- Down + closing
- —
- Monthly P&I
- —
- Monthly cashflow
- —
- DSCR
- —
- Eligible?
- —
Short-term bridge; refi at stabilization.
Rent comps 17 comps
| Address | Beds | Baths | Sqft | Rent | $/sqft | DOM | Units | Dist |
|---|---|---|---|---|---|---|---|---|
| 4015 Marchant Rd Houston, TX | 3.0 | 2.0 | 1200 | $1,700 | $1.42 | 45d | 1 | 0.22mi |
| 11819 Leitrim Way Houston, TX | 3.0 | 1.0 | 1476 | $1,150 | $0.78 | 7d | 1 | 0.53mi |
| 12227 Cape Hyannis Dr Houston, TX | 3.0 | 2.0 | 1432 | $1,705 | $1.19 | 16d | 1 | 0.76mi |
| 3918 Almeda-Genoa Rd Houston, TX | 1.0–3.0 | 1.0–2.0 | 1038 | $2,220 | $2.14 | 0d | 26 | 0.76mi |
| 13561 Cullen Blvd Houston, TX | 2.0 | 2.0 | 990 | $1,450 | $1.46 | 45d | 1 | 1.06mi |
| 13555 Cullen Blvd Houston, TX | 1.0–3.0 | 1.0–2.0 | 917 | $1,900 | $2.07 | 45d | 35 | 1.08mi |
| 4322 Groton Dr Houston, TX | 3.0 | 1.0 | 858 | $1,395 | $1.63 | 45d | 1 | 1.11mi |
| 3110 Kainer Meadows Ln Houston, TX | 3.0 | 2.0 | 1469 | $1,900 | $1.29 | 9d | 1 | 1.16mi |
| 13351 Cityscape Ave Houston, TX | 1.0–2.0 | 1.0–2.0 | 974 | $1,820 | $1.87 | 0d | 26 | 1.24mi |
| 2620 Almeda-Genoa Rd Houston, TX | 1.0–2.0 | 1.0–2.0 | 788 | $1,650 | $2.09 | 1d | 15 | 1.28mi |
| 11319 Murr Way Houston, TX | 3.0 | 1.5 | 1213 | $1,699 | $1.40 | 20d | 1 | 1.30mi |
| 4071 Schurmier Rd Unit SLC2 Houston, TX | 2.0 | 2.0 | 990 | $1,575 | $1.59 | 5d | 1 | 1.32mi |
| 13511 Hycohen Rd Unit 13534 Houston, TX | 2.0 | 2.0 | 1153 | $1,704 | $1.48 | 1d | 1 | 1.38mi |
| 13511 Hycohen Rd Unit 424 Houston, TX | 2.0 | 2.0 | 1153 | $1,720 | $1.49 | 6d | 1 | 1.38mi |
| 13511 Hycohen Rd Houston, TX | 1.0–2.0 | 1.5–2.5 | 961 | $1,710 | $1.78 | 14d | 26 | 1.40mi |
| 11806 City Park Central Ln Houston, TX | 2.0 | 2.0 | 1107 | $1,636 | $1.48 | 18d | 1 | 1.47mi |
| 11806 City Park Central Ln Houston, TX | 2.0 | 2.0 | 1107 | $1,636 | $1.48 | 45d | 1 | 1.47mi |
Listing history 24 events
-
2026-06-21days on market $210,000 Active 35 DOM
-
2026-06-18days on market $210,000 Active 32 DOM
-
2026-06-17days on market $210,000 Active 31 DOM
-
2026-06-16days on market $210,000 Active 30 DOM
-
2026-06-15days on market $210,000 Active 29 DOM
-
2026-06-13days on market $210,000 Active 27 DOM
-
2026-06-10days on market $210,000 Active 23 DOM
-
2026-06-08days on market $210,000 Active 22 DOM
-
2026-06-07days on market $210,000 Active 21 DOM
-
2026-06-04days on market $210,000 Active 18 DOM
-
2026-06-01days on market $210,000 Active 15 DOM
-
2026-05-31days on market $210,000 Active 14 DOM
-
2026-05-17$210,000 Active
-
2026-01-14soldstatus
-
2025-12-24soldstatus
-
2025-12-05historical
-
2025-12-03status Active
-
2025-11-30historical
-
2025-11-07status Active
-
2025-10-31status Pending
-
2025-09-14price $120,300
-
2025-09-14price $123,000
-
2025-08-28$137,500 Active
-
1988-01-02soldstatus
ⓘ Source: listings_history table (triggers on properties + properties_extension) + one-shot
backfill from property_details.listing_events for pre-trigger history.
Tax reassessment forecast TX · Resets to sale price
- Current annual tax
- $2,225 · $185/mo
- Projected year-2 tax
- $3,843 · $320/mo
- Expected delta
- +$1,618/yr (+$135/mo · 72.7%)
ⓘ Screening estimate from a state-policy table — verify with the county assessor before closing.
Climate risk First Street
- Flood 3/10 Moderate FEMA zone X (unshaded) · 20% chance over 30 yrs
- Wildfire 1/10 Low
- Heat 9/10 Extreme 7 d/yr ≥109°F today · 23 d/yr by 30 yrs out
- Wind 9/10 Extreme 99% chance of damaging wind over 30 yrs
- Air quality 2/10 Low 2 unhealthy d/yr today · 2 by 30 yrs out
Nearby sold comps map
Loading sold comps map…
Walkable amenities ~0.75 mi
Loading nearby amenities…
Taxation est. · year 1
- Rental income
- $22,133
- − Mortgage interest
- −$11,763
- − Property taxes
- −$2,225
- − Insurance
- −$1,050
- − Repairs & maintenance
- −$1,771
- − Management
- −$1,771
- − Depreciation
- −$6,109
- Taxable loss
- −$2,556
- Est. tax savings @ 24.0%
- +$613
- After-tax cash flow
- $1,608/yr
For passive investors: Depreciation is non-cash, so a rental often shows a tax loss while cash-flowing — sheltering income. Rental losses are passive: they offset passive income freely, and up to $25,000/yr can offset ordinary (W-2) income if you actively participate and your MAGI is under $100k (phasing out to $0 by $150k); unused losses carry forward. On sale, claimed depreciation is recaptured at up to 25%, and gains may owe capital-gains tax (a 1031 exchange can defer both). Figures are a year-1 estimate at your 24.0% rate — not tax advice; consult a CPA.
Schools (NCES district)
- District
- Houston ISD
- NCES district ID
- 4823640
- Math proficiency
- 27% ▼ -18.00%
- Reading proficiency
- 35% ▼ -6.00%
- Median HH income
- $46,054
- Composite
- 26.63/100
- National rank
- #7173
- State rank
- #593 of 826 in TX
Livability — Houston
- Score
- 74/100
- State rank
- #184
- US rank
- #4771
Category grades
Schools grade is shown separately in the Schools card above.
Census & demographics
- Census place
- Houston, TX
- County
- Harris County · 4,702,590 people
- City population
- 3,226,434
- Metro
- Houston-The Woodlands-Sugar Land, TX
- Population (ZIP)
- 34,987
- Household income
- $78,538
- Rent vs Own
- Severe rent burden
- 1109.0
Population outlook (Harris County) Hauer SSP2
- Today (2025)
- 5,571,493 people
- By 2030
- 6,089,821 · +9.3%
- By 2040
- 7,142,806 · +28.2%
- By 2050
- 8,185,864 · +46.9%
- By 2075
- 10,574,329 · +89.8%
- By 2100
- 12,109,958 · +117.4%
Race, ethnicity, and origin ACS 2023
- Neighborhood character
- Diverse neighborhood (Simpson 0.58)
- Race & ethnicity
- Black 57% Hispanic / Latino 29% Two or more races 15% White 6% Asian 3% Pacific Islander 1%
- Hispanic origin (detail)
- Mexican 24% Puerto Rican 1%
- Common ancestry
- Lithuanian 1%
- Foreign-born
- 15% · Canada, Vietnam
- Languages at home
- 70% English-only · Spanish 23% Vietnamese 1% Other Indo-European 1%
Political lean MEDSL · Harris
- 2024 margin
- Lean D (+5.5) · D 52.0% · R 46.4% · Other 1.6%
- 2008→2024 swing
- +3.9pp toward D · 2008: 1.6pp · 2024: 5.5pp
- All cycles
- 2024: D+5.5 2020: D+13.3 2016: D+12.4 2012: D+0.1 2008: D+1.6
Not yet ingested
- Civics
- —
Market trends
- HPI YoY
- ▼ -26.76%
- Current HPI
- 239.2287
- Rent YoY
- ▼ -0.21%
- Metro
- Houston-The Woodlands-Sugar Land, TX
- State GDP YoY
- ▲ 3.95%
- F500 in state
- 110
Industry mix (Fortune 500 HQ in TX)
| Industry | F500 HQs | Revenue |
|---|---|---|
| Energy | 16 | $1,198B |
|
||
| Technology | 5 | $198B |
|
||
| Engineering / Construction | 4 | $72B |
|
||
| Energy Services | 3 | $60B |
|
||
| Utilities | 3 | $41B |
|
||
| Healthcare | 2 | $330B |
|
||
Price history
+52.7% since first listed12 events — show timeline
- 2026-05-17 Listed $210,000 HARMLS
- 2026-01-14 Sold (Public Records) — Public Records
- 2025-12-24 Sold (Public Records) — Public Records
- 2025-12-05 Listing Removed — HARMLS
- 2025-12-03 Relisted — HARMLS
- 2025-11-30 Listing Removed — HARMLS
- 2025-11-07 Relisted — HARMLS
- 2025-10-31 Pending — HARMLS
- 2025-09-14 Price Changed $120,300 HARMLS
- 2025-09-14 Price Changed $123,000 HARMLS
- 2025-08-28 Listed $137,500 HARMLS
- 1988-01-02 Sold (Public Records) — Public Records
Property tax history
+4.7%/yrLatest (2025): $2,225 · +11.6% YoY. Source: county tax records.
Cash-flow waterfall
monthlySold comps — $/sqft
last 12 mo · ≤1 miLoading sold comps…