920 NE A St St · Linton, IN
Flood risk 1/10 · Minimal
- FEMA flood zone
- X (unshaded)
- Chance of flooding over 30 yrs
- 0.0%
- Est. flood insurance / yr
- $473 – $860
Fire risk 1/10 · Minimal
- Est. fire insurance / yr
- $717 – $1,331
Heat risk 4/10 · Minor
- Hot days now (above 104°F)
- 7 days/yr
- Hot days in 30 yrs
- 19 days/yr
Wind risk 2/10 · Minimal
- Chance of severe wind over 30 yrs
- 1.0%
Air-quality risk 3/10 · Minor
- Unhealthy air days now
- 2 days/yr
- Unhealthy air days in 30 yrs
- 3 days/yr
Risk factors via First Street. Map © Google.
Why this score? — see what drove the B- grade
The composite is a weighted blend of 9 inputs, each scored 0–100. Each bar is that input's sub-score; the figure is the points it added to the 100-point composite (weight × sub-score).
- Cash flow +30.0/30.0
- 1% rule +10.0/10.0
- DSCR +10.0/10.0
- ARV discount +7.5/15.0
- Livability +3.6/5.0
- Schools +3.5/10.0
- Rent growth +2.5/5.0
- Condition / age +2.5/5.0
- Appreciation +0.0/10.0
$70,000
🖨 Deal sheet (PDF) 📄 Offer letter ✓ Due diligence
Listing remarks
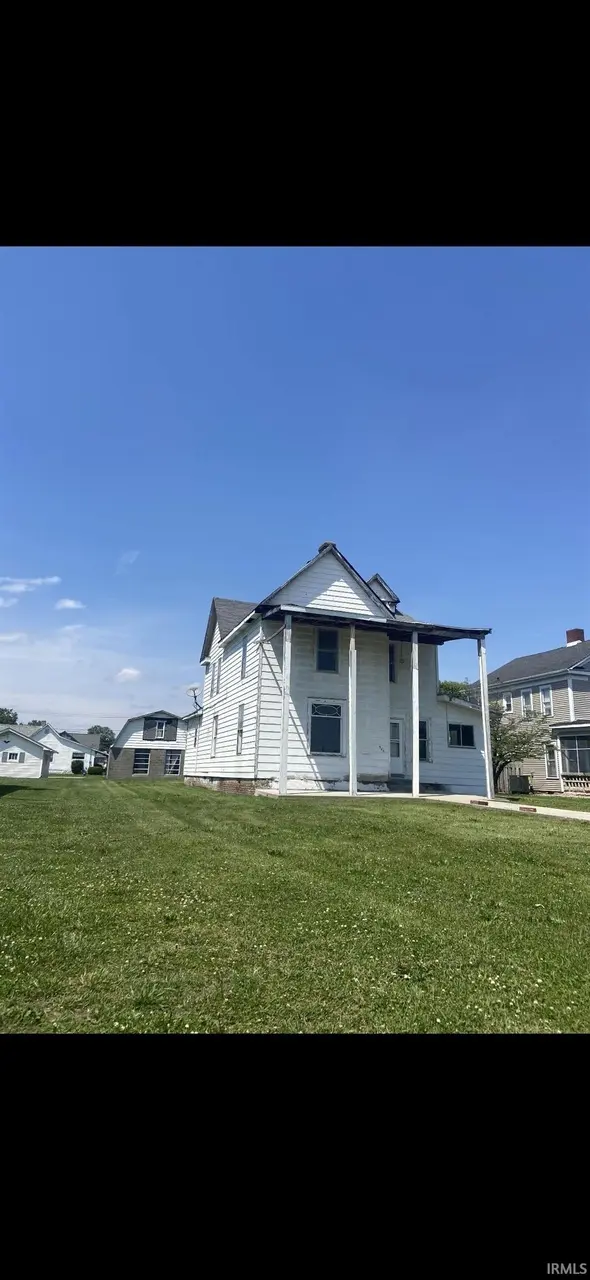
Charming Victorian home full of character and ready for restoration. Offering 4 bedrooms and 3 bathrooms, this property features generous room sizes, classic architectural details, and a detached garage complete with a half bath and shop area. Ideal opportunity for buyers looking to customize and add value.
Key facts
- 0.28 acre lot
- 2 garage spots
- Built 1898
Property features AI
Exterior
- Parking: Detached 2-car garage
- Utilities: Public water; Public sewer
- Home design: Single-family site-built home; Two stories
- Construction: Aluminum siding
- Exterior features: Asphalt roof; Lot dimensions approximately 60 x 200; Lot size about 0.28 acres; Lot described as 'Other'
Interior
- Bedrooms: Total of 8 rooms (bedroom count not specified)
- Flooring: Hardwood
- Bathrooms: Three full bathrooms; Two bathrooms on the main level
- Heating & cooling: No heating system listed; No cooling system listed
- Interior features: Hardwood flooring; One fireplace in the family room; Basement with crawl space and partial finish
- Laundry & utility: Laundry on the main level
Neighborhood map
What this means for you Summary
Snapshot
- This is a 4-bed/1.5-bath single-family listed at $70k.
Deal economics
- At list price, monthly cash flow is $657 ($8k/yr) — positive.
- The deal already cash-flows at list — no discount required.
- Meets the 1% rule at list price ($1k rent vs $70k).
- Recommended offer: $68k (3.0% below list) — sets the bar for market timing.
- Cap rate 17.6% vs local median 5.2% in Linton — top-decile yield for the area; either an underpriced asset or a hidden risk that comps aren't pricing in. Stress-test before assuming the spread holds.
Location & tenants
- Location reads 71/100 on livability (#129 in IN) — a middle-class / working-renter tenant base. Strengths: cost of living A+, housing A+, health & safety A+; Watch: amenities F, commute F, employment F.
- Linton-Stockton School Corporation (town): math 39% / reading 45% proficiency, ranked #128 of 301 in IN (top 42%) — families likely to look elsewhere, expect single-tenant / working-renter base with shorter leases.
- Zoned schools: Linton-Stockton Elementary (math 55% / reading 47%, grade C-, #262 of 994 statewide, top 27%, 702 students, 53% FRL); Linton-Stockton Middle School (math 29% / reading 42%, grade F, #162 of 330 statewide, top 49%, 312 students, 52% FRL); Linton-Stockton High School (math 17% / reading 47%, grade F, #295 of 369 statewide, top 82%, 386 students, 48% FRL).
- Market conditions: 66 active listings in the ZIP.
Forward outlook
- Local home prices are declining (-3.0%/yr); year-one equity from $484 of loan paydown is wiped out by about $2k of value loss. Plan a longer hold.
- Greene County population projected at -22% by 2050 — secular population decline; favor cash flow + early exit over multi-decade hold.
- At projected returns (-3.0% appreciation + 3.0% rent growth), your $20k cash investment doubles in ~3 years — after that, you're playing with house money.
Negotiation context
- It's been on market 32 days — a 3% lower offer ($68k) is reasonable based on typical stale-listing flexibility.
Risks & watch-outs
- Watch-outs: built in 1898 — expect roof / HVAC / electrical / plumbing capex.
Questions for the listing agent
- It's been on market 32 days. Have you received any prior offers? Is the seller open to a 3% concession, seller financing, or rate buy-down credit?
- Built in 1898 — when were the roof, HVAC, electrical panel, plumbing, and water heater last replaced?
- Is there a deadline driving the sale (1031 exchange, divorce, estate, relocation)? That informs how much negotiation room exists.
- Schools are D-rated, which usually means shorter tenancies and higher turnover. Who's the typical renter profile here, and what's been the actual vacancy rate?
- What's the average days-on-market for RENTAL listings here right now (not sales)? A rising rental-DOM trend means longer vacancies and softer asking-rent achievability than the comps imply.
- What's the recent tenant-quality profile in this submarket — average credit score on applications, eviction rate, late-payment / NSF rate, and stable-employment percentage? A property-management company in the area should have these aggregated.
- How much new for-sale + rental construction is in the pipeline within 1–3 miles? Heavy new supply typically softens prices + rents 12–24 months out; constrained supply supports both.
Investment metrics
- 1% rule
- 2.06% ✓
- Cap rate
- 17.55%
- Cash-on-cash
- 40.20%
- DSCR
- 2.79
- GRM
- 4.1
CMA / ARV
- ARV (on-the-fly)
- $288,540
- Comps found
- 4
Show comp detail 4 sales within ~0.75 mi
| Address | Dist | Beds/Ba | Sqft | Sold | Price | $/sf | Match |
|---|---|---|---|---|---|---|---|
| 290 NE 7th St | 0.15mi | 4/2.0 | 2,352 (-14%) | 8mo | $248,000 | $105 | 60 |
| 178 7th St SE | 0.36mi | 4/2.0 | 3,044 (+11%) | 4mo | $180,000 | $59 | 60 |
| 250 Willow Ln | 0.71mi | 3/2.0 (-1) | 2,596 (-6%) | 4mo | $375,000 | $144 | 47 |
| 509 N Main St | 0.55mi | 5/2.0 (+1) | 2,648 (-4%) | 17mo | $212,000 | $80 | 47 |
Match score weights: distance 35% · size 25% · config 20% · recency 20%. Top-matched comps best support the ARV.
Projected returns pro-forma
-3.0% appreciation · 3.0% rent growth · sell at horizon
- IRR
- 36.6%
- Equity multiple
- 2.56×
- Total profit
- $30,501
- Equity at exit
- $10,437
- IRR
- 43.3%
- Equity multiple
- 5.11×
- Total profit
- $80,495
- Equity at exit
- $6,052
Cash invested: $19,600 (down + closing). Projections, not guarantees.
Landlord ↔ Tenant lean methodology
- Overall (STATE)
- 90 Strongly Landlord-Friendly
- State Indiana
- 90 Strongly Landlord-Friendly · R+11
- County
- — inherits STATE
- City
- — inherits STATE
ZIP-level market 47441
- Home prices YoY
- -31.3%
- Active inventory
- 66
- Price-to-rent
- 4.1×
Monthly cashflow live
- Estimated rent
- $1,440 medium interval (Pro) →
- Mortgage (P&I)
- −$367
- Tax from tax record
- −$84 /mo · $1,012/yr
- Insurance
- −$29
- HOA
- −$0
- Vacancy / Maint / Mgmt
- −$302
- Net cashflow
- $657
Break-even live
Sensitivity live
| Price | -10% $696 | -5% $676 | +0% $657 | +5% $637 | +10% $617 |
|---|---|---|---|---|---|
| Rent | -10% $543 | -5% $600 | +0% $657 | +5% $714 | +10% $770 |
| Rate | -1.0pp $692 | -0.5pp $674 | base $657 | +0.5pp $639 | +1.0pp $620 |
UW: 25.0% down · 7.5% · 30yr · 1.5% tax · 5.0% vac · 8.0% maint · 8.0% mgmt
Financing live
Cash to close
- Down payment
- $17,500
- Closing costs
- $2,100
- Reserves months
- —
- Total cash needed
- —
Loan-product check · same deal, 3 products live
Conventional
25% down · 7.5% · 30yr
- Down + closing
- —
- Monthly P&I
- —
- Monthly cashflow
- —
- DSCR
- —
- Eligible?
- —
Personal DTI + credit; lowest rate.
DSCR
20% down · 8.5% · 30yr
- Down + closing
- —
- Monthly P&I
- —
- Monthly cashflow
- —
- DSCR
- —
- Eligible?
- —
No personal income docs; deal must DSCR.
Hard money
10% down · 12.0% · 12mo
- Down + closing
- —
- Monthly P&I
- —
- Monthly cashflow
- —
- DSCR
- —
- Eligible?
- —
Short-term bridge; refi at stabilization.
Listing history 17 events
-
2026-06-21days on market $70,000 Active 32 DOM
-
2026-06-18days on market $70,000 Active 30 DOM
-
2026-06-17days on market $70,000 Active 29 DOM
-
2026-06-16days on market $70,000 Active 28 DOM
-
2026-06-15days on market $70,000 Active 27 DOM
-
2026-06-13days on market $70,000 Active 25 DOM
-
2026-06-12days on market $70,000 Active 24 DOM
-
2026-06-09days on market $70,000 Active 21 DOM
-
2026-06-08days on market $70,000 Active 20 DOM
-
2026-06-07days on market $70,000 Active 19 DOM
-
2026-06-07days on market $70,000 Active 18 DOM
-
2026-06-04days on market $70,000 Active 15 DOM
-
2026-06-02days on market $70,000 Active 14 DOM
-
2026-06-01days on market $70,000 Active 13 DOM
-
2026-05-31days on market $70,000 Active 12 DOM
-
2026-05-31days on market $70,000 Active 11 DOM
-
2026-05-19$70,000 Active
ⓘ Source: listings_history table (triggers on properties + properties_extension) + one-shot
backfill from property_details.listing_events for pre-trigger history.
Tax reassessment forecast IN · Partial reset (capped growth)
- Current annual tax
- $1,012 · $84/mo
- Projected year-2 tax
- $1,012 · $84/mo
- Expected delta
- $0/yr ($0/mo · 0.0%)
ⓘ Screening estimate from a state-policy table — verify with the county assessor before closing.
Climate risk First Street
- Flood 1/10 Low FEMA zone X (unshaded) · 0% chance over 30 yrs
- Wildfire 1/10 Low
- Heat 4/10 Moderate 7 d/yr ≥104°F today · 19 d/yr by 30 yrs out
- Wind 2/10 Low 100% chance of damaging wind over 30 yrs
- Air quality 3/10 Moderate 2 unhealthy d/yr today · 3 by 30 yrs out
Nearby sold comps map
Loading sold comps map…
Walkable amenities ~0.75 mi
Loading nearby amenities…
Taxation est. · year 1
- Rental income
- $17,275
- − Mortgage interest
- −$3,921
- − Property taxes
- −$1,012
- − Insurance
- −$350
- − Repairs & maintenance
- −$1,382
- − Management
- −$1,382
- − Depreciation
- −$2,036
- Taxable income
- $7,191
- Est. tax owed @ 24.0%
- −$1,726
- After-tax cash flow
- $6,154/yr
For passive investors: Depreciation is non-cash, so a rental often shows a tax loss while cash-flowing — sheltering income. Rental losses are passive: they offset passive income freely, and up to $25,000/yr can offset ordinary (W-2) income if you actively participate and your MAGI is under $100k (phasing out to $0 by $150k); unused losses carry forward. On sale, claimed depreciation is recaptured at up to 25%, and gains may owe capital-gains tax (a 1031 exchange can defer both). Figures are a year-1 estimate at your 24.0% rate — not tax advice; consult a CPA.
Schools (NCES district)
- District
- Linton-Stockton School Corporation
- NCES district ID
- 1805910
- Math proficiency
- 39% ▼ -6.00%
- Reading proficiency
- 45% ▼ -5.00%
- Median HH income
- $40,257
- Composite
- 35.2/100
- National rank
- #4990
- State rank
- #128 of 301 in IN
Livability — Linton
- Score
- 71/100
- State rank
- #129
- US rank
- #6717
Category grades
Schools grade is shown separately in the Schools card above.
Census & demographics
- Census place
- Linton, IN
- City population
- 8,755
- Population (ZIP)
- 8,755
Population outlook (Greene County) Hauer SSP2
- Today (2025)
- 30,724 people
- By 2030
- 29,506 · -4.0%
- By 2040
- 26,744 · -13.0%
- By 2050
- 23,879 · -22.3%
- By 2075
- 18,341 · -40.3%
- By 2100
- 13,976 · -54.5%
Race, ethnicity, and origin ACS 2023
- Neighborhood character
- Predominantly White (96%)
- Race & ethnicity
- White 96% Hispanic / Latino 2% Two or more races 1%
- Common ancestry
- Lithuanian 7% Slovak 2% Iranian 1%
- Foreign-born
- 1% · Canada
Political lean MEDSL · Greene
- 2024 margin
- Solid R (+53.7) · D 22.4% · R 76.1% · Other 1.6%
- 2008→2024 swing
- -39.2pp toward R · 2008: -14.5pp · 2024: -53.7pp
- All cycles
- 2024: R+53.7 2020: R+52.2 2016: R+53.4 2012: R+31.4 2008: R+14.5
Not yet ingested
- Civics
- —
Market trends
- HPI YoY
- ▼ -87.46%
- Current HPI
- 191.9718
- Rent YoY
- —
- Metro
- —
- State GDP YoY
- ▲ 2.90%
- F500 in state
- 18
Industry mix (Fortune 500 HQ in IN)
| Industry | F500 HQs | Revenue |
|---|---|---|
| Industrial Machinery | 2 | $37B |
|
||
| Healthcare | 1 | $177B |
|
||
| Pharmaceuticals | 1 | $45B |
|
||
| Metals / Steel | 1 | $18B |
|
||
| Agriculture | 1 | $17B |
|
||
| Packaging | 1 | $12B |
|
||
Price history
1 event — show timeline
- 2026-05-19 Listed $70,000 IRMLS
Property tax history
+0.5%/yrLatest (2024): $1,012 · -57.9% YoY. Source: county tax records.
Cash-flow waterfall
monthlySold comps — $/sqft
last 12 mo · ≤1 miLoading sold comps…