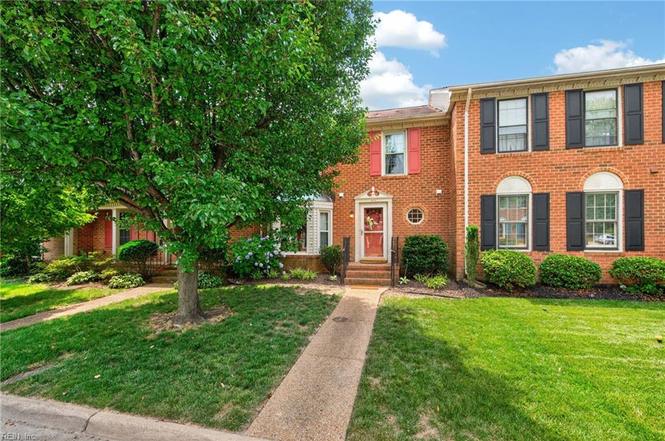
1073 Colonial Meadows Way · Virginia Beach, VA
Flood risk 1/10 · Minimal
- FEMA flood zone
- X (unshaded)
- Chance of flooding over 30 yrs
- 0.0%
- Est. flood insurance / yr
- $507 – $1,088
Fire risk 1/10 · Minimal
- Est. fire insurance / yr
- $666 – $1,236
Heat risk 9/10 · Severe
- Hot days now (above 103°F)
- 7 days/yr
- Hot days in 30 yrs
- 17 days/yr
Wind risk 8/10 · Major
- Chance of severe wind over 30 yrs
- 99.0%
Air-quality risk 2/10 · Minimal
- Unhealthy air days now
- 1 days/yr
- Unhealthy air days in 30 yrs
- 1 days/yr
Risk factors via First Street. Map © Google.
Why this score? — see what drove the D+ grade
The composite is a weighted blend of 9 inputs, each scored 0–100. Each bar is that input's sub-score; the figure is the points it added to the 100-point composite (weight × sub-score).
- ARV discount +13.5/15.0
- Cash flow +10.9/30.0
- Schools +6.4/10.0
- Rent growth +4.2/5.0
- Livability +4.2/5.0
- DSCR +3.2/10.0
- 1% rule +2.6/10.0
- Condition / age +2.5/5.0
- Appreciation +0.0/10.0
$385,000
🖨 Deal sheet (PDF) 📄 Offer letter ✓ Due diligence
Listing remarks
In the heart of Great Neck, all-brick townhome in Southall Quarter offers the perfect blend of comfort and convenience, just minutes from the beach and 1 mile to Hilltop shoping. Enjoy a private fenced patio and 2nd floor deck, detached garage, and additional parking for 2 cars. NO HOA OR CONDO FEES!
Key facts
- Private fenced patio
- Additional parking
- 2nd floor deck
Tags
Property features AI
Finance
- HOA & community: No HOA or POA fees listed
Exterior
- Parking: Attached 1-car garage; Additional driveway space; Street parking; Total garage area approximately 352
- Utilities: City/County water; City/County sewer; Electric water heater; Electric power
- Home design: Attached townhouse; Two stories; Two living levels; Slab foundation
- Construction: Asphalt shingle roof
- Exterior features: Brick siding; Full fenced yard; City view
Interior
- Kitchen: Kitchen with refrigerator; Electric range; Microwave; Dishwasher; Garbage disposal; Breakfast area
- Bedrooms: Master bedroom with ensuite; Additional bedroom
- Flooring: Carpet; Vinyl
- Bathrooms: Two full bathrooms; One half bathroom
- Heating & cooling: Heat pump heating; Electric heating; Central air conditioning
- Interior features: One wood-burning fireplace; Attic; Pantry; Utility room
- Laundry & utility: Washer and dryer included; Utility room
Neighborhood map
What this means for you Summary
Snapshot
- This is a 3-bed/2.5-bath townhouse listed at $385k.
Deal economics
- At list price, monthly cash flow is $-169 ($-2k/yr) — negative.
- To cash-flow at today's rent, offer at most $355k (7.8% below list).
- To meet the 1% rule (rent ≥ 1% of price), the offer needs to be $293k (23.9% below list).
- Recommended offer: $293k (23.9% below list) — sets the bar for 1% rule.
- Cap rate 5.8% vs local median 3.5% in Virginia Beach — top-decile yield for the area; either an underpriced asset or a hidden risk that comps aren't pricing in. Stress-test before assuming the spread holds.
Location & tenants
- Location reads 83/100 on livability (#38 in VA, #880 nationally) — a professional / high-income tenant draw. Strengths: amenities A+, employment A+, housing A+; Watch: cost of living C-, commute F.
- Va Beach City Public School District (urban): math 69% / reading 78% proficiency, ranked #10 of 131 in VA (top 8%) — strong family-tenant draw, lease renewals of 3-5y typical.
- Zoned schools: Alanton Elementary (math 75% / reading 79%, grade A, #171 of 1,108 statewide, top 17%, 629 students, 46% FRL); Lynnhaven Middle (math 64% / reading 80%, grade A, #65 of 342 statewide, top 21%, 886 students, 66% FRL); First Colonial High (math 76% / reading 81%, grade A-, #75 of 319 statewide, top 25%, 1,797 students, 34% FRL) — zoned schools average 49% FRL vs 28% district-wide (21 pts higher); higher-poverty schools than district average — tighter screening recommended.
- Market conditions: Rents rising fast (+6.6%/yr); 209 active listings in the ZIP; 10 comparable units currently listed for rent nearby; rentals at typical pace (median 18d on market — plan ~3-4 weeks tenant-placement turnaround); solid renter incomes; 666 units permitted in Virginia Beach city in 2024 (347 in 5+ unit buildings).
- This rent runs 34% of the median local income ($103k/yr) — at the standard rent-burdened threshold; future hikes will face affordability resistance.
Forward outlook
- Local home prices are declining (-3.0%/yr); year-one equity from $3k of loan paydown is wiped out by about $12k of value loss. Plan a longer hold.
- Virginia Beach County population projected at +6% by 2050 — modest demand growth; plan on rents tracking national, not racing it.
Negotiation context
- Only 9 days on market — expect competitive offers; lowballing is unlikely to land.
- Current owner paid $101k; list at $385k implies a 283% gain — meaningful room to come down on a strong offer.
Risks & watch-outs
- Climate carrying-cost: severe wind risk, 99% chance of damaging wind over 30y; extreme-heat days projected 7→17/yr by 2055 (HVAC capex compounding) — expect insurance premiums to compound above CPI over the hold.
Questions for the listing agent
- What do current leases actually rent for vs. the listed asking? Can we see a recent rent roll and the last 12 months of T-12 income?
- Is there a deadline driving the sale (1031 exchange, divorce, estate, relocation)? That informs how much negotiation room exists.
- Schools are A-rated — typically a magnet for longer-tenancy family renters. What's the average tenant stay here, and is there a school-zone premium baked into asking?
- The area grade is low — what's the realistic commute time and amenity access for the typical tenant pool here? Any planned neighborhood developments (good or bad) we should know about?
- What's the average days-on-market for RENTAL listings here right now (not sales)? A rising rental-DOM trend means longer vacancies and softer asking-rent achievability than the comps imply.
- What's the recent tenant-quality profile in this submarket — average credit score on applications, eviction rate, late-payment / NSF rate, and stable-employment percentage? A property-management company in the area should have these aggregated.
- How much new for-sale + rental construction is in the pipeline within 1–3 miles? Heavy new supply typically softens prices + rents 12–24 months out; constrained supply supports both.
Investment metrics
- 1% rule
- 0.76% ✗
- Cap rate
- 5.77%
- Cash-on-cash
- -1.88%
- DSCR
- 0.92
- GRM
- 11.0
CMA / ARV
- ARV (on-the-fly)
- $444,152
- Comps found
- 12
Show comp detail 12 sales within ~0.75 mi
| Address | Dist | Beds/Ba | Sqft | Sold | Price | $/sf | Match |
|---|---|---|---|---|---|---|---|
| 1069 Colonial Meadows Way | 0.01mi | 3/2.5 | 1,882 (0%) | 6mo | $430,000 | $228 | 94 |
| 1002 Colonial Meadows Way | 0.13mi | 3/2.5 | 1,882 (0%) | 2mo | $445,000 | $236 | 92 |
| 1037 Colonial Meadows Way | 0.04mi | 3/2.5 | 1,953 (+4%) | 2mo | $461,000 | $236 | 90 |
| 1833 Durham W | 0.27mi | 3/2.5 | 1,890 (+0%) | 2mo | $399,000 | $211 | 84 |
| 913 Royal Cove Way | 0.08mi | 3/2.5 | 2,014 (+7%) | 2mo | $620,000 | $308 | 83 |
| 909 Royal Cove Way | 0.08mi | 3/2.5 | 2,014 (+7%) | 5mo | $570,000 | $283 | 80 |
| 949 Royal Cove Way | 0.13mi | 3/2.5 | 2,014 (+7%) | 3mo | $570,000 | $283 | 80 |
| 1018 Colonial Meadows Way | 0.10mi | 3/2.5 | 1,656 (-12%) | 3mo | $404,900 | $245 | 73 |
| 1067 Hanson Way | 0.41mi | 3/3.0 | 1,708 (-9%) | 0mo | $365,000 | $214 | 63 |
| 972 Colonial Meadows Way | 0.20mi | 2/2.5 (-1) | 1,656 (-12%) | 4mo | $395,000 | $239 | 62 |
| 1005 Hanson Way | 0.43mi | 2/2.5 (-1) | 1,725 (-8%) | 2mo | $350,000 | $203 | 59 |
| 1102 Noble Walk Ct | 0.63mi | 3/2.5 | 2,008 (+7%) | 1mo | $410,000 | $204 | 58 |
Match score weights: distance 35% · size 25% · config 20% · recency 20%. Top-matched comps best support the ARV.
Projected returns pro-forma
-3.0% appreciation · 6.62% rent growth · sell at horizon
- IRR
- -15.7%
- Equity multiple
- 0.42×
- Total profit
- $-62,162
- Equity at exit
- $57,405
- IRR
- -2.3%
- Equity multiple
- 0.82×
- Total profit
- $-19,382
- Equity at exit
- $33,288
Cash invested: $107,800 (down + closing). Projections, not guarantees.
Landlord ↔ Tenant lean methodology
- Overall (STATE)
- 55 Moderately Landlord-Leaning
- State Virginia
- 55 Moderately Landlord-Leaning · D+2
- County
- — inherits STATE
- City
- — inherits STATE
ZIP-level market 23454
- Rents YoY
- 6.6%
- Active inventory
- 209
- Price-to-rent
- 11.0×
Monthly cashflow live
- Estimated rent
- $2,929 high interval (Pro) →
- Mortgage (P&I)
- −$2,019
- Tax from tax record
- −$303 /mo · $3,639/yr
- Insurance
- −$160
- HOA
- −$0
- Vacancy / Maint / Mgmt
- −$615
- Net cashflow
- $-169
Break-even live
Sensitivity live
| Price | -10% $49 | -5% $-60 | +0% $-169 | +5% $-278 | +10% $-387 |
|---|---|---|---|---|---|
| Rent | -10% $-400 | -5% $-285 | +0% $-169 | +5% $-53 | +10% $62 |
| Rate | -1.0pp $25 | -0.5pp $-71 | base $-169 | +0.5pp $-269 | +1.0pp $-370 |
UW: 25.0% down · 7.5% · 30yr · 1.5% tax · 5.0% vac · 8.0% maint · 8.0% mgmt
Financing live
Cash to close
- Down payment
- $96,250
- Closing costs
- $11,550
- Reserves months
- —
- Total cash needed
- —
Loan-product check · same deal, 3 products live
Conventional
25% down · 7.5% · 30yr
- Down + closing
- —
- Monthly P&I
- —
- Monthly cashflow
- —
- DSCR
- —
- Eligible?
- —
Personal DTI + credit; lowest rate.
DSCR
20% down · 8.5% · 30yr
- Down + closing
- —
- Monthly P&I
- —
- Monthly cashflow
- —
- DSCR
- —
- Eligible?
- —
No personal income docs; deal must DSCR.
Hard money
10% down · 12.0% · 12mo
- Down + closing
- —
- Monthly P&I
- —
- Monthly cashflow
- —
- DSCR
- —
- Eligible?
- —
Short-term bridge; refi at stabilization.
Rent comps 10 comps
| Address | Beds | Baths | Sqft | Rent | $/sqft | DOM | Units | Dist |
|---|---|---|---|---|---|---|---|---|
| 1002 Colonial Meadows Way Virginia Beach, VA | 3.0 | 2.5 | 1882 | $3,300 | $1.75 | 19d | 1 | 0.12mi |
| 1821 Durham W Virginia Beach, VA | 3.0 | 2.5 | 1780 | $2,500 | $1.40 | 25d | 1 | 0.23mi |
| 1044 Commodore Dr Virginia Beach, VA | 3.0 | 2.0 | 2418 | $4,100 | $1.70 | 4d | 1 | 0.89mi |
| 1997 Eastwood Villa Ln Virginia Beach, VA | 1.0–3.0 | 1.0–2.5 | 1117 | $2,209 | $1.98 | 18d | 1 | 1.01mi |
| 1441 Laskin Rd Virginia Beach, VA | 1.0–3.0 | 1.0–3.0 | 1226 | $3,400 | $2.77 | 6d | 9 | 1.01mi |
| 1441 Reynard Dr Virginia Beach, VA | 1.0–4.0 | 1.0–2.5 | 1080 | $2,495 | $2.31 | 3d | 19 | 1.05mi |
| 1334 Linkhorn Cir Virginia Beach, VA | 3.0 | 2.5 | 1532 | $3,400 | $2.22 | 25d | 1 | 1.12mi |
| 2012 Breton Ct Virginia Beach, VA | 4.0 | 2.5 | 2200 | $2,900 | $1.32 | 22d | 1 | 1.15mi |
| 1812 Ashley Dr Virginia Beach, VA | 3.0 | 2.0 | 1736 | $2,350 | $1.35 | 9d | 1 | 1.40mi |
| 233 Sykes Ave Unit A Virginia Beach, VA | 3.0 | 2.5 | 1484 | $2,450 | $1.65 | 13d | 1 | 1.48mi |
Listing history 7 events
-
2026-06-21statusdays on market $385,000 Under Contract 9 DOM
-
2026-06-18days on market $385,000 Active Under Contract 7 DOM
-
2026-06-17days on market $385,000 Active Under Contract 6 DOM
-
2026-06-16statusdays on market $385,000 Active Under Contract 5 DOM
-
2026-06-15days on market $385,000 Active 4 DOM
-
2026-06-13remarks 301-char remark
-
2026-06-13$385,000 Active 2 DOM
ⓘ Source: listings_history table (triggers on properties + properties_extension) + one-shot
backfill from property_details.listing_events for pre-trigger history.
Tax reassessment forecast VA · Resets to sale price
- Current annual tax
- $3,639 · $303/mo
- Projected year-2 tax
- $3,639 · $303/mo
- Expected delta
- $0/yr ($0/mo · 0.0%)
ⓘ Screening estimate from a state-policy table — verify with the county assessor before closing.
Climate risk First Street
- Flood 1/10 Low FEMA zone X (unshaded) · 0% chance over 30 yrs
- Wildfire 1/10 Low
- Heat 9/10 Extreme 7 d/yr ≥103°F today · 17 d/yr by 30 yrs out
- Wind 8/10 Severe 99% chance of damaging wind over 30 yrs
- Air quality 2/10 Low 1 unhealthy d/yr today · 1 by 30 yrs out
Nearby sold comps map
Loading sold comps map…
Walkable amenities ~0.75 mi
Loading nearby amenities…
Taxation est. · year 1
- Rental income
- $35,144
- − Mortgage interest
- −$21,566
- − Property taxes
- −$3,639
- − Insurance
- −$1,925
- − Repairs & maintenance
- −$2,812
- − Management
- −$2,812
- − Depreciation
- −$11,200
- Taxable loss
- −$8,809
- Est. tax savings @ 24.0%
- +$2,114
- After-tax cash flow
- $86/yr
For passive investors: Depreciation is non-cash, so a rental often shows a tax loss while cash-flowing — sheltering income. Rental losses are passive: they offset passive income freely, and up to $25,000/yr can offset ordinary (W-2) income if you actively participate and your MAGI is under $100k (phasing out to $0 by $150k); unused losses carry forward. On sale, claimed depreciation is recaptured at up to 25%, and gains may owe capital-gains tax (a 1031 exchange can defer both). Figures are a year-1 estimate at your 24.0% rate — not tax advice; consult a CPA.
Schools (NCES district)
- District
- Va Beach City Public School District
- NCES district ID
- 5103840
- Math proficiency
- 69% ▼ -19.00%
- Reading proficiency
- 78% ▼ -7.00%
- Median HH income
- $66,452
- Composite
- 63.81/100
- National rank
- #594
- State rank
- #10 of 131 in VA
Livability — Virginia Beach
- Score
- 83/100
- State rank
- #38
- US rank
- #880
Category grades
Schools grade is shown separately in the Schools card above.
Census & demographics
- Census place
- Virginia Beach, VA
- County
- Virginia Beach City · 448,227 people
- City population
- 448,227
- Metro
- Virginia Beach-Norfolk-Newport News, VA-NC
- Population (ZIP)
- 58,178
- Household income
- $102,796
- Rent vs Own
- Severe rent burden
- 1696.0
Population outlook (Virginia Beach County) Hauer SSP2
- Today (2025)
- 480,401 people
- By 2030
- 491,221 · +2.3%
- By 2040
- 504,882 · +5.1%
- By 2050
- 508,847 · +5.9%
- By 2075
- 504,831 · +5.1%
- By 2100
- 465,867 · -3.0%
Race, ethnicity, and origin ACS 2023
- Neighborhood character
- Predominantly White (69%)
- Race & ethnicity
- White 69% Black 13% Two or more races 9% Hispanic / Latino 7% Asian 4%
- Hispanic origin (detail)
- Mexican 2% Puerto Rican 2%
- Common ancestry
- Romanian 3% Lithuanian 3% Slovak 3%
- Foreign-born
- 7% · Canada, China
- Languages at home
- 90% English-only · Spanish 4% Tagalog/Filipino 1% Chinese 1%
Political lean MEDSL · Virginia Beach
- 2024 margin
- Toss-up / Even · D 50.7% · R 48.0% · Other 1.3%
- 2008→2024 swing
- +3.4pp toward D · 2008: -0.7pp · 2024: 2.6pp
- All cycles
- 2024: D+2.6 2020: D+5.4 2016: R+4.5 2012: R+2.5 2008: R+0.7
Not yet ingested
- Civics
- —
Market trends
- HPI YoY
- ▼ -385.89%
- Current HPI
- 328.85
- Rent YoY
- ▲ 6.62%
- Metro
- Virginia Beach-Norfolk-Newport News, VA-NC
- State GDP YoY
- ▲ 2.40%
- F500 in state
- 50
Industry mix (Fortune 500 HQ in VA)
| Industry | F500 HQs | Revenue |
|---|---|---|
| Aerospace / Defense | 4 | $236B |
|
||
| Technology / Defense | 3 | $32B |
|
||
| Financial Services | 2 | $176B |
|
||
| Utilities | 2 | $27B |
|
||
| Insurance | 2 | $25B |
|
||
| Technology | 2 | $15B |
|
||
Price history
+282.7% since first listed2 events — show timeline
- 2026-06-11 Listed $385,000 REINMLS
- 1986-07-29 Sold (Public Records) $100,600 Public Records
Property tax history
+3.1%/yrLatest (2025): $3,639 · +5.3% YoY. Source: county tax records.
Cash-flow waterfall
monthlySold comps — $/sqft
last 12 mo · ≤1 miLoading sold comps…