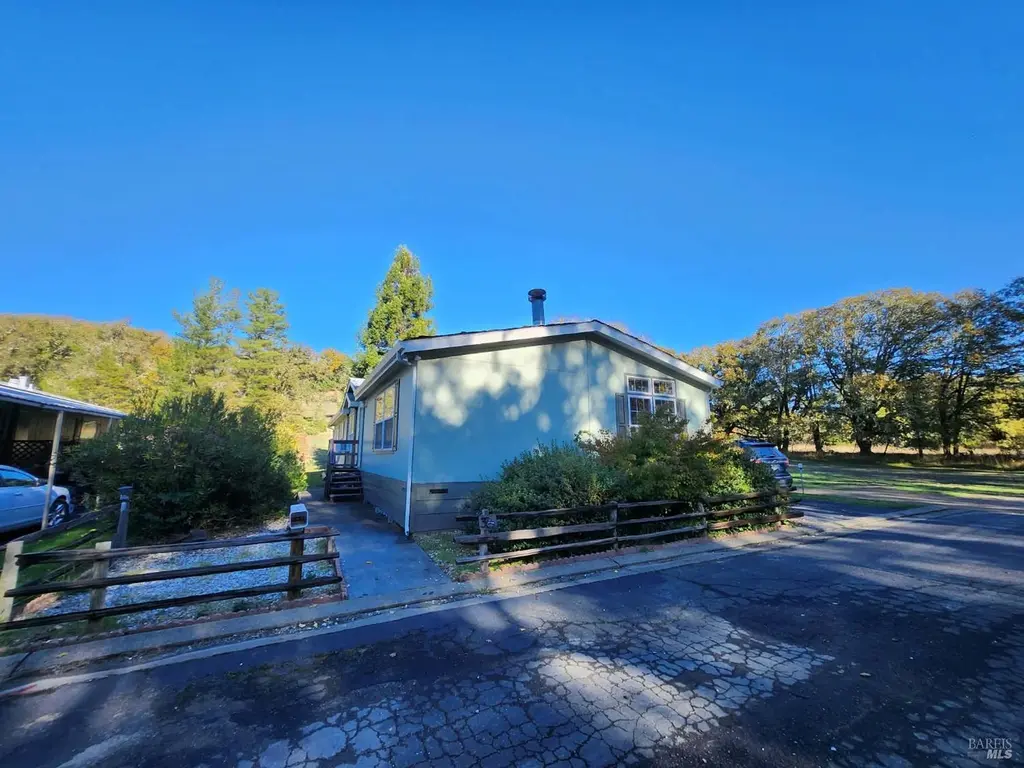
19401 Walker Rd #30 · Willits, CA
Flood risk 9/10 · Severe
- FEMA flood zone
- X (unshaded)
- Chance of flooding over 30 yrs
- 0.99%
- Est. flood insurance / yr
- $507 – $1,088
Fire risk 6/10 · Moderate
- Est. fire insurance / yr
- $659 – $1,223
Heat risk 5/10 · Moderate
- Hot days now (above 93°F)
- 7 days/yr
- Hot days in 30 yrs
- 16 days/yr
Wind risk 1/10 · Minimal
- Chance of severe wind over 30 yrs
- —
Air-quality risk 10/10 · Severe
- Unhealthy air days now
- 34 days/yr
- Unhealthy air days in 30 yrs
- 36 days/yr
Risk factors via First Street. Map © Google.
Why this score? — see what drove the B- grade
The composite is a weighted blend of 9 inputs, each scored 0–100. Each bar is that input's sub-score; the figure is the points it added to the 100-point composite (weight × sub-score).
- Cash flow +30.0/30.0
- DSCR +10.0/10.0
- 1% rule +9.2/10.0
- ARV discount +7.5/15.0
- Livability +3.2/5.0
- Rent growth +2.5/5.0
- Condition / age +2.5/5.0
- Schools +1.4/10.0
- Appreciation +0.0/10.0
$139,000
🖨 Deal sheet (PDF) 📄 Offer letter ✓ Due diligence
Listing remarks MLS
Spacious 3 bed 2 bath home almost, 1800 sq. ft.,in a lovely setting at the edge of the park. Open fields and lovely views with a short walk to the swimming pool. The Entertainer Ultra model comes with a bonus family room and office in the Master bedroom. Minutes to Willits or Ukiah with easy highway access.
Key facts
- 2 parking spots
- Built 2004
- Listed 46 days
Property features AI
Finance
- Financial info: Future space rent: 0
- HOA & community: No association; Not a senior community
Exterior
- Parking: Detached off-street parking for 2 vehicles
- Utilities: Public sewer; Cable available; Internet available; No on-site power production
- Home design: Manufactured in park (double wide); Located in Parkside community; Land lease
- Construction: Fleetwood manufacturer; Entertainer model; Vinyl skirt
- Exterior features: Shingle roof; Shed(s)
Interior
- Kitchen: Dishwasher; Disposal; Microwave
- Bedrooms: 3 bedrooms
- Flooring: Carpet; Laminate
- Bathrooms: 2 full bathrooms; Double sinks; Jetted tub; Shower stall(s); Tub with shower over
- Heating & cooling: Central heating; Window unit(s) for cooling
- Interior features: Dishwasher; Disposal; Microwave; Wood-burning fireplace; Bonus room
- Laundry & utility: Washer included
Neighborhood map
What this means for you Summary
Snapshot
- This is a 3-bed/2.0-bath manufactured listed at $139k.
Deal economics
- At list price, monthly cash flow is $618 ($7k/yr) — positive.
- The deal already cash-flows at list — no discount required.
- Meets the 1% rule at list price ($2k rent vs $139k).
- Recommended offer: $135k (3.0% below list) — sets the bar for market timing.
- Cap rate 12.2% vs local median 2.6% in Willits — top-decile yield for the area; either an underpriced asset or a hidden risk that comps aren't pricing in. Stress-test before assuming the spread holds.
Location & tenants
- Location reads 65/100 on livability (#377 in CA) — a middle-class / working-renter tenant base. Strengths: crime A+, health & safety A+; Watch: amenities D, commute F, employment F.
- Willits Unified (town): math 9% / reading 24% proficiency, ranked #486 of 517 in CA (top 94%) — low school quality limits family demand, transient renter base, plan for 1-2y turnover; 66% free/reduced lunch — lower-income household profile, screen leases tightly.
- Market conditions: 149 active listings in the ZIP; 8 units permitted in Mendocino County in 2024 (0 in 5+ unit buildings).
Forward outlook
- Local home prices are declining (-3.0%/yr); year-one equity from $961 of loan paydown is wiped out by about $4k of value loss. Plan a longer hold.
- Mendocino County population projected at -15% by 2050 — secular population decline; favor cash flow + early exit over multi-decade hold.
- At projected returns (-3.0% appreciation + 3.0% rent growth), your $39k cash investment doubles in ~7 years — after that, you're playing with house money.
Negotiation context
- It's been on market 47 days — a 3% lower offer ($135k) is reasonable based on typical stale-listing flexibility.
- 3 sale attempts since 10y ago with the ask held roughly flat each time — persistent listings suggest the price (not the market) is what's stuck; bring a comps-based counter.
- Current owner paid $91k; list at $139k implies a 53% gain — meaningful room to come down on a strong offer.
Risks & watch-outs
- Watch-outs: flood insurance adds $66/mo.
- Climate carrying-cost: severe flood risk; major wildfire risk; extreme-heat days projected 7→16/yr by 2055 (HVAC capex compounding) — expect insurance premiums to compound above CPI over the hold.
Questions for the listing agent
- It's been on market 47 days. Have you received any prior offers? Is the seller open to a 3% concession, seller financing, or rate buy-down credit?
- What's the actual annual flood-insurance premium (NFIP or private), and is the property in a SFHA with mandatory coverage?
- Is there a deadline driving the sale (1031 exchange, divorce, estate, relocation)? That informs how much negotiation room exists.
- What's the average days-on-market for RENTAL listings here right now (not sales)? A rising rental-DOM trend means longer vacancies and softer asking-rent achievability than the comps imply.
- What's the recent tenant-quality profile in this submarket — average credit score on applications, eviction rate, late-payment / NSF rate, and stable-employment percentage? A property-management company in the area should have these aggregated.
- How much new for-sale + rental construction is in the pipeline within 1–3 miles? Heavy new supply typically softens prices + rents 12–24 months out; constrained supply supports both.
Investment metrics
- 1% rule
- 1.42% ✓
- Cap rate
- 12.20%
- Cash-on-cash
- 21.09%
- DSCR
- 1.94
- GRM
- 5.9
CMA / ARV
No comps found within radius.
Projected returns pro-forma
-3.0% appreciation · 3.0% rent growth · sell at horizon
- IRR
- 10.9%
- Equity multiple
- 1.43×
- Total profit
- $16,839
- Equity at exit
- $20,725
- IRR
- 20.0%
- Equity multiple
- 2.68×
- Total profit
- $65,407
- Equity at exit
- $12,018
Cash invested: $38,920 (down + closing). Projections, not guarantees.
Landlord ↔ Tenant lean methodology
- Overall (STATE)
- 18 Strongly Tenant-Friendly
- State California
- 18 Strongly Tenant-Friendly · D+13
- County
- — inherits STATE
- City
- — inherits STATE
ZIP-level market 95490
- Active inventory
- 149
- Price-to-rent
- 5.9×
Monthly cashflow live
- Estimated rent
- $1,979 medium interval (Pro) →
- Mortgage (P&I)
- −$729
- Tax from tax record
- −$93 /mo · $1,111/yr
- Insurance
- −$58
- Flood insurance flood zone
- −$66 /mo · $798/yr
- HOA
- −$0
- Vacancy / Maint / Mgmt
- −$416
- Net cashflow
- $618
Break-even live
Sensitivity live
| Price | -10% $696 | -5% $657 | +0% $618 | +5% $578 | +10% $539 |
|---|---|---|---|---|---|
| Rent | -10% $461 | -5% $540 | +0% $618 | +5% $696 | +10% $774 |
| Rate | -1.0pp $688 | -0.5pp $653 | base $618 | +0.5pp $582 | +1.0pp $545 |
UW: 25.0% down · 7.5% · 30yr · 1.5% tax · 5.0% vac · 8.0% maint · 8.0% mgmt
Financing live
Cash to close
- Down payment
- $34,750
- Closing costs
- $4,170
- Reserves months
- —
- Total cash needed
- —
Loan-product check · same deal, 3 products live
Conventional
25% down · 7.5% · 30yr
- Down + closing
- —
- Monthly P&I
- —
- Monthly cashflow
- —
- DSCR
- —
- Eligible?
- —
Personal DTI + credit; lowest rate.
DSCR
20% down · 8.5% · 30yr
- Down + closing
- —
- Monthly P&I
- —
- Monthly cashflow
- —
- DSCR
- —
- Eligible?
- —
No personal income docs; deal must DSCR.
Hard money
10% down · 12.0% · 12mo
- Down + closing
- —
- Monthly P&I
- —
- Monthly cashflow
- —
- DSCR
- —
- Eligible?
- —
Short-term bridge; refi at stabilization.
Listing history 18 events
-
2026-06-19days on market $139,000 Active 47 DOM
-
2026-06-18days on market $139,000 Active 46 DOM
-
2026-06-17days on market $139,000 Active 45 DOM
-
2026-06-16days on market $139,000 Active 44 DOM
-
2026-06-15days on market $139,000 Active 43 DOM
-
2026-06-14days on market $139,000 Active 41 DOM
-
2026-06-09days on market $139,000 Active 40 DOM
-
2026-06-08days on market $139,000 Active 39 DOM
-
2026-06-07days on market $139,000 Active 38 DOM
-
2026-06-07days on market $139,000 Active 37 DOM
-
2026-06-04days on market $139,000 Active 34 DOM
-
2026-06-02days on market $139,000 Active 33 DOM
-
2026-06-01days on market $139,000 Active 32 DOM
-
2026-05-31days on market $139,000 Active 31 DOM
-
2026-05-31days on market $139,000 Active 30 DOM
-
2026-03-29$139,000 Active 1251-char remark
-
2016-09-30soldstatus $91,000 308-char remark
Show marketing remark (308 chars)
Spacious 3 bed 2 bath home almost, 1800 sq. ft.,in a lovely setting at the edge of the park. Open fields and lovely views with a short walk to the swimming pool. The Entertainer Ultra model comes with a bonus family room and office in the Master bedroom. Minutes to Willits or Ukiah with easy highway access.
-
2016-07-25$85,000 308-char remark
Show marketing remark (308 chars)
Spacious 3 bed 2 bath home almost, 1800 sq. ft.,in a lovely setting at the edge of the park. Open fields and lovely views with a short walk to the swimming pool. The Entertainer Ultra model comes with a bonus family room and office in the Master bedroom. Minutes to Willits or Ukiah with easy highway access.
ⓘ Source: listings_history table (triggers on properties + properties_extension) + one-shot
backfill from property_details.listing_events for pre-trigger history.
Tax reassessment forecast CA · Resets to sale price
- Current annual tax
- $1,111 · $93/mo
- Projected year-2 tax
- $1,111 · $93/mo
- Expected delta
- $0/yr ($0/mo · 0.0%)
ⓘ Screening estimate from a state-policy table — verify with the county assessor before closing.
Climate risk First Street
- Flood 9/10 Extreme FEMA zone X (unshaded) · 99% chance over 30 yrs
- Wildfire 6/10 Major
- Heat 5/10 Major 7 d/yr ≥93°F today · 16 d/yr by 30 yrs out
- Wind 1/10 Low
- Air quality 10/10 Extreme 34 unhealthy d/yr today · 36 by 30 yrs out
Nearby sold comps map
Loading sold comps map…
Walkable amenities ~0.75 mi
Loading nearby amenities…
Taxation est. · year 1
- Rental income
- $23,751
- − Mortgage interest
- −$7,786
- − Property taxes
- −$1,111
- − Insurance
- −$1,492
- − Repairs & maintenance
- −$1,900
- − Management
- −$1,900
- − Depreciation
- −$4,044
- Taxable income
- $5,517
- Est. tax owed @ 24.0%
- −$1,324
- After-tax cash flow
- $6,088/yr
For passive investors: Depreciation is non-cash, so a rental often shows a tax loss while cash-flowing — sheltering income. Rental losses are passive: they offset passive income freely, and up to $25,000/yr can offset ordinary (W-2) income if you actively participate and your MAGI is under $100k (phasing out to $0 by $150k); unused losses carry forward. On sale, claimed depreciation is recaptured at up to 25%, and gains may owe capital-gains tax (a 1031 exchange can defer both). Figures are a year-1 estimate at your 24.0% rate — not tax advice; consult a CPA.
Schools (NCES district)
- District
- Willits Unified
- NCES district ID
- 0642560
- Math proficiency
- 9% ▼ -11.00%
- Reading proficiency
- 24% ▼ -3.00%
- Median HH income
- $41,494
- Composite
- 14.14/100
- National rank
- #9455
- State rank
- #486 of 517 in CA
Livability — Willits
- Score
- 65/100
- State rank
- #377
- US rank
- #12923
Category grades
Schools grade is shown separately in the Schools card above.
Census & demographics
- Population (ZIP)
- 14,627
Population outlook (Mendocino County) Hauer SSP2
- Today (2025)
- 84,643 people
- By 2030
- 82,138 · -3.0%
- By 2040
- 76,402 · -9.7%
- By 2050
- 71,759 · -15.2%
- By 2075
- 61,454 · -27.4%
- By 2100
- 50,130 · -40.8%
Race, ethnicity, and origin ACS 2023
- Neighborhood character
- Predominantly White (68%)
- Race & ethnicity
- White 68% Hispanic / Latino 23% Two or more races 18% Native American 4% Asian 2%
- Hispanic origin (detail)
- Mexican 17%
- Common ancestry
- Italian 5% Slovak 5% Lithuanian 3%
- Foreign-born
- 6% · Canada, China
- Languages at home
- 86% English-only · Spanish 11% Chinese 1%
Political lean MEDSL · Mendocino
- 2024 margin
- Strong D (+26.8) · D 61.3% · R 34.5% · Other 4.2%
- 2008→2024 swing
- -16.0pp toward R · 2008: 42.8pp · 2024: 26.8pp
- All cycles
- 2024: D+26.8 2020: D+35.8 2016: D+29.1 2012: D+37.6 2008: D+42.8
Not yet ingested
- Civics
- —
Market trends
- HPI YoY
- ▼ -233.81%
- Current HPI
- 155.0788
- Rent YoY
- —
- Metro
- —
- State GDP YoY
- ▲ 3.21%
- F500 in state
- 116
Industry mix (Fortune 500 HQ in CA)
| Industry | F500 HQs | Revenue |
|---|---|---|
| Technology | 27 | $1,492B |
|
||
| Financial Services | 3 | $174B |
|
||
| Retail | 3 | $44B |
|
||
| Insurance | 3 | $26B |
|
||
| Media / Entertainment | 2 | $115B |
|
||
| Pharmaceuticals / Biotech | 2 | $62B |
|
||
Price history
+63.5% since first listed4 events — show timeline
- 2026-06-13 Relisted — BAREIS
- 2026-03-29 Listed $139,000 BAREIS
- 2016-09-30 Sold (MLS) $91,000 BAREIS
- 2016-07-25 Listed $85,000 BAREIS
Property tax history
+1.9%/yrLatest (2025): $1,111 · +2.0% YoY. Source: county tax records.
Cash-flow waterfall
monthlySold comps — $/sqft
last 12 mo · ≤1 miLoading sold comps…