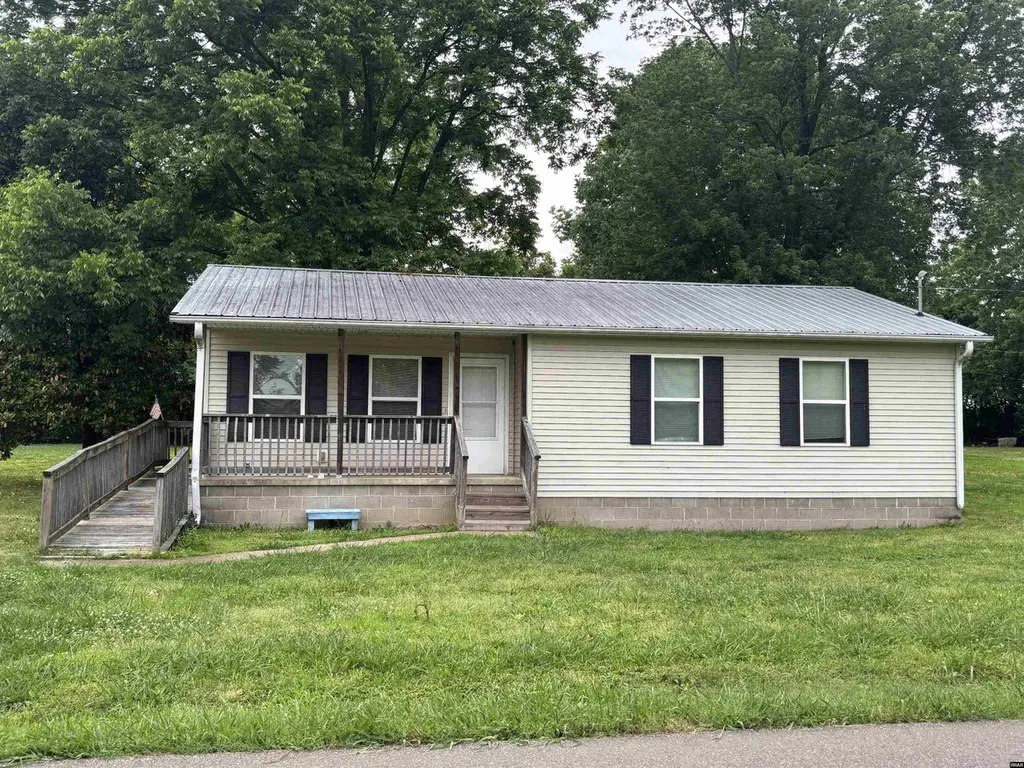
505 Eden Ave. Ave · Hickman, KY
Flood risk 1/10 · Minimal
- FEMA flood zone
- X (unshaded)
- Chance of flooding over 30 yrs
- 0.0%
- Est. flood insurance / yr
- $507 – $1,088
Fire risk 2/10 · Minimal
- Est. fire insurance / yr
- $839 – $1,559
Heat risk 5/10 · Moderate
- Hot days now (above 109°F)
- 7 days/yr
- Hot days in 30 yrs
- 21 days/yr
Wind risk 4/10 · Minor
- Chance of severe wind over 30 yrs
- 7.0%
Air-quality risk 2/10 · Minimal
- Unhealthy air days now
- 0 days/yr
- Unhealthy air days in 30 yrs
- 1 days/yr
Risk factors via First Street. Map © Google.
Why this score? — see what drove the B- grade
The composite is a weighted blend of 9 inputs, each scored 0–100. Each bar is that input's sub-score; the figure is the points it added to the 100-point composite (weight × sub-score).
- Cash flow +27.8/30.0
- DSCR +9.8/10.0
- ARV discount +7.5/15.0
- Appreciation +6.7/10.0
- 1% rule +6.4/10.0
- Livability +3.2/5.0
- Rent growth +2.5/5.0
- Condition / age +2.5/5.0
- Schools +2.2/10.0
$92,500
🖨 Deal sheet (PDF) 📄 Offer letter ✓ Due diligence
Listing remarks
Nice house, built in 2009, needs minor updating, floor coverings. Metal roof, Kitchen, dining room, living room, three bedrooms and one and one-half baths. So much potential and priced to sell. Last house on street, private location. Do not miss this one.
Key facts
- Metal roof
- Private location
- 0.52 acre lot
Tags
Property features AI
Exterior
- Utilities: Public water; Public sewer
- Home design: Single-family residence (Residential property)
- Construction: Vinyl siding; Metal roof
- Exterior features: Level lot with many trees; Lot dimensions approximately 150 x 150
Interior
- Kitchen: Refrigerator; Range
- Flooring: Carpet; Vinyl
- Bathrooms: 1 full bathroom; 1 half bathroom
- Heating & cooling: Central heating; Central air conditioning
- Interior features: Fireplace (1) — currently listed as having a fireplace; 7 total rooms; Crawl space basement
Neighborhood map
What this means for you Summary
Snapshot
- This is a 3-bed/1.5-bath other listed at $92k.
Deal economics
- At list price, monthly cash flow is $281 ($3k/yr) — positive.
- The deal already cash-flows at list — no discount required.
- Meets the 1% rule at list price ($1k rent vs $92k).
- Recommended offer: $91k (1.5% below list) — sets the bar for market timing.
Location & tenants
- Location reads 64/100 on livability (#308 in KY) — a middle-class / working-renter tenant base. Strengths: cost of living A+, housing A+, crime A; Watch: health & safety C-, amenities F, commute F.
- Fulton County (rural): math 20% / reading 33% proficiency, ranked #138 of 165 in KY (top 84%) — low school quality limits family demand, transient renter base, plan for 1-2y turnover; 74% free/reduced lunch — lower-income household profile, screen leases tightly.
- Zoned schools: Fulton County Elementary (math 27% / reading 42%, grade F, #301 of 676 statewide, top 48%, 331 students, 75% FRL); Fulton County Middle School (math 17% / reading 32%, grade F, #189 of 217 statewide, top 89%, 134 students, 75% FRL); Fulton County High School (math 24% / reading 24%, grade F, #179 of 254 statewide, top 78%, 175 students, 66% FRL) — zoned schools at 72% FRL track the district average.
- Market conditions: 15 active listings in the ZIP.
Forward outlook
- In year one you build about $4k of equity ($640 loan paydown + $3k appreciation (3.5% local appreciation)).
- Fulton County population projected at -24% by 2050 — secular population decline; favor cash flow + early exit over multi-decade hold.
- At projected returns (3.5% appreciation + 3.0% rent growth), your $26k cash investment doubles in ~4 years — after that, you're playing with house money.
- By year 9, paydown + projected appreciation supports a ~$33k cash-out refi (75% LTV) — recoverable capital for the next deal without selling this one.
Negotiation context
- It's been on market 28 days — a 2% lower offer ($91k) is reasonable based on typical stale-listing flexibility.
- Current owner paid $12k; list at $92k implies a 640% gain — meaningful room to come down on a strong offer.
Risks & watch-outs
- Climate carrying-cost: extreme-heat days projected 7→21/yr by 2055 (HVAC capex compounding) — expect insurance premiums to compound above CPI over the hold.
Questions for the listing agent
- Is there a deadline driving the sale (1031 exchange, divorce, estate, relocation)? That informs how much negotiation room exists.
- Schools are F-rated, which usually means shorter tenancies and higher turnover. Who's the typical renter profile here, and what's been the actual vacancy rate?
- What's the average days-on-market for RENTAL listings here right now (not sales)? A rising rental-DOM trend means longer vacancies and softer asking-rent achievability than the comps imply.
- What's the recent tenant-quality profile in this submarket — average credit score on applications, eviction rate, late-payment / NSF rate, and stable-employment percentage? A property-management company in the area should have these aggregated.
- How much new for-sale + rental construction is in the pipeline within 1–3 miles? Heavy new supply typically softens prices + rents 12–24 months out; constrained supply supports both.
Investment metrics
- 1% rule
- 1.14% ✓
- Cap rate
- 9.94%
- Cash-on-cash
- 13.04%
- DSCR
- 1.58
- GRM
- 7.3
CMA / ARV
No comps found within radius.
Projected returns pro-forma
3.49% appreciation · 3.0% rent growth · sell at horizon
- IRR
- 20.8%
- Equity multiple
- 2.21×
- Total profit
- $31,451
- Equity at exit
- $44,172
- IRR
- 21.5%
- Equity multiple
- 4.24×
- Total profit
- $83,869
- Equity at exit
- $70,152
Cash invested: $25,900 (down + closing). Projections, not guarantees.
Landlord ↔ Tenant lean methodology
- Overall (STATE)
- 83 Strongly Landlord-Friendly
- State Kentucky
- 83 Strongly Landlord-Friendly · R+16
- County
- — inherits STATE
- City
- — inherits STATE
ZIP-level market 42050
- Home prices YoY
- 2.9%
- Active inventory
- 15
- Price-to-rent
- 7.3×
Monthly cashflow live
- Estimated rent
- $1,056 medium interval (Pro) →
- Mortgage (P&I)
- −$485
- Tax from tax record
- −$29 /mo · $348/yr
- Insurance
- −$39
- HOA
- −$0
- Vacancy / Maint / Mgmt
- −$222
- Net cashflow
- $281
Break-even live
Sensitivity live
| Price | -10% $334 | -5% $308 | +0% $281 | +5% $255 | +10% $229 |
|---|---|---|---|---|---|
| Rent | -10% $198 | -5% $240 | +0% $281 | +5% $323 | +10% $365 |
| Rate | -1.0pp $328 | -0.5pp $305 | base $281 | +0.5pp $257 | +1.0pp $233 |
UW: 25.0% down · 7.5% · 30yr · 1.5% tax · 5.0% vac · 8.0% maint · 8.0% mgmt
Financing live
Cash to close
- Down payment
- $23,125
- Closing costs
- $2,775
- Reserves months
- —
- Total cash needed
- —
Loan-product check · same deal, 3 products live
Conventional
25% down · 7.5% · 30yr
- Down + closing
- —
- Monthly P&I
- —
- Monthly cashflow
- —
- DSCR
- —
- Eligible?
- —
Personal DTI + credit; lowest rate.
DSCR
20% down · 8.5% · 30yr
- Down + closing
- —
- Monthly P&I
- —
- Monthly cashflow
- —
- DSCR
- —
- Eligible?
- —
No personal income docs; deal must DSCR.
Hard money
10% down · 12.0% · 12mo
- Down + closing
- —
- Monthly P&I
- —
- Monthly cashflow
- —
- DSCR
- —
- Eligible?
- —
Short-term bridge; refi at stabilization.
Listing history 19 events
-
2026-06-21days on market $92,500 Active 28 DOM
-
2026-06-21days on market $92,500 Active 27 DOM
-
2026-06-18days on market $92,500 Active 25 DOM
-
2026-06-17days on market $92,500 Active 24 DOM
-
2026-06-16days on market $92,500 Active 23 DOM
-
2026-06-15days on market $92,500 Active 22 DOM
-
2026-06-13days on market $92,500 Active 20 DOM
-
2026-06-12days on market $92,500 Active 19 DOM
-
2026-06-09days on market $92,500 Active 16 DOM
-
2026-06-08days on market $92,500 Active 15 DOM
-
2026-06-07days on market $92,500 Active 14 DOM
-
2026-06-07days on market $92,500 Active 13 DOM
-
2026-06-04days on market $92,500 Active 10 DOM
-
2026-06-02days on market $92,500 Active 9 DOM
-
2026-06-01days on market $92,500 Active 8 DOM
-
2026-05-31days on market $92,500 Active 7 DOM
-
2026-05-31days on market $92,500 Active 6 DOM
-
2026-05-24$92,500 Active
-
2004-09-21soldstatus $12,500
ⓘ Source: listings_history table (triggers on properties + properties_extension) + one-shot
backfill from property_details.listing_events for pre-trigger history.
Tax reassessment forecast KY · Resets to sale price
- Current annual tax
- $348 · $29/mo
- Projected year-2 tax
- $796 · $66/mo
- Expected delta
- +$447/yr (+$37/mo · 128.5%)
ⓘ Screening estimate from a state-policy table — verify with the county assessor before closing.
Climate risk First Street
- Flood 1/10 Low FEMA zone X (unshaded) · 0% chance over 30 yrs
- Wildfire 2/10 Low
- Heat 5/10 Major 7 d/yr ≥109°F today · 21 d/yr by 30 yrs out
- Wind 4/10 Moderate 7% chance of damaging wind over 30 yrs
- Air quality 2/10 Low 0 unhealthy d/yr today · 1 by 30 yrs out
Nearby sold comps map
Loading sold comps map…
Walkable amenities ~0.75 mi
Loading nearby amenities…
Taxation est. · year 1
- Rental income
- $12,668
- − Mortgage interest
- −$5,181
- − Property taxes
- −$348
- − Insurance
- −$462
- − Repairs & maintenance
- −$1,013
- − Management
- −$1,013
- − Depreciation
- −$2,691
- Taxable income
- $1,958
- Est. tax owed @ 24.0%
- −$470
- After-tax cash flow
- $2,906/yr
For passive investors: Depreciation is non-cash, so a rental often shows a tax loss while cash-flowing — sheltering income. Rental losses are passive: they offset passive income freely, and up to $25,000/yr can offset ordinary (W-2) income if you actively participate and your MAGI is under $100k (phasing out to $0 by $150k); unused losses carry forward. On sale, claimed depreciation is recaptured at up to 25%, and gains may owe capital-gains tax (a 1031 exchange can defer both). Figures are a year-1 estimate at your 24.0% rate — not tax advice; consult a CPA.
Schools (NCES district)
- District
- Fulton County
- NCES district ID
- 2102100
- Math proficiency
- 20% ▼ -11.00%
- Reading proficiency
- 33% ▼ -1.00%
- Median HH income
- $34,179
- Composite
- 21.74/100
- National rank
- #8263
- State rank
- #138 of 165 in KY
Livability — Hickman
- Score
- 64/100
- State rank
- #308
- US rank
- #14678
Category grades
Schools grade is shown separately in the Schools card above.
Census & demographics
- Census place
- Hickman, KY
- Population (ZIP)
- 3,129
Population outlook (Fulton County) Hauer SSP2
- Today (2025)
- 5,425 people
- By 2030
- 5,042 · -7.1%
- By 2040
- 4,456 · -17.9%
- By 2050
- 4,120 · -24.1%
- By 2075
- 4,003 · -26.2%
- By 2100
- 4,258 · -21.5%
Race, ethnicity, and origin ACS 2023
- Neighborhood character
- Predominantly White (76%)
- Race & ethnicity
- White 76% Black 23%
- Common ancestry
- Slovak 1% Iranian 1%
- Foreign-born
- 0%
- Languages at home
- 99% English-only · German/W. Germanic 1%
Political lean MEDSL · Fulton
- 2024 margin
- Solid R (+39.9) · D 29.6% · R 69.5%
- 2008→2024 swing
- -29.5pp toward R · 2008: -10.3pp · 2024: -39.9pp
- All cycles
- 2024: R+39.9 2020: R+33.5 2016: R+32.5 2012: R+16.2 2008: R+10.3
Not yet ingested
- Civics
- —
Market trends
- HPI YoY
- ▲ 3.49%
- Current HPI
- 124.8044
- Rent YoY
- —
- Metro
- —
- State GDP YoY
- ▲ 1.81%
- F500 in state
- 4
Industry mix (Fortune 500 HQ in KY)
| Industry | F500 HQs | Revenue |
|---|---|---|
| Healthcare | 1 | $118B |
|
||
| Food / Beverage | 1 | $7B |
|
||
Price history
+640.0% since first listed2 events — show timeline
- 2026-05-24 Listed $92,500 RRAR as distributed by MLS GRID
- 2004-09-21 Sold (Public Records) $12,500 Public Records
Property tax history
+5.0%/yrLatest (2025): $348 · +0.9% YoY. Source: county tax records.
Cash-flow waterfall
monthlySold comps — $/sqft
last 12 mo · ≤1 miLoading sold comps…