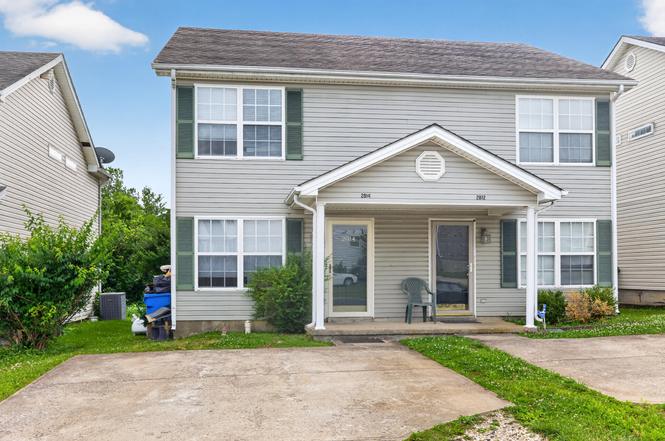
2814 Hanna Pl · Lexington-Fayette, KY
Flood risk 1/10 · Minimal
- FEMA flood zone
- X (unshaded)
- Chance of flooding over 30 yrs
- 0.0%
- Est. flood insurance / yr
- $507 – $1,088
Fire risk 1/10 · Minimal
- Est. fire insurance / yr
- $839 – $1,559
Heat risk 4/10 · Minor
- Hot days now (above 101°F)
- 7 days/yr
- Hot days in 30 yrs
- 19 days/yr
Wind risk 2/10 · Minimal
- Chance of severe wind over 30 yrs
- 2.0%
Air-quality risk 1/10 · Minimal
- Unhealthy air days now
- 0 days/yr
- Unhealthy air days in 30 yrs
- 0 days/yr
Risk factors via First Street. Map © Google.
Why this score? — see what drove the C- grade
The composite is a weighted blend of 9 inputs, each scored 0–100. Each bar is that input's sub-score; the figure is the points it added to the 100-point composite (weight × sub-score).
- Cash flow +19.3/30.0
- ARV discount +14.0/15.0
- DSCR +6.1/10.0
- 1% rule +3.9/10.0
- Schools +3.4/10.0
- Rent growth +3.1/5.0
- Livability +2.5/5.0
- Condition / age +2.5/5.0
- Appreciation +0.0/10.0
$175,000
🖨 Deal sheet (PDF) 📄 Offer letter ✓ Due diligence
Listing remarks MLS
Great townhome with spacious rooms. First floor boasts a large living room with laminate floor and double window, an eat-in kitchen, large utility and half bath. The second floor features 2 oversized bedrooms and 2 baths. Extras include plush carpet, neutral paint, large closets, patio, landscaped and close to UK. This is a great place to call home or invest and rent to UK students. Call to take a look at all this home has to offer.
Key facts
- Green space
- Eat in kitchen
- Spacious patio
Tags
Property features AI
Exterior
- Parking: Off-street parking
- Utilities: Public water; Public sewer
- Home design: Two levels
- Construction: Brick veneer and vinyl siding
- Exterior features: Landscaped lot; Slab foundation; Dimensional style shingle roof
Interior
- Kitchen: Disposal; Refrigerator; Range
- Bedrooms: 6 total rooms (bedroom count not specified)
- Flooring: Laminate
- Bathrooms: 2 full bathrooms; 1 half bathroom
- Heating & cooling: Electric heating; Heat pump; Electric cooling; Heat pump cooling
- Interior features: Eat-in kitchen; Walk-in closet(s); Ceiling fan(s)
- Laundry & utility: Washer hookup; Electric dryer hookup
Neighborhood map
What this means for you Summary
Snapshot
- This is a 2-bed/2.5-bath townhouse listed at $175k.
Deal economics
- At list price, monthly cash flow is $193 ($2k/yr) — positive.
- The deal already cash-flows at list — no discount required.
- To meet the 1% rule (rent ≥ 1% of price), the offer needs to be $156k (10.6% below list).
- Recommended offer: $156k (10.6% below list) — sets the bar for 1% rule.
- Cap rate 7.6% vs local median 3.8% in Lexington-Fayette — top-decile yield for the area; either an underpriced asset or a hidden risk that comps aren't pricing in. Stress-test before assuming the spread holds.
Location & tenants
- Location reads: area grade C — affects rentability + tenant quality, not the cash-flow math above.
- Fayette County (urban): math 35% / reading 45% proficiency, ranked #27 of 165 in KY (top 16%) — families likely to look elsewhere, expect single-tenant / working-renter base with shorter leases.
- Zoned schools: Madeline M Breckinridge Elem School (math 27% / reading 37%, grade F, #348 of 676 statewide, top 55%, 509 students, 78% FRL); Edythe Jones Hayes Middle School (math 47% / reading 60%, grade C+, #13 of 217 statewide, top 6%, 1,081 students, 37% FRL); Henry Clay High School (math 43% / reading 49%, grade D-, #20 of 254 statewide, top 8%, 2,031 students, 47% FRL).
- Market conditions: Rents rising (+2.2%/yr); 280 active listings in the ZIP; 40 comparable units currently listed for rent nearby; rentals at typical pace (median 25d on market — plan ~3-4 weeks tenant-placement turnaround); solid renter incomes; 1,036 units permitted in Fayette County in 2024 (542 in 5+ unit buildings).
Forward outlook
- Local home prices are declining (-3.0%/yr); year-one equity from $1k of loan paydown is wiped out by about $5k of value loss. Plan a longer hold.
- Fayette County population projected at +35% by 2050 — long-run rental-demand tailwind backs the buy-and-hold thesis.
Negotiation context
- Only 6 days on market — expect competitive offers; lowballing is unlikely to land.
- 11 sale attempts since 26y ago with the ask held roughly flat each time — persistent listings suggest the price (not the market) is what's stuck; bring a comps-based counter.
- Current owner paid $61k; list at $175k implies a 187% gain — meaningful room to come down on a strong offer.
Questions for the listing agent
- Is there a deadline driving the sale (1031 exchange, divorce, estate, relocation)? That informs how much negotiation room exists.
- What's the average days-on-market for RENTAL listings here right now (not sales)? A rising rental-DOM trend means longer vacancies and softer asking-rent achievability than the comps imply.
- What's the recent tenant-quality profile in this submarket — average credit score on applications, eviction rate, late-payment / NSF rate, and stable-employment percentage? A property-management company in the area should have these aggregated.
- How much new for-sale + rental construction is in the pipeline within 1–3 miles? Heavy new supply typically softens prices + rents 12–24 months out; constrained supply supports both.
Investment metrics
- 1% rule
- 0.89% ✗
- Cap rate
- 7.61%
- Cash-on-cash
- 4.72%
- DSCR
- 1.21
- GRM
- 9.3
CMA / ARV
- ARV (on-the-fly)
- $204,544
- Comps found
- 12
Show comp detail 12 sales within ~0.75 mi
| Address | Dist | Beds/Ba | Sqft | Sold | Price | $/sf | Match |
|---|---|---|---|---|---|---|---|
| 2804 Hanna Pl | 0.02mi | 2/2.5 | 1,088 (0%) | 2mo | $150,000 | $138 | 98 |
| 3042 Bonanza Dr | 0.26mi | 2/2.0 | 1,100 (+1%) | 1mo | $190,000 | $173 | 83 |
| 2925 Rio Dosa Dr | 0.28mi | 2/2.0 | 1,071 (-2%) | 7mo | $203,000 | $190 | 77 |
| 2931 Rio Dosa Dr | 0.29mi | 2/2.0 | 1,125 (+3%) | 3mo | $228,500 | $203 | 76 |
| 943 Mcclanahan Ln Ln | 0.16mi | 2/2.0 | 1,156 (+6%) | 11mo | $225,000 | $195 | 71 |
| 307 Santa Fe Ct | 0.33mi | 2/2.0 | 1,140 (+5%) | 5mo | $225,000 | $197 | 70 |
| 277 Osage Ct | 0.42mi | 3/1.5 (+1) | 1,080 (-1%) | 2mo | $115,000 | $106 | 69 |
| 292 Osage Ct | 0.41mi | 3/1.5 (+1) | 1,080 (-1%) | 5mo | $149,900 | $139 | 67 |
| 209 Old Todds Rd #2109 | 0.32mi | 2/1.5 | 1,008 (-7%) | 4mo | $197,500 | $196 | 65 |
| 2414 Lake Park Rd #2204 | 0.73mi | 2/2.0 | 1,157 (+6%) | 8mo | $195,000 | $169 | 46 |
| 2414 Lake Park Rd #2105 | 0.74mi | 2/2.0 | 1,157 (+6%) | 10mo | $214,000 | $185 | 45 |
| 2414 Lake Park Rd #1204 | 0.74mi | 2/2.0 | 1,157 (+6%) | 10mo | $217,000 | $188 | 45 |
Match score weights: distance 35% · size 25% · config 20% · recency 20%. Top-matched comps best support the ARV.
Projected returns pro-forma
-3.0% appreciation · 2.22% rent growth · sell at horizon
- IRR
- -9.8%
- Equity multiple
- 0.65×
- Total profit
- $-17,388
- Equity at exit
- $26,093
- IRR
- -1.4%
- Equity multiple
- 0.91×
- Total profit
- $-4,587
- Equity at exit
- $15,131
Cash invested: $49,000 (down + closing). Projections, not guarantees.
Landlord ↔ Tenant lean methodology
- Overall (STATE)
- 83 Strongly Landlord-Friendly
- State Kentucky
- 83 Strongly Landlord-Friendly · R+16
- County
- — inherits STATE
- City
- — inherits STATE
ZIP-level market 40509
- Home prices YoY
- -20.6%
- Rents YoY
- 2.2%
- Active inventory
- 280
- Price-to-rent
- 9.3×
Monthly cashflow live
- Estimated rent
- $1,564 high interval (Pro) →
- Mortgage (P&I)
- −$918
- Tax from tax record
- −$52 /mo · $628/yr
- Insurance
- −$73
- HOA
- −$0
- Vacancy / Maint / Mgmt
- −$328
- Net cashflow
- $193
Break-even live
Sensitivity live
| Price | -10% $292 | -5% $242 | +0% $193 | +5% $143 | +10% $94 |
|---|---|---|---|---|---|
| Rent | -10% $69 | -5% $131 | +0% $193 | +5% $254 | +10% $316 |
| Rate | -1.0pp $281 | -0.5pp $237 | base $193 | +0.5pp $147 | +1.0pp $101 |
UW: 25.0% down · 7.5% · 30yr · 1.5% tax · 5.0% vac · 8.0% maint · 8.0% mgmt
Financing live
Cash to close
- Down payment
- $43,750
- Closing costs
- $5,250
- Reserves months
- —
- Total cash needed
- —
Loan-product check · same deal, 3 products live
Conventional
25% down · 7.5% · 30yr
- Down + closing
- —
- Monthly P&I
- —
- Monthly cashflow
- —
- DSCR
- —
- Eligible?
- —
Personal DTI + credit; lowest rate.
DSCR
20% down · 8.5% · 30yr
- Down + closing
- —
- Monthly P&I
- —
- Monthly cashflow
- —
- DSCR
- —
- Eligible?
- —
No personal income docs; deal must DSCR.
Hard money
10% down · 12.0% · 12mo
- Down + closing
- —
- Monthly P&I
- —
- Monthly cashflow
- —
- DSCR
- —
- Eligible?
- —
Short-term bridge; refi at stabilization.
Rent comps 40 comps
| Address | Beds | Baths | Sqft | Rent | $/sqft | DOM | Units | Dist |
|---|---|---|---|---|---|---|---|---|
| 2824 Ryan Cir #3 Lexington, KY | 1.0 | 1.0 | 982 | $815 | $0.83 | 25d | 1 | 0.07mi |
| 175 N Mount Tabor Rd Lexington, KY | 1.0–2.0 | 1.0–2.0 | 847 | $1,362 | $1.61 | 15d | 9 | 0.08mi |
| 200 Alsab Ct Lexington, KY | 2.0–3.0 | 1.5 | 940 | $1,095 | $1.16 | 25d | 10 | 0.31mi |
| 179 Hedgewood Ct Unit 1 Lexington, KY | 3.0 | 1.5 | 1080 | $1,375 | $1.27 | 25d | 1 | 0.31mi |
| 2716 Chelsea Woods Ct Lexington, KY | 2.0 | 1.0 | 861 | $1,400 | $1.63 | 15d | 1 | 0.34mi |
| 2720 Chelsea Woods Ct Lexington, KY | 3.0 | 2.0 | 1018 | $1,595 | $1.57 | 25d | 1 | 0.34mi |
| 262 Osage Ct Unit 1 Lexington, KY | 3.0 | 1.5 | 1080 | $1,475 | $1.37 | 25d | 1 | 0.36mi |
| 300 Quinton Ct Lexington, KY | 1.0–3.0 | 1.0–2.0 | 927 | $1,216 | $1.31 | 15d | 38 | 0.52mi |
| 2400 Woodhill Dr Lexington, KY | 3.0 | 1.0 | 1000 | $1,250 | $1.25 | 25d | 1 | 0.53mi |
| 151 S Locust Hill Dr Lexington, KY | 1.0–2.0 | 1.0–2.0 | 761 | $1,348 | $1.77 | 15d | 19 | 0.53mi |
| 2409 Timberhill Ct Unit 4 Lexington, KY | 2.0 | 1.5 | 990 | $1,150 | $1.16 | 25d | 1 | 0.65mi |
| 251 Chippendale Cir Lexington, KY | 1.0–2.0 | 1.0–2.0 | 842 | $1,450 | $1.72 | 15d | 12 | 0.72mi |
| 2334 Lake Park Rd Lexington, KY | 1.0–2.0 | 1.0–2.0 | 837 | $1,448 | $1.73 | 15d | 7 | 0.73mi |
| 649 Hugging Bear Dr Lexington, KY | 3.0 | 2.0 | 1253 | $1,750 | $1.40 | 23d | 1 | 0.76mi |
| 2414 Lake Park Rd Lexington, KY | 1.0–3.0 | 1.0–2.0 | 1123 | $1,650 | $1.47 | 23d | 3 | 0.77mi |
| 2414 Lake Park Rd Lexington, KY | 2.0–3.0 | 2.0 | 1352 | $1,495 | $1.11 | 15d | 2 | 0.77mi |
| 365 Darby Creek Rd Lexington, KY | 2.0 | 1.5 | 1200 | $1,299 | $1.08 | 25d | 1 | 0.90mi |
| 409 Darby Creek Rd Unit Z1 Lexington, KY | 2.0 | 1.5 | 1144 | $1,299 | $1.14 | 25d | 1 | 0.91mi |
| 175 N Locust Hill Dr Lexington, KY | 1.0–2.0 | 1.0–2.0 | 700 | $1,170 | $1.67 | 15d | 11 | 0.99mi |
| 2116 Saint Teresa Dr Lexington, KY | 3.0 | 1.0 | 999 | $1,900 | $1.90 | 25d | 1 | 1.02mi |
| 546 El Paseo Pl Lexington, KY | 2.0 | 1.5 | 1044 | $1,450 | $1.39 | 15d | 1 | 1.03mi |
| 2360 Liberty Rd Lexington, KY | 3.0 | 2.0 | 1415 | $1,895 | $1.34 | 15d | 1 | 1.04mi |
| 531 Laketower Dr Unit 304 Lexington, KY | 1.0 | 1.0 | 965 | $3,199 | $3.32 | 25d | 1 | 1.11mi |
| 531 Laketower Dr Unit 506 Lexington, KY | 2.0 | 2.0 | 1326 | $4,699 | $3.54 | 25d | 1 | 1.11mi |
| 531 Laketower Dr Unit 518 Lexington, KY | 2.0 | 2.0 | 1175 | $4,299 | $3.66 | 25d | 1 | 1.11mi |
| 531 Laketower Dr Unit 414 Lexington, KY | 2.0 | 2.0 | 1147 | $3,499 | $3.05 | 25d | 1 | 1.11mi |
| 531 Laketower Dr Unit 316 Lexington, KY | 2.0 | 2.0 | 1175 | $3,199 | $2.72 | 25d | 1 | 1.11mi |
| 531 Laketower Dr Unit 220 Lexington, KY | 1.0 | 1.0 | 965 | $2,999 | $3.11 | 25d | 1 | 1.11mi |
| 531 Laketower Dr Unit 303 Lexington, KY | 1.0 | 1.0 | 971 | $2,899 | $2.99 | 25d | 1 | 1.11mi |
| 531 Laketower Dr Unit 515 Lexington, KY | 1.0 | 1.0 | 805 | $2,599 | $3.23 | 25d | 1 | 1.11mi |
| 531 Laketower Dr Unit 418 Lexington, KY | 2.0 | 2.0 | 1175 | $3,799 | $3.23 | 25d | 1 | 1.11mi |
| 531 Laketower Dr Unit 308 Lexington, KY | 2.0 | 2.0 | 1326 | $3,699 | $2.79 | 25d | 1 | 1.11mi |
| 531 Laketower Dr Unit 522 Lexington, KY | 2.0 | 2.0 | 1367 | $5,699 | $4.17 | 25d | 1 | 1.11mi |
| 531 Laketower Dr Unit 314 Lexington, KY | 2.0 | 2.0 | 1147 | $2,999 | $2.61 | 15d | 1 | 1.11mi |
| 531 Laketower Dr Unit 502 Lexington, KY | 2.0 | 2.0 | 1457 | $5,499 | $3.77 | 25d | 1 | 1.11mi |
| 531 Laketower Dr Unit 519 Lexington, KY | 2.0 | 2.0 | 1441 | $4,599 | $3.19 | 25d | 1 | 1.11mi |
| 408 Bainbridge Ct Unit 408-9 Lexington, KY | 2.0 | 1.5 | 1000 | $1,295 | $1.29 | 25d | 1 | 1.16mi |
| 2653 Twinbrooke Ln Lexington, KY | 3.0 | 1.0 | 1400 | $1,600 | $1.14 | 25d | 1 | 1.20mi |
| 2041 Saint Michael Dr Unit 5 Lexington, KY | 2.0 | 1.0 | 900 | $1,250 | $1.39 | 25d | 1 | 1.21mi |
| 2240 Kenwood Dr Lexington, KY | 3.0 | 2.0 | 1264 | $1,795 | $1.42 | 15d | 1 | 1.21mi |
Listing history 5 events
-
2026-06-22days on market $175,000 Active 6 DOM
-
2026-06-18days on market $175,000 Active 3 DOM
-
2026-06-17days on market $175,000 Active 2 DOM
-
2026-06-15remarks 459-char remark
-
2026-06-15$175,000 Active 1 DOM
ⓘ Source: listings_history table (triggers on properties + properties_extension) + one-shot
backfill from property_details.listing_events for pre-trigger history.
Tax reassessment forecast KY · Resets to sale price
- Current annual tax
- $628 · $52/mo
- Projected year-2 tax
- $1,505 · $125/mo
- Expected delta
- +$877/yr (+$73/mo · 139.7%)
ⓘ Screening estimate from a state-policy table — verify with the county assessor before closing.
Climate risk First Street
- Flood 1/10 Low FEMA zone X (unshaded) · 0% chance over 30 yrs
- Wildfire 1/10 Low
- Heat 4/10 Moderate 7 d/yr ≥101°F today · 19 d/yr by 30 yrs out
- Wind 2/10 Low 2% chance of damaging wind over 30 yrs
- Air quality 1/10 Low 0 unhealthy d/yr today · 0 by 30 yrs out
Nearby sold comps map
Loading sold comps map…
Walkable amenities ~0.75 mi
Loading nearby amenities…
Taxation est. · year 1
- Rental income
- $18,768
- − Mortgage interest
- −$9,803
- − Property taxes
- −$628
- − Insurance
- −$875
- − Repairs & maintenance
- −$1,501
- − Management
- −$1,501
- − Depreciation
- −$5,091
- Taxable loss
- −$632
- Est. tax savings @ 24.0%
- +$152
- After-tax cash flow
- $2,463/yr
For passive investors: Depreciation is non-cash, so a rental often shows a tax loss while cash-flowing — sheltering income. Rental losses are passive: they offset passive income freely, and up to $25,000/yr can offset ordinary (W-2) income if you actively participate and your MAGI is under $100k (phasing out to $0 by $150k); unused losses carry forward. On sale, claimed depreciation is recaptured at up to 25%, and gains may owe capital-gains tax (a 1031 exchange can defer both). Figures are a year-1 estimate at your 24.0% rate — not tax advice; consult a CPA.
Schools (NCES district)
- District
- Fayette County
- NCES district ID
- 2101860
- Math proficiency
- 35% ▼ -16.00%
- Reading proficiency
- 45% ▼ -13.00%
- Median HH income
- $49,245
- Composite
- 34.38/100
- National rank
- #5211
- State rank
- #27 of 165 in KY
Livability — Lexington-Fayette
No livability data for this city. (Only ~50 U.S. cities are tracked.)
Census & demographics
- Census place
- Lexington-Fayette, KY
- County
- Fayette County · 317,143 people
- City population
- 321,882
- Metro
- Lexington-Fayette, KY
- Population (ZIP)
- 47,036
- Household income
- $94,804
- Rent vs Own
- Severe rent burden
- 1763.0
Population outlook (Fayette County) Hauer SSP2
- Today (2025)
- 363,454 people
- By 2030
- 388,270 · +6.8%
- By 2040
- 438,688 · +20.7%
- By 2050
- 490,667 · +35.0%
- By 2075
- 625,394 · +72.1%
- By 2100
- 721,354 · +98.5%
Race, ethnicity, and origin ACS 2023
- Neighborhood character
- Predominantly White (67%)
- Race & ethnicity
- White 67% Black 14% Two or more races 8% Asian 7% Hispanic / Latino 7%
- Hispanic origin (detail)
- Mexican 4%
- Common ancestry
- Italian 2% Slovak 2% Romanian 2%
- Foreign-born
- 12% · Canada, China
- Languages at home
- 84% English-only · Spanish 6% Other Indo-European 3% Other Asian/Pacific 2%
Political lean MEDSL · Fayette
- 2024 margin
- D (+18.1) · D 58.0% · R 39.9% · Other 2.1%
- 2008→2024 swing
- +13.3pp toward D · 2008: 4.8pp · 2024: 18.1pp
- All cycles
- 2024: D+18.1 2020: D+20.8 2016: D+9.5 2012: D+1.0 2008: D+4.8
Not yet ingested
- Civics
- —
Market trends
- HPI YoY
- ▼ -58.72%
- Current HPI
- 226.8663
- Rent YoY
- ▲ 2.22%
- Metro
- Lexington-Fayette, KY
- State GDP YoY
- ▲ 1.81%
- F500 in state
- 4
Industry mix (Fortune 500 HQ in KY)
| Industry | F500 HQs | Revenue |
|---|---|---|
| Healthcare | 1 | $118B |
|
||
| Food / Beverage | 1 | $7B |
|
||
Price history
+104.7% since first listed28 events — show timeline
- 2026-06-15 Listed $175,000 ImagineMLS
- 2015-06-04 Sold (Public Records) $61,000 Public Records
- 2015-05-29 Sold (MLS) $61,000 ImagineMLS
- 2015-05-01 Listing Removed — ImagineMLS
- 2015-03-26 Listed $64,500 ImagineMLS
- 2014-11-21 Sold (MLS) $52,000 ImagineMLS
- 2014-10-29 Listing Removed — ImagineMLS
- 2014-07-01 Listed $59,900 ImagineMLS
- 2013-12-31 Listing Removed — ImagineMLS
- 2013-10-30 Listed $52,900 ImagineMLS
- 2013-10-30 Listing Removed — ImagineMLS
- 2012-05-02 Listed $52,900 ImagineMLS
- 2011-09-08 Listing Removed — ImagineMLS
- 2011-03-09 Listed $87,000 ImagineMLS
- 2007-05-30 Sold (Public Records) $84,000 Public Records
- 2007-05-17 Sold (MLS) $84,000 ImagineMLS
- 2007-04-28 Listing Removed — ImagineMLS
- 2007-03-16 Listing Removed — ImagineMLS
- 2006-11-20 Listed $87,900 ImagineMLS
- 2006-09-18 Listed $92,500 ImagineMLS
- 2004-07-27 Sold (MLS) $86,900 ImagineMLS
- 2004-07-01 Listing Removed — ImagineMLS
- 2004-05-05 Listed $88,900 ImagineMLS
- 2003-12-29 Listing Removed — ImagineMLS
- 2003-06-29 Listed $92,000 ImagineMLS
- 2000-07-19 Sold (MLS) $84,000 ImagineMLS
- 2000-06-13 Listing Removed — ImagineMLS
- 2000-04-05 Listed $85,500 ImagineMLS
Property tax history
-15.6%/yrLatest (2015): $628 · -15.6% YoY. Source: county tax records.
Cash-flow waterfall
monthlySold comps — $/sqft
last 12 mo · ≤1 miLoading sold comps…