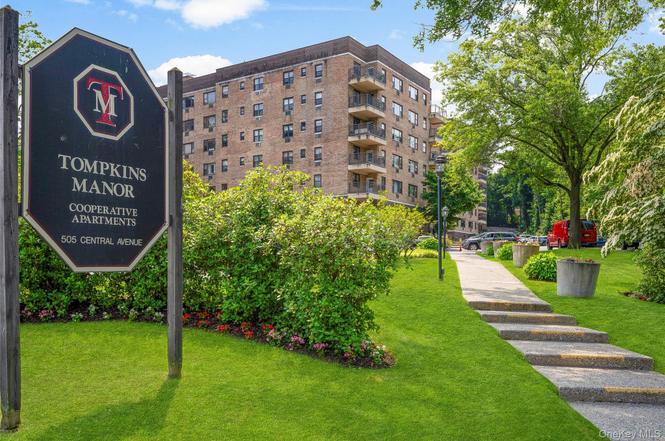
505 Central Ave #609 · White Plains, NY
Flood risk 1/10 · Minimal
- FEMA flood zone
- X (unshaded)
- Chance of flooding over 30 yrs
- 0.0%
- Est. flood insurance / yr
- $507 – $1,088
Fire risk 1/10 · Minimal
- Est. fire insurance / yr
- $691 – $1,283
Heat risk 6/10 · Moderate
- Hot days now (above 98°F)
- 7 days/yr
- Hot days in 30 yrs
- 15 days/yr
Wind risk 6/10 · Moderate
- Chance of severe wind over 30 yrs
- 27.0%
Air-quality risk 4/10 · Minor
- Unhealthy air days now
- 3 days/yr
- Unhealthy air days in 30 yrs
- 5 days/yr
Risk factors via First Street. Map © Google.
Why this score? — see what drove the B grade
The composite is a weighted blend of 9 inputs, each scored 0–100. Each bar is that input's sub-score; the figure is the points it added to the 100-point composite (weight × sub-score).
- Cash flow +30.0/30.0
- 1% rule +10.0/10.0
- DSCR +10.0/10.0
- ARV discount +7.5/15.0
- Schools +4.7/10.0
- Livability +3.6/5.0
- Rent growth +2.6/5.0
- Condition / age +2.5/5.0
- Appreciation +0.0/10.0
$115,000
🖨 Deal sheet 📄 Offer letter ✓ Due diligence
Listing remarks
Welcome to 505 Central Ave, Unit 609. Don't miss this top floor unit, both quiet and bright and beautifully updated with cherry hardwood flooring, exposed brick, oversized closets and includes its own assigned parking spot. The building is walking distance to shopping and a very convenient location to access all White Plains has to offer.
Key facts
- Exposed brick
- Oversized closets
- Top floor unit
Tags
Neighborhood map
What this means for you Summary
Snapshot
- This is a 1-bed/1.0-bath condo listed at $115k.
Deal economics
- At list price, monthly cash flow is $528 ($6k/yr) — positive.
- The deal already cash-flows at list — no discount required.
- Meets the 1% rule at list price ($3k rent vs $115k).
- Cap rate 11.8% vs local median 4.3% in White Plains — top-decile yield for the area; either an underpriced asset or a hidden risk that comps aren't pricing in. Stress-test before assuming the spread holds.
Location & tenants
- Location reads 71/100 on livability (#410 in NY) — a middle-class / working-renter tenant base. Strengths: commute A+, employment A+, crime A-; Watch: amenities F, cost of living F.
- White Plains City School District (urban): math 49% / reading 54% proficiency, ranked #313 of 590 in NY (top 53%) — acceptable for families but not a draw, mixed tenant base, ~2y average lease.
- Zoned schools: White Plains Middle School (math 36% / reading 53%, grade D, #348 of 729 statewide, top 50%, 1,517 students, 50% FRL); White Plains Senior High School (math 89% / reading 67%, grade A-, #577 of 1,100 statewide, top 52%, 2,220 students, 53% FRL).
- Market conditions: Rents flat; 54 active listings in the ZIP; 39 comparable units currently listed for rent nearby; rentals leasing fast (median 13d on market — plan ~1-2 weeks tenant-placement turnaround); high-income renter base; 954 units permitted in Westchester County in 2024 (649 in 5+ unit buildings).
- This rent runs 31% of the median local income ($112k/yr) — at the standard rent-burdened threshold; future hikes will face affordability resistance.
Forward outlook
- Local home prices are declining (-3.0%/yr); year-one equity from $795 of loan paydown is wiped out by about $3k of value loss. Plan a longer hold.
- Westchester County population projected at +10% by 2050 — modest demand growth; plan on rents tracking national, not racing it.
- At projected returns (-3.0% appreciation + 0.4% rent growth), your $32k cash investment doubles in ~10 years — after that, you're playing with house money.
Negotiation context
- Only 7 days on market — expect competitive offers; lowballing is unlikely to land.
- 8 sale attempts since 21y ago with the ask held roughly flat each time — persistent listings suggest the price (not the market) is what's stuck; bring a comps-based counter.
- Current owner paid $85k; 35% above their basis — modest negotiation headroom, anchor on the comps not their cost.
Risks & watch-outs
- Watch-outs: HOA is 34% of rent.
- Climate carrying-cost: major wind risk, 27% chance of damaging wind over 30y; extreme-heat days projected 7→15/yr by 2055 (HVAC capex compounding) — expect insurance premiums to compound above CPI over the hold.
Questions for the listing agent
- Built in 1968 — when were the roof, HVAC, electrical panel, plumbing, and water heater last replaced?
- What does the HOA fee cover, when was the last increase, and are there any pending special assessments or reserve-fund shortfalls?
- Any open or pending special assessments — roof, HVAC, plumbing, elevator, façade? What's the per-unit balance and payoff schedule, and is the seller paying it off at close or rolling it to the buyer?
- Is there a deadline driving the sale (1031 exchange, divorce, estate, relocation)? That informs how much negotiation room exists.
- What's the average days-on-market for RENTAL listings here right now (not sales)? A rising rental-DOM trend means longer vacancies and softer asking-rent achievability than the comps imply.
- What's the recent tenant-quality profile in this submarket — average credit score on applications, eviction rate, late-payment / NSF rate, and stable-employment percentage? A property-management company in the area should have these aggregated.
- How much new apartment / multifamily construction is in the pipeline within 1–3 miles? Heavy new supply (>2% of stock underway) typically softens rents 12–24 months out; light construction supports rent growth.
Investment metrics
- 1% rule
- 2.54% ✓
- Cap rate
- 11.80%
- Cash-on-cash
- 19.68%
- DSCR
- 1.88
- GRM
- 3.3
CMA / ARV
No comps found within radius.
Projected returns pro-forma
-3.0% appreciation · 0.41% rent growth · sell at horizon
- IRR
- 6.9%
- Equity multiple
- 1.26×
- Total profit
- $8,219
- Equity at exit
- $17,147
- IRR
- 11.9%
- Equity multiple
- 1.75×
- Total profit
- $24,168
- Equity at exit
- $9,943
Cash invested: $32,200 (down + closing). Projections, not guarantees.
Landlord ↔ Tenant lean methodology
- Overall (STATE)
- 15 Strongly Tenant-Friendly
- State New York
- 15 Strongly Tenant-Friendly · D+10
- County
- — inherits STATE
- City
- — inherits STATE
ZIP-level market 10606
- Rents YoY
- 0.4%
- Active inventory
- 54
- Price-to-rent
- 3.3×
Monthly cashflow live
- Estimated rent
- $2,924 high interval (Pro) →
- Mortgage (P&I)
- −$603
- Tax est. 1.5%
- −$144 /mo · $1,725/yr
- Insurance
- −$48
- HOA est. from 2 same-building comps
- −$987
- Vacancy / Maint / Mgmt
- −$614
- Net cashflow
- $528
Break-even live
UW: 25.0% down · 7.5% · 30yr · 1.5% tax · 5.0% vac · 8.0% maint · 8.0% mgmt
Financing live
Cash to close
- Down payment
- $28,750
- Closing costs
- $3,450
- Reserves months
- —
- Total cash needed
- —
Loan-product check · same deal, 3 products live
Conventional
25% down · 7.5% · 30yr
- Down + closing
- —
- Monthly P&I
- —
- Monthly cashflow
- —
- DSCR
- —
- Eligible?
- —
Personal DTI + credit; lowest rate.
DSCR
20% down · 8.5% · 30yr
- Down + closing
- —
- Monthly P&I
- —
- Monthly cashflow
- —
- DSCR
- —
- Eligible?
- —
No personal income docs; deal must DSCR.
Hard money
10% down · 12.0% · 12mo
- Down + closing
- —
- Monthly P&I
- —
- Monthly cashflow
- —
- DSCR
- —
- Eligible?
- —
Short-term bridge; refi at stabilization.
Rent comps 39 comps
| Address | Beds | Baths | Sqft | Rent | $/sqft | DOM | Units | Dist |
|---|---|---|---|---|---|---|---|---|
| 55 Fieldstone Dr Unit 69 Hartsdale, NY | 1.0 | 1.0 | 800 | $2,100 | $2.62 | 11d | 1 | 0.20mi |
| 400 High Point Dr Unit 206 Hartsdale, NY | 1.0 | 1.0 | 987 | $3,300 | $3.34 | 43d | 1 | 0.37mi |
| 55 McKinley Ave Unit D2-3 White Plains, NY | 1.0 | 1.0 | 809 | $2,400 | $2.97 | 43d | 1 | 0.41mi |
| 55 Bank St White Plains, NY | 2.0 | 1.0–2.0 | 861 | $3,922 | $4.56 | 1d | 23 | 0.75mi |
| 57 Bank St Unit 1040036P White Plains, NY | 1.0 | 1.0 | 592 | $7,170 | $12.11 | 19d | 1 | 0.75mi |
| 57 Bank St Unit 1040035P White Plains, NY | 2.0 | 1.0–2.0 | 726 | $7,940 | $10.94 | 3d | 3 | 0.75mi |
| 15 Bank St White Plains, NY | 1.0–2.0 | 1.0–2.0 | 934 | $2,715 | $2.91 | 1d | 20 | 0.79mi |
| 1 Martine Ave White Plains, NY | 1.0–2.0 | 1.0–2.0 | 827 | $2,850 | $3.44 | 2d | 12 | 0.83mi |
| 4 Martine Ave White Plains, NY | 1.0 | 1.0–1.5 | 773 | $2,900 | $3.75 | 43d | 2 | 0.87mi |
| 4 Martine Ave White Plains, NY | 1.0 | 1.0–1.5 | 773 | $3,025 | $3.91 | 19d | 2 | 0.87mi |
| 4 Martine Ave White Plains, NY | 1.0 | 1.0 | 707 | $2,750 | $3.89 | 2d | 1 | 0.87mi |
| 4 Martine Ave White Plains, NY | 1.0 | 1.0–1.5 | 773 | $2,850 | $3.69 | 13d | 2 | 0.87mi |
| 34 S Lexington Ave White Plains, NY | 1.0–2.0 | 1.0–2.0 | 871 | $2,695 | $3.09 | 5d | 6 | 0.88mi |
| 25 N Lexington Ave White Plains, NY | 3.0 | 1.0–2.0 | 988 | $4,320 | $4.37 | 1d | 28 | 0.88mi |
| 26 Hillside Ter Unit F White Plains, NY | 1.0 | 1.0 | 782 | $2,700 | $3.45 | 43d | 1 | 0.99mi |
| 140 E Hartsdale Ave Hartsdale, NY | 2.0 | 1.0 | 875 | $2,895 | $3.31 | 22d | 1 | 1.04mi |
| 5 Cottage Pl White Plains, NY | — | 1.0 | 577 | $2,686 | $4.66 | 13d | 1 | 1.13mi |
| 1 Renaissance Sq Unit 7B White Plains, NY | 1.0 | 1.5 | 1048 | $5,500 | $5.25 | 43d | 1 | 1.17mi |
| 42 Barker Ave Unit 4C White Plains, NY | 1.0 | 1.0 | 800 | $2,300 | $2.88 | 43d | 1 | 1.28mi |
| 131 Mamaroneck Ave White Plains, NY | 3.0 | 1.0–2.0 | 974 | $4,038 | $4.15 | 1d | 19 | 1.28mi |
| 250 Mamaroneck Ave White Plains, NY | 1.0–3.0 | 1.0–2.5 | 1298 | $3,389 | $2.61 | 1d | 126 | 1.28mi |
| 210 Martine Ave Unit 5G White Plains, NY | — | 1.0 | 550 | $2,150 | $3.91 | 19d | 1 | 1.29mi |
| 37 Lake St White Plains, NY | 1.0–2.0 | 1.0 | 685 | $2,580 | $3.76 | 43d | 1 | 1.31mi |
| 10 City Pl Unit 2D White Plains, NY | 1.0 | 1.5 | 1069 | $3,895 | $3.64 | 15d | 1 | 1.32mi |
| 250 S Central Ave Apt 3I Hartsdale, NY | 2.0 | 1.0 | 1000 | $4,350 | $4.35 | 43d | 1 | 1.35mi |
| 440 Hamilton Ave White Plains, NY | 2.0 | 1.0–2.0 | 880 | $4,078 | $4.63 | 1d | 31 | 1.36mi |
| 10 Lyon Pl White Plains, NY | 2.0 | 1.0–2.0 | 870 | $3,405 | $3.91 | 43d | 17 | 1.37mi |
| 1 Lyon Pl Unit 509 White Plains, NY | 1.0 | 1.0 | 668 | $2,980 | $4.46 | 3d | 1 | 1.38mi |
| 1 Lyon Pl Unit 907 White Plains, NY | 2.0 | 2.0 | 1120 | $4,555 | $4.07 | 3d | 1 | 1.38mi |
| 250 Central Park Ave Unit 5I Hartsdale, NY | 2.0 | 1.0 | 1000 | $4,550 | $4.55 | 17d | 1 | 1.38mi |
| 1 S Broadway Apt 1L White Plains, NY | 2.0 | 1.0 | 1000 | $2,950 | $2.95 | 43d | 1 | 1.38mi |
| 250 S Central Ave Hartsdale, NY | 1.0–2.0 | 1.0–2.0 | 1084 | $3,000 | $2.77 | 1d | 1 | 1.38mi |
| 51 S Broadway White Plains, NY | 1.0 | 1.0 | 752 | $3,342 | $4.44 | 3d | 2 | 1.38mi |
| 7-11 S Broadway White Plains, NY | 1.0 | 1.0 | 746 | $3,295 | $4.42 | 13d | 1 | 1.39mi |
| 1 S Broadway Unit 4M White Plains, NY | — | 1.0 | 600 | $2,207 | $3.68 | 43d | 1 | 1.40mi |
| 1 DeKalb Ave White Plains, NY | 1.0 | 1.0 | 749 | $3,390 | $4.53 | 43d | 1 | 1.42mi |
| 7 Lake St Unit 8k White Plains, NY | 2.0 | 1.0 | 975 | $3,150 | $3.23 | 44d | 1 | 1.46mi |
| 1 Franklin Ave Unit 4DD White Plains, NY | — | 1.0 | 550 | $1,950 | $3.55 | 4d | 1 | 1.48mi |
| 100 Hale Ave White Plains, NY | 2.0 | 1.0–2.0 | 908 | $3,993 | $4.40 | 1d | 11 | 1.50mi |
HOA detail condo
- Monthly dues
- $0 · $0/yr
- Likely covers
- parking
- Assessments
- None detected in remarks — confirm with the listing agent.
Listing history 27 events
-
2026-04-07status Pending
-
2026-02-17$115,000 Active
-
2026-01-01historical
-
2025-12-02status Active
-
2025-12-01historical
-
2025-09-11price $115,000
-
2025-07-30price $129,000
-
2025-06-13$135,000 Active
-
2025-03-26historical
-
2024-10-24price $125,000
-
2024-07-02price $132,000
-
2024-06-29price $140,000
-
2024-05-13price $144,000
-
2024-04-04$145,000 Active
-
2014-03-15price $85,000
-
2012-05-10soldstatus $85,000 Sold
-
2011-12-22historical
-
2011-11-22historical Pending
-
2011-11-22historical
-
2011-11-21price $89,000
-
2011-03-22$89,000 Active
-
2009-04-29historical
-
2009-01-22
-
2007-02-20historical
-
2006-02-20
-
2006-02-09historical
-
2005-11-12
ⓘ Source: listings_history table (triggers on properties + properties_extension) + one-shot
backfill from property_details.listing_events for pre-trigger history.
Climate risk First Street
- Flood 1/10 Low FEMA zone X (unshaded) · 0% chance over 30 yrs
- Wildfire 1/10 Low
- Heat 6/10 Major 7 d/yr ≥98°F today · 15 d/yr by 30 yrs out
- Wind 6/10 Major 27% chance of damaging wind over 30 yrs
- Air quality 4/10 Moderate 3 unhealthy d/yr today · 5 by 30 yrs out
Nearby sold comps map
Loading sold comps map…
Walkable amenities ~0.75 mi
Loading nearby amenities…
Taxation est. · year 1
- Rental income
- $35,085
- − Mortgage interest
- −$6,442
- − Property taxes
- −$1,725
- − Insurance
- −$575
- − Repairs & maintenance
- −$2,807
- − Management
- −$2,807
- − HOA
- −$11,844
- − Depreciation
- −$3,345
- Taxable income
- $5,540
- Est. tax owed @ 24.0%
- −$1,330
- After-tax cash flow
- $5,007/yr
For passive investors: Depreciation is non-cash, so a rental often shows a tax loss while cash-flowing — sheltering income. Rental losses are passive: they offset passive income freely, and up to $25,000/yr can offset ordinary (W-2) income if you actively participate and your MAGI is under $100k (phasing out to $0 by $150k); unused losses carry forward. On sale, claimed depreciation is recaptured at up to 25%, and gains may owe capital-gains tax (a 1031 exchange can defer both). Figures are a year-1 estimate at your 24.0% rate — not tax advice; consult a CPA.
Schools (NCES district)
- District
- White Plains City School District
- NCES district ID
- 3631260
- Math proficiency
- 49% ▼ -6.00%
- Reading proficiency
- 54% ▲ 2.00%
- Median HH income
- $78,366
- Composite
- 46.72/100
- National rank
- #2397
- State rank
- #313 of 590 in NY
Livability — White Plains
- Score
- 71/100
- State rank
- #410
- US rank
- #6801
Category grades
Schools grade is shown separately in the Schools card above.
Census & demographics
- Census place
- White Plains, NY
- County
- Westchester County · 709,332 people
- City population
- 61,281
- Metro
- New York-Newark-Jersey City, NY-NJ-PA
- Population (ZIP)
- 17,341
- Household income
- $112,270
- Rent vs Own
- Severe rent burden
- 1191.0
Population outlook (Westchester County) Hauer SSP2
- Today (2025)
- 1,028,035 people
- By 2030
- 1,051,636 · +2.3%
- By 2040
- 1,098,520 · +6.9%
- By 2050
- 1,136,044 · +10.5%
- By 2075
- 1,196,925 · +16.4%
- By 2100
- 1,175,147 · +14.3%
Race, ethnicity, and origin ACS 2023
- Neighborhood character
- Diverse neighborhood (Simpson 0.69)
- Race & ethnicity
- Hispanic / Latino 44% White 30% Black 14% Two or more races 14% Asian 9%
- Hispanic origin (detail)
- Mexican 16% Puerto Rican 4% Dominican 3%
- Common ancestry
- Romanian 1% Lithuanian 1% Hispanic 1%
- Foreign-born
- 38% · Canada, Jamaica, China
- Languages at home
- 49% English-only · Spanish 37% Other Indo-European 4% Chinese 2%
Political lean MEDSL · Westchester
- 2024 margin
- Strong D (+26.3) · D 63.1% · R 36.9%
- 2008→2024 swing
- -1.3pp toward R · 2008: 27.6pp · 2024: 26.3pp
- All cycles
- 2024: D+26.3 2020: D+36.3 2016: D+32.8 2012: D+22.2 2008: D+27.6
Not yet ingested
- Civics
- —
Market trends
- HPI YoY
- ▼ -474.05%
- Current HPI
- 247.9311
- Rent YoY
- ▲ 0.41%
- Metro
- New York-Newark-Jersey City, NY-NJ-PA
- State GDP YoY
- ▲ 2.60%
- F500 in state
- 92
Industry mix (Fortune 500 HQ in NY)
| Industry | F500 HQs | Revenue |
|---|---|---|
| Financial Services | 10 | $950B |
|
||
| Consumer Goods | 9 | $162B |
|
||
| Insurance | 4 | $225B |
|
||
| Telecommunications | 2 | $144B |
|
||
| Pharmaceuticals | 2 | $112B |
|
||
| Media / Entertainment | 2 | $69B |
|
||
Price history
+29.2% since first listed27 events — show timeline
- 2026-04-07 Pending — OneKey® MLS as Distributed by MLS Grid
- 2026-02-17 Listed $115,000 OneKey® MLS as Distributed by MLS Grid
- 2026-01-01 Listing Removed — OneKey® MLS as Distributed by MLS Grid
- 2025-12-02 Relisted — OneKey® MLS as Distributed by MLS Grid
- 2025-12-01 Listing Removed — OneKey® MLS as Distributed by MLS Grid
- 2025-09-11 Price Changed $115,000 OneKey® MLS as Distributed by MLS Grid
- 2025-07-30 Price Changed $129,000 OneKey® MLS as Distributed by MLS Grid
- 2025-06-13 Listed $135,000 OneKey® MLS as Distributed by MLS Grid
- 2025-03-26 Listing Removed — OneKey® MLS as Distributed by MLS Grid
- 2024-10-24 Price Changed $125,000 OneKey® MLS as Distributed by MLS Grid
- 2024-07-02 Price Changed $132,000 OneKey® MLS as Distributed by MLS Grid
- 2024-06-29 Price Changed $140,000 OneKey® MLS as Distributed by MLS Grid
- 2024-05-13 Price Changed $144,000 OneKey® MLS as Distributed by MLS Grid
- 2024-04-04 Listed $145,000 OneKey® MLS as Distributed by MLS Grid
- 2014-03-15 Price Changed $85,000 HGMLS
- 2012-05-10 Sold (MLS) $85,000 HGMLS
- 2011-12-22 Delisted — HGMLS
- 2011-11-22 Contingent — HGMLS
- 2011-11-22 Delisted — HGMLS
- 2011-11-21 Price Changed $89,000 HGMLS
- 2011-03-22 Listed $89,000 HGMLS
- 2009-04-29 Delisted — HGMLS
- 2009-01-22 Listed — HGMLS
- 2007-02-20 Delisted — HGMLS
- 2006-02-20 Listed — HGMLS
- 2006-02-09 Delisted — HGMLS
- 2005-11-12 Listed — HGMLS
Cash-flow waterfall
monthlySold comps — $/sqft
last 12 mo · ≤1 miLoading sold comps…