 Multi-family
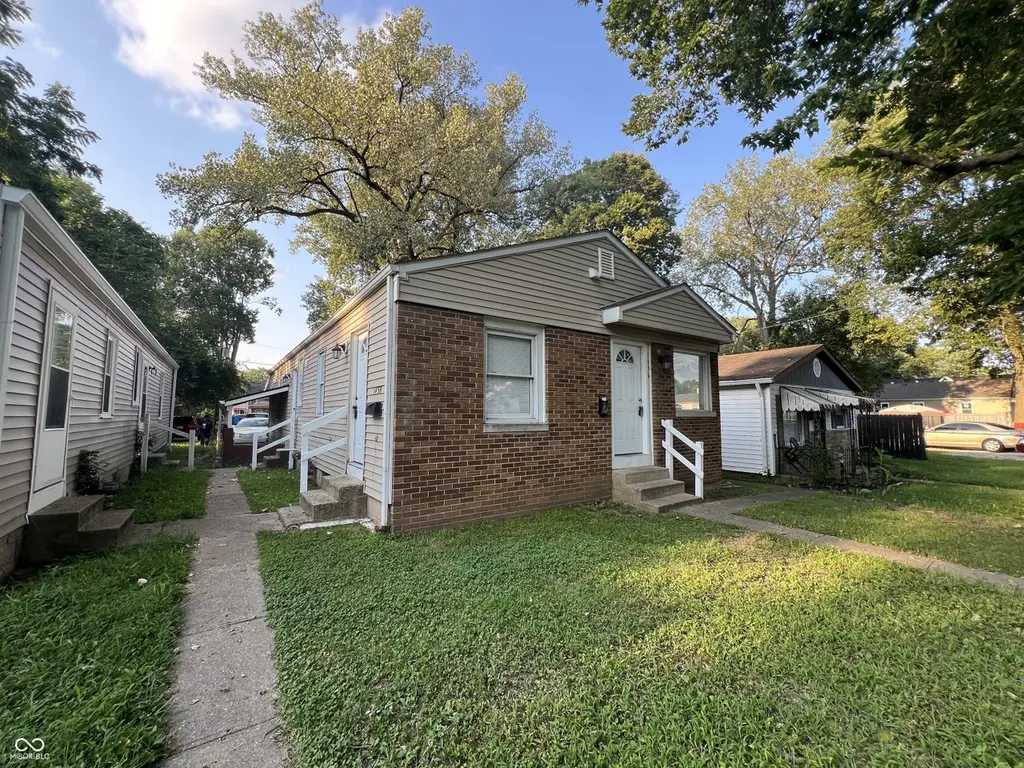
1456 W 32nd St · Indianapolis city (balance), IN
Flood risk 1/10 · Minimal
- FEMA flood zone
- X (unshaded)
- Chance of flooding over 30 yrs
- 0.0%
- Est. flood insurance / yr
- $473 – $860
Fire risk 1/10 · Minimal
- Est. fire insurance / yr
- $717 – $1,331
Heat risk 4/10 · Minor
- Hot days now (above 102°F)
- 7 days/yr
- Hot days in 30 yrs
- 19 days/yr
Wind risk 2/10 · Minimal
- Chance of severe wind over 30 yrs
- 1.0%
Air-quality risk 4/10 · Minor
- Unhealthy air days now
- 5 days/yr
- Unhealthy air days in 30 yrs
- 7 days/yr
Risk factors via First Street. Map © Google.
Why this score? — see what drove the F grade
The composite is a weighted blend of 9 inputs, each scored 0–100. Each bar is that input's sub-score; the figure is the points it added to the 100-point composite (weight × sub-score).
- ARV discount +7.5/15.0
- Rent growth +4.1/5.0
- Livability +2.5/5.0
- Condition / age +2.5/5.0
- Cash flow +2.0/30.0
- Schools +1.4/10.0
- 1% rule +0.0/10.0
- DSCR +0.0/10.0
- Appreciation +0.0/10.0
$264,500
🖨 Deal sheet 📄 Offer letter ✓ Due diligence
Multi-family units
County records classify this as Multi-Family (2-4 Unit). Listing-text estimate: 1 unit. estimate disagrees with records
Listing remarks MLS
Solid quad rental opportunity in a growing Indianapolis neighborhood, part of a 4-property portfolio. Each unit offers comfortable living space with separate entrances, providing privacy and strong rental appeal. Currently producing $3,300/month with stabilized rent of $4,600/month at full occupancy. An excellent opportunity for investors or owner-occupants looking to house hack or add a strong cash-flowing asset to their portfolio.
Key facts
- 5,097 sq ft lot
- Built 1910
- Listed 120 days
Neighborhood map
What this means for you Summary
Snapshot
- This is a 1-bed/4.0-bath multifamily listed at $264k.
Deal economics
- At list price, monthly cash flow is $-970 ($-12k/yr) — negative.
- To cash-flow at today's rent, offer at most $93k (64.8% below list).
- To meet the 1% rule (rent ≥ 1% of price), the offer needs to be $94k (64.5% below list).
- Recommended offer: $93k (64.8% below list) — sets the bar for cash-flow.
- Cap rate 1.9% vs local median 4.4% in Indianapolis city (balance) — below-typical yield; the buyer is paying a premium for something (appreciation thesis, condition, location) that the cap rate doesn't capture.
Location & tenants
- Location reads: area grade F — affects rentability + tenant quality, not the cash-flow math above.
- Indianapolis Public Schools (urban): math 14% / reading 20% proficiency, ranked #286 of 301 in IN (top 95%) — low school quality limits family demand, transient renter base, plan for 1-2y turnover; 77% free/reduced lunch — lower-income household profile, screen leases tightly.
- Market conditions: Rents rising fast (+6.4%/yr); 279 active listings in the ZIP; 18 comparable units currently listed for rent nearby; rentals at typical pace (median 24d on market — plan ~3-4 weeks tenant-placement turnaround); 44% of comp listings sitting > 30 days — soft ceiling on asking rent; 1,906 units permitted in Marion County in 2024 (621 in 5+ unit buildings).
Forward outlook
- Local home prices are declining (-3.0%/yr); year-one equity from $2k of loan paydown is wiped out by about $8k of value loss. Plan a longer hold.
- Marion County population projected at +18% by 2050 — long-run rental-demand tailwind backs the buy-and-hold thesis.
Negotiation context
- It's been on market 120 days — a 9% lower offer ($241k) is reasonable based on typical stale-listing flexibility.
- 4 sale attempts since 21y ago; this cycle's ask has dropped $16k (6%) from the opening price — seller is motivated, your offer sets the floor, not the list.
Risks & watch-outs
- Watch-outs: built in 1910 — expect roof / HVAC / electrical / plumbing capex.
Questions for the listing agent
- What do current leases actually rent for vs. the listed asking? Can we see a recent rent roll and the last 12 months of T-12 income?
- It's been on market 120 days. Have you received any prior offers? Is the seller open to a 65% concession, seller financing, or rate buy-down credit?
- Built in 1910 — when were the roof, HVAC, electrical panel, plumbing, and water heater last replaced?
- Why hasn't it sold? Are there any deal-killer items the seller is aware of (foundation, flood, title, zoning, code violations)?
- Is there a deadline driving the sale (1031 exchange, divorce, estate, relocation)? That informs how much negotiation room exists.
- The area grade is low — what's the realistic commute time and amenity access for the typical tenant pool here? Any planned neighborhood developments (good or bad) we should know about?
- What's the average days-on-market for RENTAL listings here right now (not sales)? A rising rental-DOM trend means longer vacancies and softer asking-rent achievability than the comps imply.
- What's the recent tenant-quality profile in this submarket — average credit score on applications, eviction rate, late-payment / NSF rate, and stable-employment percentage? A property-management company in the area should have these aggregated.
- How much new apartment / multifamily construction is in the pipeline within 1–3 miles? Heavy new supply (>2% of stock underway) typically softens rents 12–24 months out; light construction supports rent growth.
Investment metrics
- 1% rule
- 0.35% ✗
- Cap rate
- 1.89%
- Cash-on-cash
- -15.72%
- DSCR
- 0.30
- GRM
- 23.5
CMA / ARV
- ARV (median comp)
- $126,994
- List price
- $264,500
- Delta
- 108.28%
- Verdict
- OVERPRICED
- Comps
- 14 within 1.0 mi
Projected returns pro-forma
-3.0% appreciation · 6.43% rent growth · sell at horizon
- IRR
- -43.9%
- Equity multiple
- -0.37×
- Total profit
- $-101,359
- Equity at exit
- $39,438
- IRR
- -58.1%
- Equity multiple
- -1.07×
- Total profit
- $-153,312
- Equity at exit
- $22,869
Cash invested: $74,060 (down + closing). Projections, not guarantees.
Landlord ↔ Tenant lean methodology
- Overall (STATE)
- 90 Strongly Landlord-Friendly
- State Indiana
- 90 Strongly Landlord-Friendly · R+11
- County
- — inherits STATE
- City
- — inherits STATE
ZIP-level market 46208
- Rents YoY
- 6.4%
- Active inventory
- 279
- Price-to-rent
- 23.5×
Monthly cashflow live
- Estimated rent
- $938 high interval (Pro) →
- Mortgage (P&I)
- −$1,387
- Tax from tax record
- −$214 /mo · $2,569/yr
- Insurance
- −$110
- HOA
- −$0
- Vacancy / Maint / Mgmt
- −$197
- Net cashflow
- $-970
Break-even live
UW: 25.0% down · 7.5% · 30yr · 1.5% tax · 5.0% vac · 8.0% maint · 8.0% mgmt
Financing live
Cash to close
- Down payment
- $66,125
- Closing costs
- $7,935
- Reserves months
- —
- Total cash needed
- —
Loan-product check · same deal, 3 products live
Conventional
25% down · 7.5% · 30yr
- Down + closing
- —
- Monthly P&I
- —
- Monthly cashflow
- —
- DSCR
- —
- Eligible?
- —
Personal DTI + credit; lowest rate.
DSCR
20% down · 8.5% · 30yr
- Down + closing
- —
- Monthly P&I
- —
- Monthly cashflow
- —
- DSCR
- —
- Eligible?
- —
No personal income docs; deal must DSCR.
Hard money
10% down · 12.0% · 12mo
- Down + closing
- —
- Monthly P&I
- —
- Monthly cashflow
- —
- DSCR
- —
- Eligible?
- —
Short-term bridge; refi at stabilization.
Rent comps 18 comps
| Address | Beds | Baths | Sqft | Rent | $/sqft | DOM | Units | Dist |
|---|---|---|---|---|---|---|---|---|
| 1460 W 32nd St Indianapolis, IN | 1.0 | 1.0 | 576 | $847 | $1.47 | 23d | 1 | 0.01mi |
| 1470 W 32nd St Indianapolis, IN | 2.0 | 1.0 | 700 | $1,000 | $1.43 | 43d | 1 | 0.03mi |
| 1341 W Congress Ave Unit 1343 Indianapolis, IN | 1.0 | 1.0 | 600 | $750 | $1.25 | 43d | 1 | 0.15mi |
| 1457 W 29th St Indianapolis, IN | 2.0 | 1.0 | 686 | $995 | $1.45 | 20d | 1 | 0.35mi |
| 1319 W 27th St Indianapolis, IN | 2.0 | 1.0 | 651 | $900 | $1.38 | 12d | 1 | 0.56mi |
| 970 Edgemont Ave Indianapolis, IN | 2.0 | 1.0 | 740 | $845 | $1.14 | 4d | 1 | 0.97mi |
| 541 W 29th St Indianapolis, IN | 1.0 | 1.0 | 740 | $900 | $1.22 | 19d | 1 | 1.09mi |
| 819 Edgemont Ave Apt 105 Indianapolis, IN | — | 1.0 | 440 | $828 | $1.88 | 43d | 1 | 1.14mi |
| 819 Edgemont Ave Apt 115 Indianapolis, IN | 1.0 | 1.0 | 540 | $915 | $1.69 | 43d | 1 | 1.14mi |
| 2937 Shriver Ave Indianapolis, IN | 1.0 | 1.0 | 564 | $850 | $1.51 | 43d | 1 | 1.28mi |
| 524 W 23rd St Indianapolis, IN | 2.0 | 1.0 | 664 | $949 | $1.43 | 43d | 1 | 1.42mi |
| 2316 Indianapolis Ave Indianapolis, IN | 1.0 | 1.0 | 550 | $800 | $1.45 | 14d | 1 | 1.43mi |
| 2774 Pixel DR Indianapolis, IN | 1.0 | 1.0 | 750 | $1,100 | $1.47 | 43d | 1 | 1.44mi |
| 4023 Clarendon Rd Indianapolis, IN | 1.0 | 1.0 | 572 | $950 | $1.66 | 43d | 1 | 1.46mi |
| 3215 N Alton Ave Unit 3230-207 Indianapolis, IN | 1.0 | 1.0 | 662 | $829 | $1.25 | 23d | 1 | 1.48mi |
| 3215 N Alton Ave Unit 3328-206 Indianapolis, IN | 1.0 | 1.0 | 662 | $829 | $1.25 | 21d | 1 | 1.48mi |
| 3215 N Alton Ave Unit 3348-108 Indianapolis, IN | 1.0 | 1.0 | 662 | $849 | $1.28 | 13d | 1 | 1.48mi |
| 3215 N Alton Ave Indianapolis, IN | 1.0–3.0 | 1.0–2.0 | 970 | $849 | $0.88 | 2d | 16 | 1.49mi |
Listing history 18 events
-
2026-06-09days on market $264,500 Active 120 DOM
-
2026-06-08days on market $264,500 Active 119 DOM
-
2026-06-07days on market $264,500 Active 118 DOM
-
2026-06-03days on market $264,500 Active 114 DOM
-
2026-06-02days on market $264,500 Active 113 DOM
-
2026-06-01days on market $264,500 Active 112 DOM
-
2026-05-31days on market $264,500 Active 111 DOM
-
2026-05-14price $265,000 436-char remark
Show marketing remark (436 chars)
Solid quad rental opportunity in a growing Indianapolis neighborhood, part of a 4-property portfolio. Each unit offers comfortable living space with separate entrances, providing privacy and strong rental appeal. Currently producing $3,300/month with stabilized rent of $4,600/month at full occupancy. An excellent opportunity for investors or owner-occupants looking to house hack or add a strong cash-flowing asset to their portfolio.
-
2026-04-14price $275,000 436-char remark
Show marketing remark (436 chars)
Solid quad rental opportunity in a growing Indianapolis neighborhood, part of a 4-property portfolio. Each unit offers comfortable living space with separate entrances, providing privacy and strong rental appeal. Currently producing $3,300/month with stabilized rent of $4,600/month at full occupancy. An excellent opportunity for investors or owner-occupants looking to house hack or add a strong cash-flowing asset to their portfolio.
-
2026-02-11status Active 436-char remark
Show marketing remark (436 chars)
Solid quad rental opportunity in a growing Indianapolis neighborhood, part of a 4-property portfolio. Each unit offers comfortable living space with separate entrances, providing privacy and strong rental appeal. Currently producing $3,300/month with stabilized rent of $4,600/month at full occupancy. An excellent opportunity for investors or owner-occupants looking to house hack or add a strong cash-flowing asset to their portfolio.
-
2026-02-04historical 436-char remark
Show marketing remark (436 chars)
Solid quad rental opportunity in a growing Indianapolis neighborhood, part of a 4-property portfolio. Each unit offers comfortable living space with separate entrances, providing privacy and strong rental appeal. Currently producing $3,300/month with stabilized rent of $4,600/month at full occupancy. An excellent opportunity for investors or owner-occupants looking to house hack or add a strong cash-flowing asset to their portfolio.
-
2026-02-03$280,000 Active 436-char remark
Show marketing remark (436 chars)
Solid quad rental opportunity in a growing Indianapolis neighborhood, part of a 4-property portfolio. Each unit offers comfortable living space with separate entrances, providing privacy and strong rental appeal. Currently producing $3,300/month with stabilized rent of $4,600/month at full occupancy. An excellent opportunity for investors or owner-occupants looking to house hack or add a strong cash-flowing asset to their portfolio.
-
2025-01-29soldstatus $240,000 Closed 908-char remark
Show marketing remark (908 chars)
Welcome to 1456 W 32nd St, Indianapolis, IN 46208 - an exceptional investment opportunity in the heart of the city! Located in a vibrant neighborhood, this property is just a stone's throw away from popular local businesses such as Goose the Market, a renowned butcher shop and deli, and the bustling 16 Tech Innovation District, which is home to a variety of tech startups and innovative companies. Additionally, the property is conveniently situated near the Indianapolis Museum of Art and the beautiful Newfields campus, offering residents easy access to cultural and recreational activities. Don't miss out on this fantastic investment opportunity in Indianapolis! Whether you're looking to expand your rental portfolio or seeking a property with great potential, 1456 W 32nd St is the perfect choice. Schedule a viewing today and see for yourself the incredible possibilities this property has to offer!
-
2024-08-15$280,000 908-char remark
Show marketing remark (908 chars)
Welcome to 1456 W 32nd St, Indianapolis, IN 46208 - an exceptional investment opportunity in the heart of the city! Located in a vibrant neighborhood, this property is just a stone's throw away from popular local businesses such as Goose the Market, a renowned butcher shop and deli, and the bustling 16 Tech Innovation District, which is home to a variety of tech startups and innovative companies. Additionally, the property is conveniently situated near the Indianapolis Museum of Art and the beautiful Newfields campus, offering residents easy access to cultural and recreational activities. Don't miss out on this fantastic investment opportunity in Indianapolis! Whether you're looking to expand your rental portfolio or seeking a property with great potential, 1456 W 32nd St is the perfect choice. Schedule a viewing today and see for yourself the incredible possibilities this property has to offer!
-
2024-08-15historical 908-char remark
Show marketing remark (908 chars)
Welcome to 1456 W 32nd St, Indianapolis, IN 46208 - an exceptional investment opportunity in the heart of the city! Located in a vibrant neighborhood, this property is just a stone's throw away from popular local businesses such as Goose the Market, a renowned butcher shop and deli, and the bustling 16 Tech Innovation District, which is home to a variety of tech startups and innovative companies. Additionally, the property is conveniently situated near the Indianapolis Museum of Art and the beautiful Newfields campus, offering residents easy access to cultural and recreational activities. Don't miss out on this fantastic investment opportunity in Indianapolis! Whether you're looking to expand your rental portfolio or seeking a property with great potential, 1456 W 32nd St is the perfect choice. Schedule a viewing today and see for yourself the incredible possibilities this property has to offer!
-
2021-11-03soldstatus $130,000
-
2006-01-25historical
-
2005-10-25$29,900
ⓘ Source: listings_history table (triggers on properties + properties_extension) + one-shot
backfill from property_details.listing_events for pre-trigger history.
Tax reassessment forecast IN · Partial reset (capped growth)
- Current annual tax
- $2,569 · $214/mo
- Projected year-2 tax
- $2,569 · $214/mo
- Expected delta
- $0/yr ($0/mo · 0.0%)
ⓘ Screening estimate from a state-policy table — verify with the county assessor before closing.
Climate risk First Street
- Flood 1/10 Low FEMA zone X (unshaded) · 0% chance over 30 yrs
- Wildfire 1/10 Low
- Heat 4/10 Moderate 7 d/yr ≥102°F today · 19 d/yr by 30 yrs out
- Wind 2/10 Low 100% chance of damaging wind over 30 yrs
- Air quality 4/10 Moderate 5 unhealthy d/yr today · 7 by 30 yrs out
Nearby sold comps map
Loading sold comps map…
Walkable amenities ~0.75 mi
Loading nearby amenities…
Taxation est. · year 1
- Rental income
- $11,259
- − Mortgage interest
- −$14,816
- − Property taxes
- −$2,569
- − Insurance
- −$1,322
- − Repairs & maintenance
- −$901
- − Management
- −$901
- − Depreciation
- −$7,695
- Taxable loss
- −$16,945
- Est. tax savings @ 24.0%
- +$4,067
- After-tax cash flow
- $-7,575/yr
For passive investors: Depreciation is non-cash, so a rental often shows a tax loss while cash-flowing — sheltering income. Rental losses are passive: they offset passive income freely, and up to $25,000/yr can offset ordinary (W-2) income if you actively participate and your MAGI is under $100k (phasing out to $0 by $150k); unused losses carry forward. On sale, claimed depreciation is recaptured at up to 25%, and gains may owe capital-gains tax (a 1031 exchange can defer both). Figures are a year-1 estimate at your 24.0% rate — not tax advice; consult a CPA.
Schools (NCES district)
- District
- Indianapolis Public Schools
- NCES district ID
- 1804770
- Math proficiency
- 14% ▼ -7.00%
- Reading proficiency
- 20% ▼ -3.00%
- Median HH income
- $32,034
- Composite
- 13.69/100
- National rank
- #9499
- State rank
- #286 of 301 in IN
Livability — Indianapolis city (balance)
No livability data for this city. (Only ~50 U.S. cities are tracked.)
Census & demographics
- Census place
- Indianapolis city (balance), IN
- County
- Marion County · 998,460 people
- City population
- 881,119
- Metro
- Indianapolis-Carmel-Anderson, IN
- Population (ZIP)
- 22,379
- Household income
- $60,062
- Rent vs Own
- Severe rent burden
- 978.0
Population outlook (Marion County) Hauer SSP2
- Today (2025)
- 1,025,572 people
- By 2030
- 1,065,727 · +3.9%
- By 2040
- 1,141,577 · +11.3%
- By 2050
- 1,208,920 · +17.9%
- By 2075
- 1,367,288 · +33.3%
- By 2100
- 1,438,201 · +40.2%
Race, ethnicity, and origin ACS 2023
- Neighborhood character
- Diverse neighborhood (Simpson 0.62)
- Race & ethnicity
- White 46% Black 40% Hispanic / Latino 8% Two or more races 6% Asian 2%
- Hispanic origin (detail)
- Mexican 4%
- Common ancestry
- Romanian 2% Slovak 2% Italian 1%
- Foreign-born
- 4% · Canada
- Languages at home
- 93% English-only · Spanish 5% French/Haitian/Cajun 1% Other Indo-European 1%
Political lean MEDSL · Marion
- 2024 margin
- Strong D (+27.7) · D 63.0% · R 35.3% · Other 1.7%
- 2008→2024 swing
- -0.7pp no change · 2008: 28.4pp · 2024: 27.7pp
- All cycles
- 2024: D+27.7 2020: D+29.1 2016: D+22.8 2012: D+22.2 2008: D+28.4
Not yet ingested
- Civics
- —
Market trends
- HPI YoY
- ▼ -324.63%
- Current HPI
- 319.7725
- Rent YoY
- ▲ 6.43%
- Metro
- Indianapolis-Carmel-Anderson, IN
- State GDP YoY
- ▲ 2.90%
- F500 in state
- 18
Industry mix (Fortune 500 HQ in IN)
| Industry | F500 HQs | Revenue |
|---|---|---|
| Industrial Machinery | 2 | $37B |
|
||
| Healthcare | 1 | $177B |
|
||
| Pharmaceuticals | 1 | $45B |
|
||
| Metals / Steel | 1 | $18B |
|
||
| Agriculture | 1 | $17B |
|
||
| Packaging | 1 | $12B |
|
||
Price history
+786.3% since first listed11 events — show timeline
- 2026-05-14 Price Changed $265,000 MIBOR as Distributed by MLS Grid
- 2026-04-14 Price Changed $275,000 MIBOR as Distributed by MLS Grid
- 2026-02-11 Relisted — MIBOR as Distributed by MLS Grid
- 2026-02-04 Listing Removed — MIBOR as Distributed by MLS Grid
- 2026-02-03 Listed $280,000 MIBOR as Distributed by MLS Grid
- 2025-01-29 Sold (MLS) $240,000 MIBOR as Distributed by MLS Grid
- 2024-08-15 Listed $280,000 MIBOR as Distributed by MLS Grid
- 2024-08-15 Listing Removed — MIBOR as Distributed by MLS Grid
- 2021-11-03 Sold (Public Records) $130,000 Public Records
- 2006-01-25 Listing Removed — MIBOR as Distributed by MLS Grid
- 2005-10-25 Listed $29,900 MIBOR as Distributed by MLS Grid
Property tax history
+17.5%/yrLatest (2025): $2,569 · -8.6% YoY. Source: county tax records.
Cash-flow waterfall
monthlySold comps — $/sqft
last 12 mo · ≤1 miLoading sold comps…