110 Kimberling Shores Ln #5 · Kimberling City, MO
Flood risk 1/10 · Minimal
- FEMA flood zone
- X (unshaded)
- Chance of flooding over 30 yrs
- 0.0%
- Est. flood insurance / yr
- $507 – $1,088
Fire risk 1/10 · Minimal
- Est. fire insurance / yr
- $1,054 – $1,958
Heat risk 5/10 · Moderate
- Hot days now (above 105°F)
- 7 days/yr
- Hot days in 30 yrs
- 21 days/yr
Wind risk 2/10 · Minimal
- Chance of severe wind over 30 yrs
- 1.0%
Air-quality risk 2/10 · Minimal
- Unhealthy air days now
- 0 days/yr
- Unhealthy air days in 30 yrs
- 1 days/yr
Risk factors via First Street. Map © Google.
Why this score? — see what drove the D grade
The composite is a weighted blend of 9 inputs, each scored 0–100. Each bar is that input's sub-score; the figure is the points it added to the 100-point composite (weight × sub-score).
- ARV discount +15.0/15.0
- Cash flow +7.2/30.0
- 1% rule +5.3/10.0
- Condition / age +4.0/5.0
- Schools +3.7/10.0
- Livability +3.5/5.0
- Rent growth +2.5/5.0
- DSCR +1.4/10.0
- Appreciation +0.0/10.0
$149,000
🖨 Deal sheet (PDF) 📄 Offer letter ✓ Due diligence
Listing remarks MLS
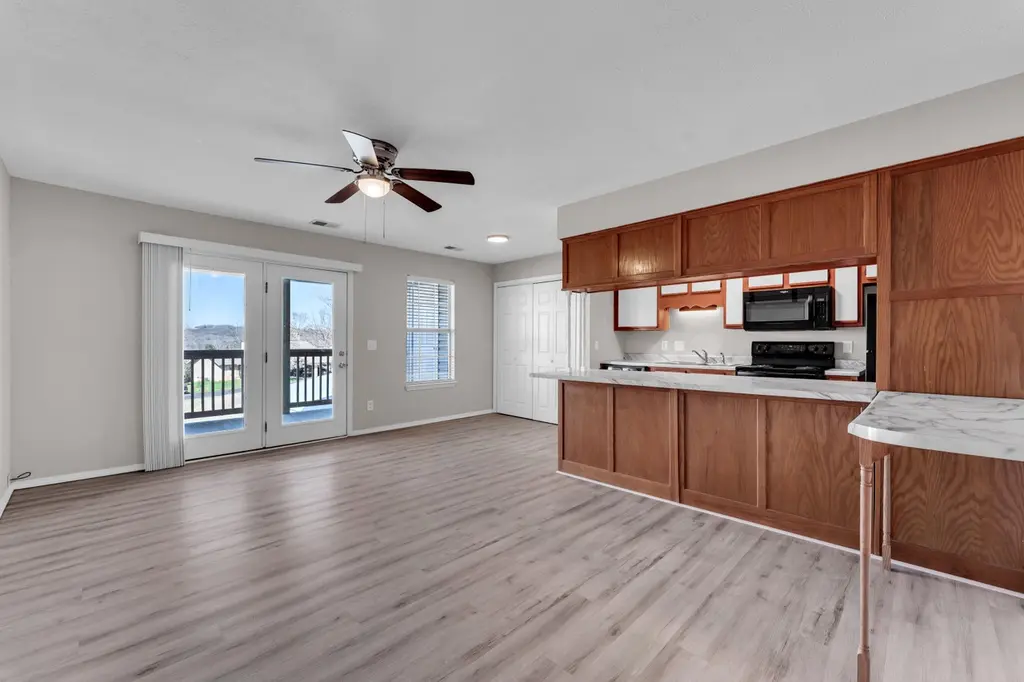
Great Opportunity to have a condo with a 1 car garage where you can take walks to the lake. This neighborhood is just across the bridge. With a pool and a club house for you to enjoy. Don't miss this opportunity.
Key facts
- Walks to the lake
- Pool
- Club house
Tags
Neighborhood map
What this means for you Summary
Snapshot
- This is a 2-bed/2.0-bath condo listed at $149k. Condition is rated good.
Deal economics
- At list price, monthly cash flow is $-205 ($-2k/yr) — negative.
- To cash-flow at today's rent, offer at most $119k (19.9% below list).
- Meets the 1% rule at list price ($2k rent vs $149k).
- Recommended offer: $119k (19.9% below list) — sets the bar for cash-flow.
- Cap rate 4.6% vs local median 1.7% in Kimberling City — top-decile yield for the area; either an underpriced asset or a hidden risk that comps aren't pricing in. Stress-test before assuming the spread holds.
Location & tenants
- Location reads 69/100 on livability (#162 in MO) — a middle-class / working-renter tenant base. Strengths: crime A+, cost of living A+, housing A+; Watch: health & safety C-, employment D, amenities F.
- Blue Eye R-V (rural): math 41% / reading 47% proficiency, ranked #107 of 324 in MO (top 33%) — families likely to look elsewhere, expect single-tenant / working-renter base with shorter leases.
- Zoned schools: Blue Eye Elem. (math 37% / reading 47%, grade F, #481 of 1,115 statewide, top 46%, 198 students, 48% FRL); Blue Eye Middle (math 42% / reading 42%, grade D-, #149 of 391 statewide, top 41%, 170 students, 51% FRL); Blue Eye High (math 54% / reading 64%, grade C+, #35 of 521 statewide, top 8%, 178 students, 42% FRL) — zoned schools at 47% FRL track the district average.
- Market conditions: 291 active listings in the ZIP; 10 comparable units currently listed for rent nearby; rentals lingering (median 46d on market — plan ~5-8 weeks vacancy on turnover, expect pricing pressure); 100% of comp listings sitting > 30 days — soft ceiling on asking rent; 191 units permitted in Stone County in 2024 (0 in 5+ unit buildings).
Forward outlook
- Local home prices are declining (-3.0%/yr); year-one equity from $1k of loan paydown is wiped out by about $4k of value loss. Plan a longer hold.
- Stone County population projected at -30% by 2050 — secular population decline; favor cash flow + early exit over multi-decade hold.
Negotiation context
- It's been on market 101 days — a 9% lower offer ($136k) is reasonable based on typical stale-listing flexibility.
Risks & watch-outs
- Watch-outs: HOA is 25% of rent.
- Climate carrying-cost: extreme-heat days projected 7→21/yr by 2055 (HVAC capex compounding) — expect insurance premiums to compound above CPI over the hold.
Questions for the listing agent
- What do current leases actually rent for vs. the listed asking? Can we see a recent rent roll and the last 12 months of T-12 income?
- It's been on market 101 days. Have you received any prior offers? Is the seller open to a 20% concession, seller financing, or rate buy-down credit?
- What does the HOA fee cover, when was the last increase, and are there any pending special assessments or reserve-fund shortfalls?
- Any open or pending special assessments — roof, HVAC, plumbing, elevator, façade? What's the per-unit balance and payoff schedule, and is the seller paying it off at close or rolling it to the buyer?
- Why hasn't it sold? Are there any deal-killer items the seller is aware of (foundation, flood, title, zoning, code violations)?
- Is there a deadline driving the sale (1031 exchange, divorce, estate, relocation)? That informs how much negotiation room exists.
- Schools are D-rated, which usually means shorter tenancies and higher turnover. Who's the typical renter profile here, and what's been the actual vacancy rate?
- The area grade is low — what's the realistic commute time and amenity access for the typical tenant pool here? Any planned neighborhood developments (good or bad) we should know about?
- What's the average days-on-market for RENTAL listings here right now (not sales)? A rising rental-DOM trend means longer vacancies and softer asking-rent achievability than the comps imply.
- What's the recent tenant-quality profile in this submarket — average credit score on applications, eviction rate, late-payment / NSF rate, and stable-employment percentage? A property-management company in the area should have these aggregated.
- How much new apartment / multifamily construction is in the pipeline within 1–3 miles? Heavy new supply (>2% of stock underway) typically softens rents 12–24 months out; light construction supports rent growth.
Investment metrics
- 1% rule
- 1.03% ✓
- Cap rate
- 4.64%
- Cash-on-cash
- -5.89%
- DSCR
- 0.74
- GRM
- 8.1
CMA / ARV
- ARV (median comp)
- $210,766
- List price
- $149,000
- Delta
- -29.31%
- Verdict
- UNDERPRICED
- Comps
- 20 within 1.0 mi
Projected returns pro-forma
-3.0% appreciation · 3.0% rent growth · sell at horizon
- IRR
- -26.1%
- Equity multiple
- 0.11×
- Total profit
- $-36,935
- Equity at exit
- $22,216
- IRR
- -22.3%
- Equity multiple
- -0.15×
- Total profit
- $-47,908
- Equity at exit
- $12,883
Cash invested: $41,720 (down + closing). Projections, not guarantees.
Landlord ↔ Tenant lean methodology
- Overall (STATE)
- 81 Strongly Landlord-Friendly
- State Missouri
- 81 Strongly Landlord-Friendly · R+10
- County
- — inherits STATE
- City
- — inherits STATE
ZIP-level market 65686
- Home prices YoY
- -31.2%
- Active inventory
- 291
- Price-to-rent
- 8.1×
Monthly cashflow live
- Estimated rent
- $1,534 high interval (Pro) →
- Mortgage (P&I)
- −$781
- Tax est. 1.5%
- −$186 /mo · $2,235/yr
- Insurance
- −$62
- HOA
- −$387
- Vacancy / Maint / Mgmt
- −$322
- Net cashflow
- $-205
Break-even live
Sensitivity live
| Price | -10% $-102 | -5% $-153 | +0% $-205 | +5% $-256 | +10% $-308 |
|---|---|---|---|---|---|
| Rent | -10% $-326 | -5% $-266 | +0% $-205 | +5% $-144 | +10% $-84 |
| Rate | -1.0pp $-130 | -0.5pp $-167 | base $-205 | +0.5pp $-244 | +1.0pp $-283 |
UW: 25.0% down · 7.5% · 30yr · 1.5% tax · 5.0% vac · 8.0% maint · 8.0% mgmt
Financing live
Cash to close
- Down payment
- $37,250
- Closing costs
- $4,470
- Reserves months
- —
- Total cash needed
- —
Loan-product check · same deal, 3 products live
Conventional
25% down · 7.5% · 30yr
- Down + closing
- —
- Monthly P&I
- —
- Monthly cashflow
- —
- DSCR
- —
- Eligible?
- —
Personal DTI + credit; lowest rate.
DSCR
20% down · 8.5% · 30yr
- Down + closing
- —
- Monthly P&I
- —
- Monthly cashflow
- —
- DSCR
- —
- Eligible?
- —
No personal income docs; deal must DSCR.
Hard money
10% down · 12.0% · 12mo
- Down + closing
- —
- Monthly P&I
- —
- Monthly cashflow
- —
- DSCR
- —
- Eligible?
- —
Short-term bridge; refi at stabilization.
Rent comps 10 comps
| Address | Beds | Baths | Sqft | Rent | $/sqft | DOM | Units | Dist |
|---|---|---|---|---|---|---|---|---|
| 275 Ozark Mountain Resort Dr Unit 51 Kimberling City, MO | 2.0 | 2.0 | 790 | $1,450 | $1.84 | 45d | 1 | 0.41mi |
| 225 Ozark Mountain Resort Dr #44 Kimberling City, MO | 2.0 | 2.0 | 750 | $1,100 | $1.47 | 45d | 1 | 0.42mi |
| 395 Ozark Mountain Resort Dr #60 Kimberling City, MO | 2.0 | 2.0 | 726 | $1,400 | $1.93 | 45d | 1 | 0.50mi |
| 11 Kimberling Blvd Unit A Kimberling City, MO | 2.0 | 2.0 | 1140 | $1,750 | $1.54 | 45d | 1 | 1.21mi |
| 3 Kimberling Blvd Unit A Kimberling City, MO | 2.0 | 2.0 | 1140 | $1,750 | $1.54 | 45d | 1 | 1.44mi |
| 2 C St Unit B Kimberling City, MO | 2.0 | 2.0 | 1140 | $1,750 | $1.54 | 45d | 1 | 1.47mi |
| 4 C St Unit B Kimberling City, MO | 2.0 | 2.0 | 1140 | $1,750 | $1.54 | 45d | 1 | 1.47mi |
| 6 C St Unit A Kimberling City, MO | 2.0 | 2.0 | 1140 | $1,750 | $1.54 | 45d | 1 | 1.47mi |
| 8 C St Unit B Kimberling City, MO | 2.0 | 2.0 | 1140 | $1,750 | $1.54 | 45d | 1 | 1.47mi |
| 10 C St Unit A Kimberling City, MO | 2.0 | 2.0 | 1140 | $1,750 | $1.54 | 45d | 1 | 1.47mi |
HOA detail condo
- Monthly dues
- $387 · $4,644/yr
- Likely covers
- pool
- Assessments
- None detected in remarks — confirm with the listing agent.
Listing history 19 events
-
2026-06-22days on market $149,000 Active 101 DOM
-
2026-06-19days on market $149,000 Active 98 DOM
-
2026-06-18days on market $149,000 Active 97 DOM
-
2026-06-17days on market $149,000 Active 96 DOM
-
2026-06-16days on market $149,000 Active 95 DOM
-
2026-06-15days on market $149,000 Active 94 DOM
-
2026-06-14days on market $149,000 Active 92 DOM
-
2026-06-12days on market $149,000 Active 91 DOM
-
2026-06-09days on market $149,000 Active 88 DOM
-
2026-06-08days on market $149,000 Active 87 DOM
-
2026-06-07days on market $149,000 Active 86 DOM
-
2026-06-05days on market $149,000 Active 83 DOM
-
2026-06-03days on market $149,000 Active 82 DOM
-
2026-06-02days on market $149,000 Active 81 DOM
-
2026-06-01days on market $149,000 Active 80 DOM
-
2026-05-31days on market $149,000 Active 79 DOM
-
2026-05-30days on market $149,000 Active 78 DOM
-
2026-05-12price $155,000 212-char remark
Show marketing remark (212 chars)
Great Opportunity to have a condo with a 1 car garage where you can take walks to the lake. This neighborhood is just across the bridge. With a pool and a club house for you to enjoy. Don't miss this opportunity.
-
2026-03-13$160,000 Active 212-char remark
Show marketing remark (212 chars)
Great Opportunity to have a condo with a 1 car garage where you can take walks to the lake. This neighborhood is just across the bridge. With a pool and a club house for you to enjoy. Don't miss this opportunity.
ⓘ Source: listings_history table (triggers on properties + properties_extension) + one-shot
backfill from property_details.listing_events for pre-trigger history.
Climate risk First Street
- Flood 1/10 Low FEMA zone X (unshaded) · 0% chance over 30 yrs
- Wildfire 1/10 Low
- Heat 5/10 Major 7 d/yr ≥105°F today · 21 d/yr by 30 yrs out
- Wind 2/10 Low 100% chance of damaging wind over 30 yrs
- Air quality 2/10 Low 0 unhealthy d/yr today · 1 by 30 yrs out
Nearby sold comps map
Loading sold comps map…
Walkable amenities ~0.75 mi
Loading nearby amenities…
Taxation est. · year 1
- Rental income
- $18,407
- − Mortgage interest
- −$8,346
- − Property taxes
- −$2,235
- − Insurance
- −$745
- − Repairs & maintenance
- −$1,473
- − Management
- −$1,473
- − HOA
- −$4,644
- − Depreciation
- −$4,335
- Taxable loss
- −$4,843
- Est. tax savings @ 24.0%
- +$1,162
- After-tax cash flow
- $-1,297/yr
For passive investors: Depreciation is non-cash, so a rental often shows a tax loss while cash-flowing — sheltering income. Rental losses are passive: they offset passive income freely, and up to $25,000/yr can offset ordinary (W-2) income if you actively participate and your MAGI is under $100k (phasing out to $0 by $150k); unused losses carry forward. On sale, claimed depreciation is recaptured at up to 25%, and gains may owe capital-gains tax (a 1031 exchange can defer both). Figures are a year-1 estimate at your 24.0% rate — not tax advice; consult a CPA.
Condition & rehab AI · 12 photos
This well-maintained condo with a 1-car garage offers a great opportunity to enjoy a lakeside lifestyle with a pool and clubhouse.
Value-add opportunities
- Both Paint exterior trim — Enhances curb appeal and resale value
- Both Install smart home devices — Improves convenience and marketability
- Both Add smart thermostat — Saves energy and appeals to buyers
Renovation cost estimate screening
Value-add ROI direction
- Both Paint exterior trim — Enhances curb appeal and resale value ↑
- Both Install smart home devices — Improves convenience and marketability ↑
- Both Add smart thermostat — Saves energy and appeals to buyers ↑
ⓘ Cost ranges are severity-bucket heuristics (US national rule-of-thumb). Get contractor quotes + a written scope before underwriting a rehab budget.
Schools (NCES district)
- District
- Blue Eye R-V
- NCES district ID
- 2905280
- Math proficiency
- 41% ▲ 3.00%
- Reading proficiency
- 47% ▼ -5.00%
- Median HH income
- $42,591
- Composite
- 37.08/100
- National rank
- #4500
- State rank
- #107 of 324 in MO
Livability — Kimberling City
- Score
- 69/100
- State rank
- #162
- US rank
- #8879
Category grades
Schools grade is shown separately in the Schools card above.
Census & demographics
- Population (ZIP)
- 4,487
Population outlook (Stone County) Hauer SSP2
- Today (2025)
- 28,147 people
- By 2030
- 26,405 · -6.2%
- By 2040
- 22,762 · -19.1%
- By 2050
- 19,706 · -30.0%
- By 2075
- 14,742 · -47.6%
- By 2100
- 10,832 · -61.5%
Race, ethnicity, and origin ACS 2023
- Neighborhood character
- Predominantly White (96%)
- Race & ethnicity
- White 96% Two or more races 3%
- Common ancestry
- Lithuanian 4% Italian 3% Slovak 2%
- Foreign-born
- 2% · Canada
- Languages at home
- 99% English-only · Other Asian/Pacific 0%
Political lean MEDSL · Stone
- 2024 margin
- Solid R (+61.4) · D 18.9% · R 80.3%
- 2008→2024 swing
- -24.1pp toward R · 2008: -37.3pp · 2024: -61.4pp
- All cycles
- 2024: R+61.4 2020: R+61.1 2016: R+62.1 2012: R+49.2 2008: R+37.3
Not yet ingested
- Civics
- —
Market trends
- HPI YoY
- ▼ -90.17%
- Current HPI
- 198.5699
- Rent YoY
- —
- Metro
- —
- State GDP YoY
- ▲ 1.84%
- F500 in state
- 20
Industry mix (Fortune 500 HQ in MO)
| Industry | F500 HQs | Revenue |
|---|---|---|
| Healthcare | 1 | $163B |
|
||
| Insurance | 1 | $21B |
|
||
| Industrial Technology | 1 | $17B |
|
||
| Retail | 1 | $16B |
|
||
| Industrial Distribution | 1 | $10B |
|
||
| Utilities | 1 | $9B |
|
||
Price history
-3.1% since first listed2 events — show timeline
- 2026-05-12 Price Changed $155,000 SOMO
- 2026-03-13 Listed $160,000 SOMO
Cash-flow waterfall
monthlySold comps — $/sqft
last 12 mo · ≤1 miLoading sold comps…