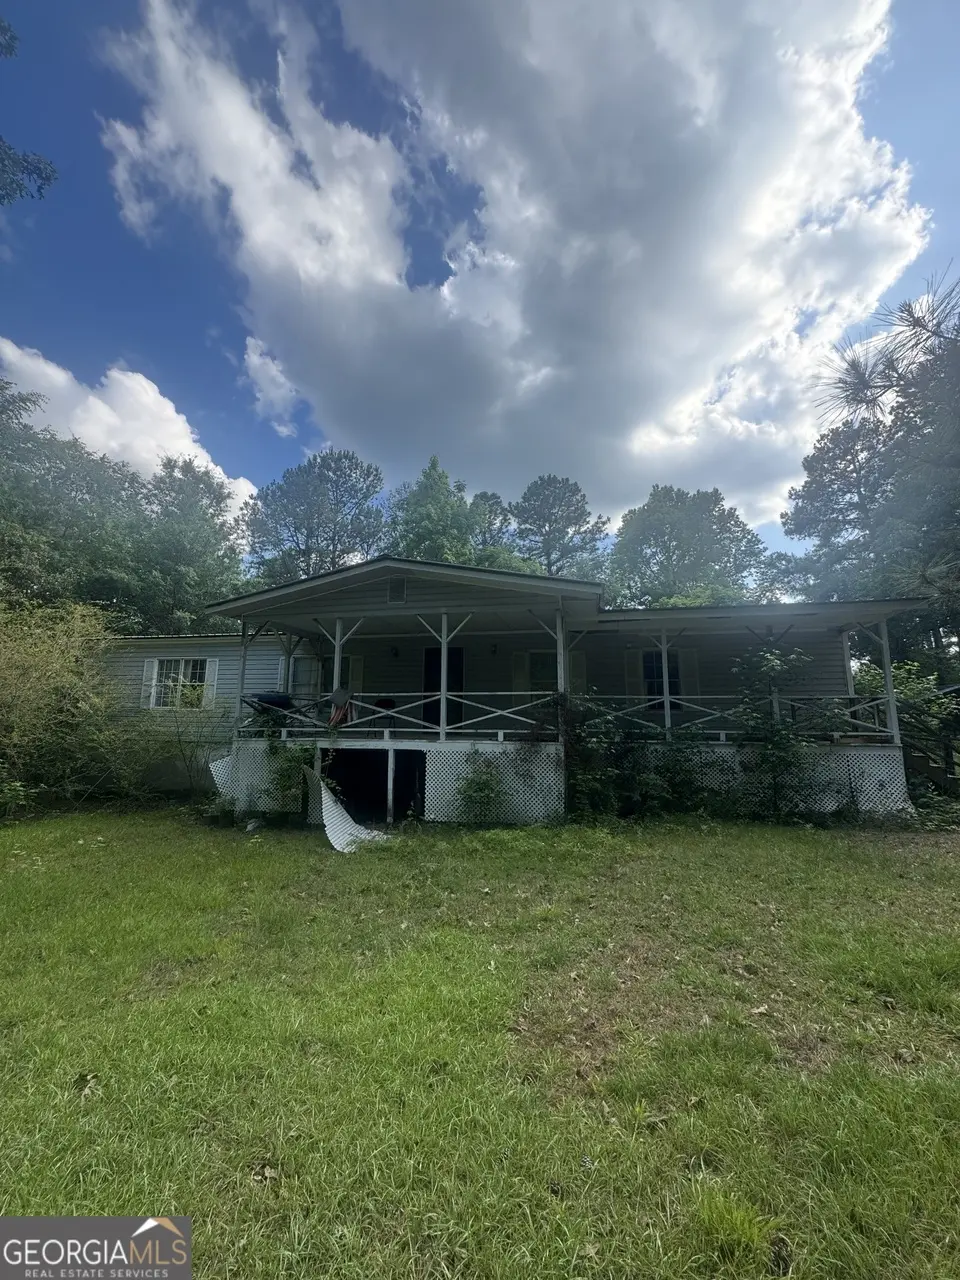
403A Sparta Hwy NE · Milledgeville, GA
Flood risk 1/10 · Minimal
- FEMA flood zone
- X (unshaded)
- Chance of flooding over 30 yrs
- 0.0%
- Est. flood insurance / yr
- $507 – $1,088
Fire risk 5/10 · Moderate
- Est. fire insurance / yr
- $963 – $1,789
Heat risk 6/10 · Moderate
- Hot days now (above 107°F)
- 7 days/yr
- Hot days in 30 yrs
- 16 days/yr
Wind risk 6/10 · Moderate
- Chance of severe wind over 30 yrs
- 62.0%
Air-quality risk 3/10 · Minor
- Unhealthy air days now
- 3 days/yr
- Unhealthy air days in 30 yrs
- 4 days/yr
Risk factors via First Street. Map © Google.
Why this score? — see what drove the C- grade
The composite is a weighted blend of 9 inputs, each scored 0–100. Each bar is that input's sub-score; the figure is the points it added to the 100-point composite (weight × sub-score).
- Cash flow +16.2/30.0
- ARV discount +15.0/15.0
- DSCR +5.0/10.0
- 1% rule +4.4/10.0
- Rent growth +3.5/5.0
- Livability +3.4/5.0
- Condition / age +2.5/5.0
- Schools +1.4/10.0
- Appreciation +0.0/10.0
$150,000
🖨 Deal sheet (PDF) 📄 Offer letter ✓ Due diligence
Listing remarks
Selling AS-IS, this property is full of potential and just waiting for the right touch. Situated on 5 beautiful acres, this fixer-upper offers a great opportunity to make it your own. Conveniently located just 10 minutes from downtown Milledgeville, it combines privacy with easy access to town.
Key facts
- Easy access to town
- Conveniently located
- 5 beautiful acres
Tags
Property features AI
Finance
- Other: Property listed as fixer; Lot size approximately 5.34 acres
- HOA & community: No homeowners association
Exterior
- Parking: Side/rear entrance
- Utilities: Public water; Public sewer; No utilities listed
- Home design: Single-family residence; Residential property; Built in 1985
- Construction: Vinyl siding; Metal roof; Built in 1985
- Exterior features: Deck; Porch; Level, private lot
Interior
- Kitchen: No appliances included
- Bedrooms: 3 bedrooms on the main level
- Flooring: Other flooring
- Bathrooms: 2 full bathrooms on the main level
- Heating & cooling: No heating; No cooling
- Interior features: One-level layout; Crawl space basement; Fireplace (1); Other interior features
- Laundry & utility: No laundry features listed
Neighborhood map
What this means for you Summary
Snapshot
- This is a 3-bed/2.0-bath manufactured listed at $150k.
Deal economics
- At list price, monthly cash flow is $81 ($970/yr) — positive.
- The deal already cash-flows at list — no discount required.
- To meet the 1% rule (rent ≥ 1% of price), the offer needs to be $141k (5.7% below list).
- Recommended offer: $141k (5.7% below list) — sets the bar for 1% rule.
- Cap rate 6.9% vs local median 2.9% in Milledgeville — top-decile yield for the area; either an underpriced asset or a hidden risk that comps aren't pricing in. Stress-test before assuming the spread holds.
Location & tenants
- Location reads 68/100 on livability (#134 in GA) — a middle-class / working-renter tenant base. Strengths: cost of living A+, health & safety A+, housing A-; Watch: amenities D+, crime F, commute F.
- Baldwin County (town): math 13% / reading 20% proficiency, ranked #152 of 174 in GA (top 87%) — low school quality limits family demand, transient renter base, plan for 1-2y turnover; 72% free/reduced lunch — lower-income household profile, screen leases tightly.
- Zoned schools: Midway Hills Primary (484 students, 89% FRL); Oak Hill Ms (math 13% / reading 24%, grade F, #372 of 470 statewide, top 80%, 986 students, 89% FRL); Baldwin High School (math 10% / reading 21%, grade F, #290 of 424 statewide, top 69%, 1,311 students, 89% FRL) — zoned schools average 89% FRL vs 72% district-wide (17 pts higher); higher-poverty schools than district average — tighter screening recommended.
- Market conditions: Rents rising fast (+4.0%/yr); 375 active listings in the ZIP; 202 units permitted in Baldwin County in 2024 (12 in 5+ unit buildings).
- This rent runs 31% of the median local income ($54k/yr) — at the standard rent-burdened threshold; future hikes will face affordability resistance.
Forward outlook
- Local home prices are declining (-3.0%/yr); year-one equity from $1k of loan paydown is wiped out by about $4k of value loss. Plan a longer hold.
- Baldwin County population projected to shrink 8% by 2050 — rents likely to lag national; underwrite the cash flow, not the appreciation.
Negotiation context
- It's been on market 39 days — a 3% lower offer ($146k) is reasonable based on typical stale-listing flexibility.
Risks & watch-outs
- Climate carrying-cost: major wind risk, 62% chance of damaging wind over 30y; moderate wildfire risk; extreme-heat days projected 7→16/yr by 2055 (HVAC capex compounding) — expect insurance premiums to compound above CPI over the hold.
Questions for the listing agent
- It's been on market 39 days. Have you received any prior offers? Is the seller open to a 6% concession, seller financing, or rate buy-down credit?
- Is there a deadline driving the sale (1031 exchange, divorce, estate, relocation)? That informs how much negotiation room exists.
- Schools are F-rated, which usually means shorter tenancies and higher turnover. Who's the typical renter profile here, and what's been the actual vacancy rate?
- Crime grade is F in this area — have there been break-ins, vandalism, or insurance claims at this property in the last 3 years? What carrier currently insures it and at what premium?
- What's the average days-on-market for RENTAL listings here right now (not sales)? A rising rental-DOM trend means longer vacancies and softer asking-rent achievability than the comps imply.
- What's the recent tenant-quality profile in this submarket — average credit score on applications, eviction rate, late-payment / NSF rate, and stable-employment percentage? A property-management company in the area should have these aggregated.
- How much new for-sale + rental construction is in the pipeline within 1–3 miles? Heavy new supply typically softens prices + rents 12–24 months out; constrained supply supports both.
Investment metrics
- 1% rule
- 0.94% ✗
- Cap rate
- 6.94%
- Cash-on-cash
- 2.31%
- DSCR
- 1.10
- GRM
- 8.8
CMA / ARV
- ARV (median comp)
- $185,617
- List price
- $150,000
- Delta
- -19.19%
- Verdict
- UNDERPRICED
- Comps
- 10 within 1.0 mi
Projected returns pro-forma
-3.0% appreciation · 4.05% rent growth · sell at horizon
- IRR
- -11.4%
- Equity multiple
- 0.58×
- Total profit
- $-17,625
- Equity at exit
- $22,365
- IRR
- -0.8%
- Equity multiple
- 0.95×
- Total profit
- $-2,300
- Equity at exit
- $12,969
Cash invested: $42,000 (down + closing). Projections, not guarantees.
Landlord ↔ Tenant lean methodology
- Overall (STATE)
- 90 Strongly Landlord-Friendly
- State Georgia
- 90 Strongly Landlord-Friendly · R+3
- County
- — inherits STATE
- City
- — inherits STATE
ZIP-level market 31061
- Home prices YoY
- -29.9%
- Rents YoY
- 4.0%
- Active inventory
- 375
- Price-to-rent
- 8.8×
Monthly cashflow live
- Estimated rent
- $1,415 medium interval (Pro) →
- Mortgage (P&I)
- −$787
- Tax est. 1.5%
- −$188 /mo · $2,250/yr
- Insurance
- −$62
- HOA
- −$0
- Vacancy / Maint / Mgmt
- −$297
- Net cashflow
- $81
Break-even live
Sensitivity live
| Price | -10% $185 | -5% $133 | +0% $81 | +5% $29 | +10% $-23 |
|---|---|---|---|---|---|
| Rent | -10% $-31 | -5% $25 | +0% $81 | +5% $137 | +10% $193 |
| Rate | -1.0pp $156 | -0.5pp $119 | base $81 | +0.5pp $42 | +1.0pp $2 |
UW: 25.0% down · 7.5% · 30yr · 1.5% tax · 5.0% vac · 8.0% maint · 8.0% mgmt
Financing live
Cash to close
- Down payment
- $37,500
- Closing costs
- $4,500
- Reserves months
- —
- Total cash needed
- —
Loan-product check · same deal, 3 products live
Conventional
25% down · 7.5% · 30yr
- Down + closing
- —
- Monthly P&I
- —
- Monthly cashflow
- —
- DSCR
- —
- Eligible?
- —
Personal DTI + credit; lowest rate.
DSCR
20% down · 8.5% · 30yr
- Down + closing
- —
- Monthly P&I
- —
- Monthly cashflow
- —
- DSCR
- —
- Eligible?
- —
No personal income docs; deal must DSCR.
Hard money
10% down · 12.0% · 12mo
- Down + closing
- —
- Monthly P&I
- —
- Monthly cashflow
- —
- DSCR
- —
- Eligible?
- —
Short-term bridge; refi at stabilization.
Listing history 17 events
-
2026-06-19days on market $150,000 Active 39 DOM
-
2026-06-18days on market $150,000 Active 38 DOM
-
2026-06-17days on market $150,000 Active 37 DOM
-
2026-06-16days on market $150,000 Active 36 DOM
-
2026-06-15days on market $150,000 Active 35 DOM
-
2026-06-14days on market $150,000 Active 33 DOM
-
2026-06-12days on market $150,000 Active 32 DOM
-
2026-06-09days on market $150,000 Active 29 DOM
-
2026-06-08days on market $150,000 Active 28 DOM
-
2026-06-07days on market $150,000 Active 27 DOM
-
2026-06-05days on market $150,000 Active 24 DOM
-
2026-06-03days on market $150,000 Active 23 DOM
-
2026-06-02days on market $150,000 Active 22 DOM
-
2026-06-01days on market $150,000 Active 21 DOM
-
2026-05-31days on market $150,000 Active 20 DOM
-
2026-05-30days on market $150,000 Active 19 DOM
-
2026-05-05$150,000 New 295-char remark
ⓘ Source: listings_history table (triggers on properties + properties_extension) + one-shot
backfill from property_details.listing_events for pre-trigger history.
Climate risk First Street
- Flood 1/10 Low FEMA zone X (unshaded) · 0% chance over 30 yrs
- Wildfire 5/10 Major
- Heat 6/10 Major 7 d/yr ≥107°F today · 16 d/yr by 30 yrs out
- Wind 6/10 Major 62% chance of damaging wind over 30 yrs
- Air quality 3/10 Moderate 3 unhealthy d/yr today · 4 by 30 yrs out
Nearby sold comps map
Loading sold comps map…
Walkable amenities ~0.75 mi
Loading nearby amenities…
Taxation est. · year 1
- Rental income
- $16,974
- − Mortgage interest
- −$8,402
- − Property taxes
- −$2,250
- − Insurance
- −$750
- − Repairs & maintenance
- −$1,358
- − Management
- −$1,358
- − Depreciation
- −$4,364
- Taxable loss
- −$1,508
- Est. tax savings @ 24.0%
- +$362
- After-tax cash flow
- $1,332/yr
For passive investors: Depreciation is non-cash, so a rental often shows a tax loss while cash-flowing — sheltering income. Rental losses are passive: they offset passive income freely, and up to $25,000/yr can offset ordinary (W-2) income if you actively participate and your MAGI is under $100k (phasing out to $0 by $150k); unused losses carry forward. On sale, claimed depreciation is recaptured at up to 25%, and gains may owe capital-gains tax (a 1031 exchange can defer both). Figures are a year-1 estimate at your 24.0% rate — not tax advice; consult a CPA.
Schools (NCES district)
- District
- Baldwin County
- NCES district ID
- 1300210
- Math proficiency
- 13% ▼ -8.00%
- Reading proficiency
- 20% ▼ -5.00%
- Median HH income
- $35,615
- Composite
- 13.61/100
- National rank
- #9508
- State rank
- #152 of 174 in GA
Livability — Milledgeville
- Score
- 68/100
- State rank
- #134
- US rank
- #9206
Category grades
Schools grade is shown separately in the Schools card above.
Census & demographics
- County
- Baldwin County · 41,764 people
- City population
- 41,764
- Metro
- Milledgeville, GA
- Population (ZIP)
- 41,764
- Household income
- $54,263
- Rent vs Own
- Severe rent burden
- 1630.0
Population outlook (Baldwin County) Hauer SSP2
- Today (2025)
- 45,602 people
- By 2030
- 45,481 · -0.3%
- By 2040
- 44,310 · -2.8%
- By 2050
- 42,129 · -7.6%
- By 2075
- 36,819 · -19.3%
- By 2100
- 29,320 · -35.7%
Race, ethnicity, and origin ACS 2023
- Neighborhood character
- Diverse neighborhood (Simpson 0.56)
- Race & ethnicity
- White 51% Black 43% Hispanic / Latino 3% Two or more races 3% Asian 2%
- Common ancestry
- Slovak 1% Serbian 1% Italian 1%
- Foreign-born
- 3% · Canada, South Korea
- Languages at home
- 96% English-only · Spanish 2% Korean 1%
Political lean MEDSL · Baldwin
- 2024 margin
- Toss-up / Even · D 48.6% · R 50.9%
- 2008→2024 swing
- -6.8pp toward R · 2008: 4.6pp · 2024: -2.2pp
- All cycles
- 2024: R+2.2 2020: D+1.3 2016: D+1.7 2012: D+5.5 2008: D+4.6
Not yet ingested
- Civics
- —
Market trends
- HPI YoY
- ▼ -103.16%
- Current HPI
- 241.3758
- Rent YoY
- ▲ 4.05%
- Metro
- Milledgeville, GA
- State GDP YoY
- ▲ 2.66%
- F500 in state
- 28
Industry mix (Fortune 500 HQ in GA)
| Industry | F500 HQs | Revenue |
|---|---|---|
| Paper / Packaging | 2 | $29B |
|
||
| Retail | 1 | $160B |
|
||
| Transportation / Logistics | 1 | $91B |
|
||
| Airlines | 1 | $62B |
|
||
| Consumer Goods | 1 | $47B |
|
||
| Utilities | 1 | $25B |
|
||
Price history
1 event — show timeline
- 2026-05-05 Listed $150,000 GAMLS
Property tax history
+2.4%/yrLatest (2025): $266 · -2.4% YoY. Source: county tax records.
Cash-flow waterfall
monthlySold comps — $/sqft
last 12 mo · ≤1 miLoading sold comps…