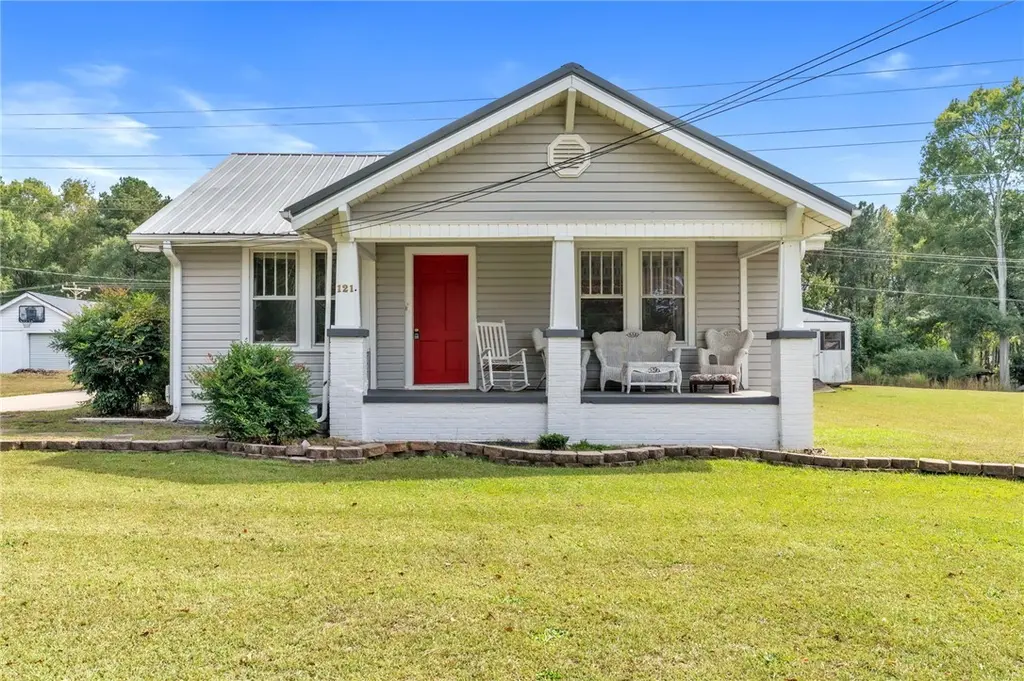
121 Ellison St · Belton, SC
Flood risk 1/10 · Minimal
- FEMA flood zone
- X (unshaded)
- Chance of flooding over 30 yrs
- 0.0%
- Est. flood insurance / yr
- $507 – $1,088
Fire risk 3/10 · Minor
- Est. fire insurance / yr
- $783 – $1,453
Heat risk 6/10 · Moderate
- Hot days now (above 105°F)
- 7 days/yr
- Hot days in 30 yrs
- 17 days/yr
Wind risk 2/10 · Minimal
- Chance of severe wind over 30 yrs
- 4.0%
Air-quality risk 3/10 · Minor
- Unhealthy air days now
- 2 days/yr
- Unhealthy air days in 30 yrs
- 4 days/yr
Risk factors via First Street. Map © Google.
Why this score? — see what drove the D grade
The composite is a weighted blend of 9 inputs, each scored 0–100. Each bar is that input's sub-score; the figure is the points it added to the 100-point composite (weight × sub-score).
- Cash flow +12.7/30.0
- ARV discount +7.5/15.0
- Schools +4.1/10.0
- DSCR +3.8/10.0
- Livability +3.7/5.0
- 1% rule +3.6/10.0
- Appreciation +2.6/10.0
- Rent growth +2.5/5.0
- Condition / age +2.5/5.0
$179,900
🖨 Deal sheet (PDF) 📄 Offer letter ✓ Due diligence
Listing remarks
Welcome to this charming single-story residence in the heart of Belton, showcasing both comfort and character. This 3-bedroom, 2-bathroom home offers a warm and inviting atmosphere, perfect for family living. As you approach, you’ll be greeted by a charming facade with light gray siding and a striking red door that adds a pop of color. The welcoming front porch for sipping morning coffee or enjoying evening breezes. Inside, the living area boasts abundant natural light, seamlessly connecting to the dining room and kitchen. Master bedroom has en-suite bath and spacious. Two additional bedrooms and bathroom are conveniently located just off the dining area. Step outside from the kitchen
Key facts
- Striking red door
- Backyard
- En-suite bath
Tags
Property features AI
Exterior
- Parking: Detached carport; Driveway; 2-car garage
- Utilities: Public water; Public sewer; Electricity available; Natural gas available; Cable available
- Home design: Single-story home; Constructed over 50 years ago; Metal roof; Vinyl siding; Crawlspace foundation; Not in a subdivision; Level, city lot (0.41 acre)
- Construction: Vinyl siding construction; Metal roof; Crawlspace foundation; Built more than 50 years ago
- Exterior features: Front porch; Porch
Interior
- Kitchen: Electric oven; Electric range; Smooth cooktop; Electric water heater
- Bedrooms: 3 bedrooms on the main level
- Flooring: Carpet; Hardwood; Laminate; Vinyl
- Bathrooms: 2 full bathrooms on the main level
- Heating & cooling: Gas heating; Central air (electric)
- Interior features: Primary bedroom has a private bath; Permanent attic stairs; Shower-only baths with walk-in shower; Low-threshold shower (accessibility)
- Laundry & utility: Washer; Dryer; Washer hookup; Electric dryer hookup
Neighborhood map
What this means for you Summary
Snapshot
- This is a 2-bed/2.0-bath other listed at $180k.
Deal economics
- At list price, monthly cash flow is $-19 ($-225/yr) — negative.
- To cash-flow at today's rent, offer at most $177k (1.5% below list).
- To meet the 1% rule (rent ≥ 1% of price), the offer needs to be $155k (13.8% below list).
- Recommended offer: $155k (13.8% below list) — sets the bar for 1% rule.
- Cap rate 6.2% vs local median 3.7% in Belton — top-decile yield for the area; either an underpriced asset or a hidden risk that comps aren't pricing in. Stress-test before assuming the spread holds.
Location & tenants
- Location reads 74/100 on livability (#32 in SC, #4,723 nationally) — a middle-class / working-renter tenant base. Strengths: cost of living A+, health & safety A+, housing A; Watch: commute F, employment F.
- Anderson 02 (rural): math 46% / reading 52% proficiency, ranked #16 of 80 in SC (top 20%) — families likely to look elsewhere, expect single-tenant / working-renter base with shorter leases.
- Zoned schools: Honea Path Elementary (math 39% / reading 44%, grade F, #269 of 597 statewide, top 46%, 570 students, 100% FRL); Belton Middle (math 37% / reading 46%, grade F, #68 of 229 statewide, top 31%, 495 students, 77% FRL); Belton Honea Path High (math 58% / reading 86%, grade B+, #48 of 196 statewide, top 26%, 1,097 students, 67% FRL) — zoned schools average 81% FRL vs 46% district-wide (35 pts higher); higher-poverty schools than district average — tighter screening recommended.
- Market conditions: 134 active listings in the ZIP; 1 comparable units currently listed for rent nearby; 1,255 units permitted in Anderson County in 2024 (0 in 5+ unit buildings).
Forward outlook
- Local home prices are declining (-3.0%/yr); year-one equity from $1k of loan paydown is wiped out by about $5k of value loss. Plan a longer hold.
- Anderson County population projected at +14% by 2050 — modest demand growth; plan on rents tracking national, not racing it.
Negotiation context
- It's been on market 36 days — a 3% lower offer ($175k) is reasonable based on typical stale-listing flexibility.
- 3 sale attempts with the ask held roughly flat each time — persistent listings suggest the price (not the market) is what's stuck; bring a comps-based counter.
Risks & watch-outs
- Climate carrying-cost: extreme-heat days projected 7→17/yr by 2055 (HVAC capex compounding) — expect insurance premiums to compound above CPI over the hold.
Questions for the listing agent
- What do current leases actually rent for vs. the listed asking? Can we see a recent rent roll and the last 12 months of T-12 income?
- It's been on market 36 days. Have you received any prior offers? Is the seller open to a 14% concession, seller financing, or rate buy-down credit?
- Built in 1960 — when were the roof, HVAC, electrical panel, plumbing, and water heater last replaced?
- Is there a deadline driving the sale (1031 exchange, divorce, estate, relocation)? That informs how much negotiation room exists.
- The area grade is low — what's the realistic commute time and amenity access for the typical tenant pool here? Any planned neighborhood developments (good or bad) we should know about?
- What's the average days-on-market for RENTAL listings here right now (not sales)? A rising rental-DOM trend means longer vacancies and softer asking-rent achievability than the comps imply.
- What's the recent tenant-quality profile in this submarket — average credit score on applications, eviction rate, late-payment / NSF rate, and stable-employment percentage? A property-management company in the area should have these aggregated.
- How much new for-sale + rental construction is in the pipeline within 1–3 miles? Heavy new supply typically softens prices + rents 12–24 months out; constrained supply supports both.
Investment metrics
- 1% rule
- 0.86% ✗
- Cap rate
- 6.17%
- Cash-on-cash
- -0.45%
- DSCR
- 0.98
- GRM
- 9.7
CMA / ARV
No comps found within radius.
Projected returns pro-forma
-3.0% appreciation · 3.0% rent growth · sell at horizon
- IRR
- -17.0%
- Equity multiple
- 0.40×
- Total profit
- $-30,322
- Equity at exit
- $26,824
- IRR
- -8.9%
- Equity multiple
- 0.45×
- Total profit
- $-27,847
- Equity at exit
- $15,554
Cash invested: $50,372 (down + closing). Projections, not guarantees.
Landlord ↔ Tenant lean methodology
- Overall (STATE)
- 90 Strongly Landlord-Friendly
- State South Carolina
- 90 Strongly Landlord-Friendly · R+6
- County
- — inherits STATE
- City
- — inherits STATE
ZIP-level market 29627
- Home prices YoY
- -1.3%
- Active inventory
- 134
- Price-to-rent
- 9.7×
Monthly cashflow live
- Estimated rent
- $1,550 medium interval (Pro) →
- Mortgage (P&I)
- −$943
- Tax est. 1.5%
- −$225 /mo · $2,698/yr
- Insurance
- −$75
- HOA
- −$0
- Vacancy / Maint / Mgmt
- −$326
- Net cashflow
- $-19
Break-even live
Sensitivity live
| Price | -10% $106 | -5% $43 | +0% $-19 | +5% $-81 | +10% $-143 |
|---|---|---|---|---|---|
| Rent | -10% $-141 | -5% $-80 | +0% $-19 | +5% $42 | +10% $104 |
| Rate | -1.0pp $72 | -0.5pp $27 | base $-19 | +0.5pp $-65 | +1.0pp $-113 |
UW: 25.0% down · 7.5% · 30yr · 1.5% tax · 5.0% vac · 8.0% maint · 8.0% mgmt
Financing live
Cash to close
- Down payment
- $44,975
- Closing costs
- $5,397
- Reserves months
- —
- Total cash needed
- —
Loan-product check · same deal, 3 products live
Conventional
25% down · 7.5% · 30yr
- Down + closing
- —
- Monthly P&I
- —
- Monthly cashflow
- —
- DSCR
- —
- Eligible?
- —
Personal DTI + credit; lowest rate.
DSCR
20% down · 8.5% · 30yr
- Down + closing
- —
- Monthly P&I
- —
- Monthly cashflow
- —
- DSCR
- —
- Eligible?
- —
No personal income docs; deal must DSCR.
Hard money
10% down · 12.0% · 12mo
- Down + closing
- —
- Monthly P&I
- —
- Monthly cashflow
- —
- DSCR
- —
- Eligible?
- —
Short-term bridge; refi at stabilization.
Rent comps 1 comps
| Address | Beds | Baths | Sqft | Rent | $/sqft | DOM | Units | Dist |
|---|---|---|---|---|---|---|---|---|
| 130 Ellison St Belton, SC | 3.0 | 2.0 | 1400 | $1,550 | $1.11 | 4d | 1 | 0.07mi |
Listing history 21 events
-
2026-06-22days on market $179,900 Active 36 DOM
-
2026-06-18days on market $179,900 Active 33 DOM
-
2026-06-17days on market $179,900 Active 32 DOM
-
2026-06-16pricedays on market $179,900 Active 31 DOM
-
2026-06-15days on market $184,900 Active 30 DOM
-
2026-06-13days on market $184,900 Active 28 DOM
-
2026-06-10days on market $184,900 Active 25 DOM
-
2026-06-09days on market $184,900 Active 24 DOM
-
2026-06-08days on market $184,900 Active 23 DOM
-
2026-06-07days on market $184,900 Active 22 DOM
-
2026-06-03days on market $184,900 Active 18 DOM
-
2026-06-03days on market $184,900 Active 17 DOM
-
2026-06-01days on market $184,900 Active 16 DOM
-
2026-05-31days on market $184,900 Active 15 DOM
-
2026-05-16$184,900 Active
-
2026-04-14status Pending
-
2026-04-13historical
-
2026-01-05price $185,000
-
2025-11-25status Active
-
2025-11-18historical Active Under Contract
-
2025-10-10$195,000 Active
ⓘ Source: listings_history table (triggers on properties + properties_extension) + one-shot
backfill from property_details.listing_events for pre-trigger history.
Climate risk First Street
- Flood 1/10 Low FEMA zone X (unshaded) · 0% chance over 30 yrs
- Wildfire 3/10 Moderate
- Heat 6/10 Major 7 d/yr ≥105°F today · 17 d/yr by 30 yrs out
- Wind 2/10 Low 4% chance of damaging wind over 30 yrs
- Air quality 3/10 Moderate 2 unhealthy d/yr today · 4 by 30 yrs out
Nearby sold comps map
Loading sold comps map…
Walkable amenities ~0.75 mi
Loading nearby amenities…
Taxation est. · year 1
- Rental income
- $18,600
- − Mortgage interest
- −$10,077
- − Property taxes
- −$2,698
- − Insurance
- −$900
- − Repairs & maintenance
- −$1,488
- − Management
- −$1,488
- − Depreciation
- −$5,233
- Taxable loss
- −$3,285
- Est. tax savings @ 24.0%
- +$788
- After-tax cash flow
- $563/yr
For passive investors: Depreciation is non-cash, so a rental often shows a tax loss while cash-flowing — sheltering income. Rental losses are passive: they offset passive income freely, and up to $25,000/yr can offset ordinary (W-2) income if you actively participate and your MAGI is under $100k (phasing out to $0 by $150k); unused losses carry forward. On sale, claimed depreciation is recaptured at up to 25%, and gains may owe capital-gains tax (a 1031 exchange can defer both). Figures are a year-1 estimate at your 24.0% rate — not tax advice; consult a CPA.
Schools (NCES district)
- District
- Anderson 02
- NCES district ID
- 4500810
- Math proficiency
- 46% ▼ -1.00%
- Reading proficiency
- 52% ▲ 5.00%
- Median HH income
- $38,940
- Composite
- 40.88/100
- National rank
- #3623
- State rank
- #16 of 80 in SC
Livability — Belton
- Score
- 74/100
- State rank
- #32
- US rank
- #4723
Category grades
Schools grade is shown separately in the Schools card above.
Census & demographics
- Census place
- Belton, SC
- City population
- 16,518
- Population (ZIP)
- 16,518
Population outlook (Anderson County) Hauer SSP2
- Today (2025)
- 210,546 people
- By 2030
- 217,791 · +3.4%
- By 2040
- 230,643 · +9.5%
- By 2050
- 240,220 · +14.1%
- By 2075
- 259,518 · +23.3%
- By 2100
- 258,696 · +22.9%
Race, ethnicity, and origin ACS 2023
- Neighborhood character
- Predominantly White (83%)
- Race & ethnicity
- White 83% Black 12% Two or more races 4% Hispanic / Latino 2%
- Common ancestry
- Serbian 3% Slovak 2% Lithuanian 1%
- Foreign-born
- 2% · Canada
- Languages at home
- 97% English-only · Russian/Polish/Slavic 2% Spanish 1%
Political lean MEDSL · Anderson
- 2024 margin
- Solid R (+47.4) · D 25.7% · R 73.1% · Other 1.2%
- 2008→2024 swing
- -14.1pp toward R · 2008: -33.3pp · 2024: -47.4pp
- All cycles
- 2024: R+47.4 2020: R+42.0 2016: R+43.7 2012: R+36.4 2008: R+33.3
Not yet ingested
- Civics
- —
Market trends
- HPI YoY
- ▼ -4.78%
- Current HPI
- 355.0273
- Rent YoY
- —
- Metro
- —
- State GDP YoY
- ▲ 4.51%
- F500 in state
- 2
Industry mix (Fortune 500 HQ in SC)
| Industry | F500 HQs | Revenue |
|---|---|---|
| Packaging | 1 | $7B |
|
||
Price history
-5.2% since first listed7 events — show timeline
- 2026-05-16 Listed $184,900 WUMLS
- 2026-04-14 Pending — WUMLS
- 2026-04-13 Listing Removed — WUMLS
- 2026-01-05 Price Changed $185,000 WUMLS
- 2025-11-25 Relisted — WUMLS
- 2025-11-18 Contingent — WUMLS
- 2025-10-10 Listed $195,000 WUMLS
Property tax history
-25.5%/yrLatest (2025): $40 · +0.0% YoY. Source: county tax records.
Cash-flow waterfall
monthlySold comps — $/sqft
last 12 mo · ≤1 miLoading sold comps…