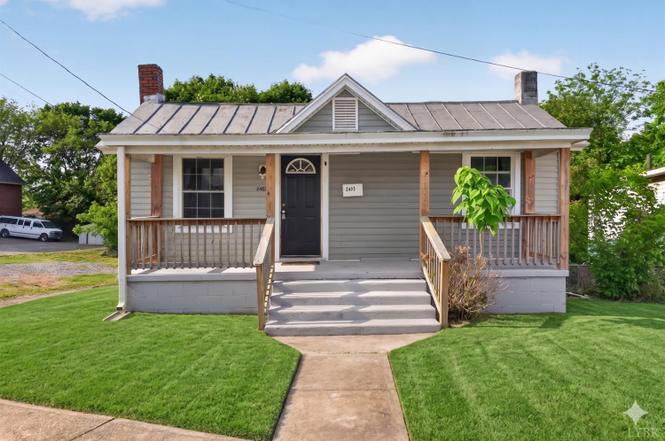
2403 Poplar St · Lynchburg, VA
Flood risk 1/10 · Minimal
- FEMA flood zone
- X (unshaded)
- Chance of flooding over 30 yrs
- 0.0%
- Est. flood insurance / yr
- $473 – $860
Fire risk 4/10 · Minor
- Est. fire insurance / yr
- $666 – $1,236
Heat risk 5/10 · Moderate
- Hot days now (above 102°F)
- 7 days/yr
- Hot days in 30 yrs
- 18 days/yr
Wind risk 2/10 · Minimal
- Chance of severe wind over 30 yrs
- 2.0%
Air-quality risk 2/10 · Minimal
- Unhealthy air days now
- 0 days/yr
- Unhealthy air days in 30 yrs
- 1 days/yr
Risk factors via First Street. Map © Google.
Why this score? — see what drove the B- grade
The composite is a weighted blend of 9 inputs, each scored 0–100. Each bar is that input's sub-score; the figure is the points it added to the 100-point composite (weight × sub-score).
- Cash flow +25.7/30.0
- ARV discount +13.0/15.0
- DSCR +8.6/10.0
- 1% rule +5.8/10.0
- Livability +4.5/5.0
- Schools +4.0/10.0
- Rent growth +3.8/5.0
- Condition / age +2.5/5.0
- Appreciation +0.0/10.0
$119,900
🖨 Deal sheet 📄 Offer letter ✓ Due diligence
Listing remarks MLS
Nice bungalow with updates and 2 spacious bedrooms, one level living. New plumbing, flooring, kitchen and bath. Will rent between $700-$750 month.
Key facts
- Two new windows
- Walkable to downtown
- New trim
Tags
Property features AI
Exterior
- Parking: Off-street parking
- Utilities: Public water; Public sewer
- Home design: Single-family residence; One story
- Construction: Vinyl siding; Metal and shingle roof; Crawl space foundation; Built area above grade: 975
- Exterior features: Garden; Deck; Front porch
Interior
- Kitchen: Electric range; Refrigerator
- Flooring: Tile flooring; Vinyl flooring
- Bathrooms: 1 full bathroom
- Heating & cooling: Baseboard heating; Window air conditioning
- Interior features: Garden; Deck and porch
- Laundry & utility: Washer and dryer included; Washer hookup; Laundry closet; Electric water heater
Neighborhood map
What this means for you Summary
Snapshot
- This is a 2-bed/1.0-bath single-family listed at $120k.
Deal economics
- At list price, monthly cash flow is $288 ($3k/yr) — positive.
- The deal already cash-flows at list — no discount required.
- Meets the 1% rule at list price ($1k rent vs $120k).
- Recommended offer: $116k (3.0% below list) — sets the bar for market timing.
- Cap rate 9.2% vs local median 4.0% in Lynchburg — top-decile yield for the area; either an underpriced asset or a hidden risk that comps aren't pricing in. Stress-test before assuming the spread holds.
Location & tenants
- Location reads 91/100 on livability (#1 in VA, #58 nationally) — a professional / high-income tenant draw. Strengths: amenities A+, commute A+, cost of living A+; Watch: crime C-, employment D+.
- Lynchburg City Public School District (urban): math 36% / reading 61% proficiency, ranked #104 of 131 in VA (top 79%) — families likely to look elsewhere, expect single-tenant / working-renter base with shorter leases; 61% free/reduced lunch — lower-income household profile, screen leases tightly.
- Zoned schools: Sandusky Middle (math 29% / reading 52%, grade F, #303 of 342 statewide, top 89%, 568 students, 96% FRL); Heritage High (math 32% / reading 77%, grade C-, #281 of 319 statewide, top 90%, 1,073 students, 94% FRL) — zoned schools average 95% FRL vs 61% district-wide (34 pts higher); higher-poverty schools than district average — tighter screening recommended.
- Market conditions: Rents rising fast (+5.1%/yr); 318 active listings in the ZIP; 17 comparable units currently listed for rent nearby; rentals at typical pace (median 21d on market — plan ~3-4 weeks tenant-placement turnaround); 472 units permitted in Lynchburg city in 2024 (240 in 5+ unit buildings).
Forward outlook
- Local home prices are declining (-3.0%/yr); year-one equity from $829 of loan paydown is wiped out by about $4k of value loss. Plan a longer hold.
- Lynchburg County population projected at +37% by 2050 — long-run rental-demand tailwind backs the buy-and-hold thesis.
- At projected returns (-3.0% appreciation + 5.1% rent growth), your $34k cash investment doubles in ~9 years — after that, you're playing with house money.
Negotiation context
- It's been on market 53 days — a 3% lower offer ($116k) is reasonable based on typical stale-listing flexibility.
- 5 sale attempts since 4y ago with the ask held roughly flat each time — persistent listings suggest the price (not the market) is what's stuck; bring a comps-based counter.
- Current owner paid $58k; list at $120k implies a 107% gain — meaningful room to come down on a strong offer.
Risks & watch-outs
- Watch-outs: built in 1905 — expect roof / HVAC / electrical / plumbing capex.
- Climate carrying-cost: extreme-heat days projected 7→18/yr by 2055 (HVAC capex compounding) — expect insurance premiums to compound above CPI over the hold.
Questions for the listing agent
- It's been on market 53 days. Have you received any prior offers? Is the seller open to a 3% concession, seller financing, or rate buy-down credit?
- Built in 1905 — when were the roof, HVAC, electrical panel, plumbing, and water heater last replaced?
- Is there a deadline driving the sale (1031 exchange, divorce, estate, relocation)? That informs how much negotiation room exists.
- Schools are A-rated — typically a magnet for longer-tenancy family renters. What's the average tenant stay here, and is there a school-zone premium baked into asking?
- What's the average days-on-market for RENTAL listings here right now (not sales)? A rising rental-DOM trend means longer vacancies and softer asking-rent achievability than the comps imply.
- What's the recent tenant-quality profile in this submarket — average credit score on applications, eviction rate, late-payment / NSF rate, and stable-employment percentage? A property-management company in the area should have these aggregated.
- How much new for-sale + rental construction is in the pipeline within 1–3 miles? Heavy new supply typically softens prices + rents 12–24 months out; constrained supply supports both.
Investment metrics
- 1% rule
- 1.08% ✓
- Cap rate
- 9.17%
- Cash-on-cash
- 10.29%
- DSCR
- 1.46
- GRM
- 7.8
CMA / ARV
- ARV (median comp)
- $136,709
- List price
- $119,900
- Delta
- -12.30%
- Verdict
- UNDERPRICED
- Comps
- 20 within 1.0 mi
Show comp detail 12 sales within ~0.75 mi
| Address | Dist | Beds/Ba | Sqft | Sold | Price | $/sf | Match |
|---|---|---|---|---|---|---|---|
| 217 Race St | 0.26mi | 2/1.0 | 936 (-1%) | 2mo | $130,000 | $139 | 84 |
| 2802 Loraine St | 0.26mi | 2/1.0 | 987 (+4%) | 15mo | $35,000 | $35 | 68 |
| 909 Virginia St | 0.25mi | 3/1.0 (+1) | 1,064 (+12%) | 6mo | $171,000 | $161 | 58 |
| 136 Jubilee Dr | 0.42mi | 3/2.0 (+1) | 912 (-4%) | 10mo | $187,000 | $205 | 57 |
| 1725 Otey St | 0.72mi | 3/1.0 (+1) | 961 (+1%) | 4mo | $120,000 | $125 | 55 |
| 2013 Poplar St | 0.33mi | 3/2.5 (+1) | 1,040 (+10%) | 4mo | $176,000 | $169 | 54 |
| 305 Winston Ridge Rd | 0.65mi | 2/2.0 | 858 (-10%) | 0mo | $175,000 | $204 | 50 |
| 1911 Bransford St | 0.55mi | 1/1.0 (-1) | 880 (-7%) | 9mo | $135,000 | $153 | 49 |
| 1534 Otey St. St | 0.67mi | 2/1.0 | 1,031 (+9%) | 7mo | $169,900 | $165 | 48 |
| 1114 Knight St | 0.58mi | 3/2.0 (+1) | 1,085 (+14%) | 0mo | $43,600 | $40 | 40 |
| 218 Winston Ridge Rd | 0.69mi | 3/2.0 (+1) | 1,080 (+14%) | 5mo | $190,000 | $176 | 31 |
| 1113 17th Street St | 0.70mi | 3/2.0 (+1) | 1,081 (+14%) | 15mo | $215,400 | $199 | 22 |
Match score weights: distance 35% · size 25% · config 20% · recency 20%. Top-matched comps best support the ARV.
Projected returns pro-forma
-3.0% appreciation · 5.11% rent growth · sell at horizon
- IRR
- 1.3%
- Equity multiple
- 1.05×
- Total profit
- $1,658
- Equity at exit
- $17,877
- IRR
- 12.7%
- Equity multiple
- 2.10×
- Total profit
- $36,857
- Equity at exit
- $10,367
Cash invested: $33,572 (down + closing). Projections, not guarantees.
Landlord ↔ Tenant lean methodology
- Overall (STATE)
- 55 Moderately Landlord-Leaning
- State Virginia
- 55 Moderately Landlord-Leaning · D+2
- County
- — inherits STATE
- City
- — inherits STATE
ZIP-level market 24502
- Rents YoY
- 5.1%
- Active inventory
- 318
- Price-to-rent
- 7.8×
Monthly cashflow live
- Estimated rent
- $1,289 high interval (Pro) →
- Mortgage (P&I)
- −$629
- Tax from tax record
- −$52 /mo · $620/yr
- Insurance
- −$50
- HOA
- −$0
- Vacancy / Maint / Mgmt
- −$271
- Net cashflow
- $288
Break-even live
UW: 25.0% down · 7.5% · 30yr · 1.5% tax · 5.0% vac · 8.0% maint · 8.0% mgmt
Financing live
Cash to close
- Down payment
- $29,975
- Closing costs
- $3,597
- Reserves months
- —
- Total cash needed
- —
Loan-product check · same deal, 3 products live
Conventional
25% down · 7.5% · 30yr
- Down + closing
- —
- Monthly P&I
- —
- Monthly cashflow
- —
- DSCR
- —
- Eligible?
- —
Personal DTI + credit; lowest rate.
DSCR
20% down · 8.5% · 30yr
- Down + closing
- —
- Monthly P&I
- —
- Monthly cashflow
- —
- DSCR
- —
- Eligible?
- —
No personal income docs; deal must DSCR.
Hard money
10% down · 12.0% · 12mo
- Down + closing
- —
- Monthly P&I
- —
- Monthly cashflow
- —
- DSCR
- —
- Eligible?
- —
Short-term bridge; refi at stabilization.
Rent comps 17 comps
| Address | Beds | Baths | Sqft | Rent | $/sqft | DOM | Units | Dist |
|---|---|---|---|---|---|---|---|---|
| 1500 Main St Lynchburg, VA | 1.0–2.0 | 1.0 | 1182 | $1,600 | $1.35 | 13d | 6 | 0.56mi |
| 1810 Laurel St Lynchburg, VA | 2.0 | 1.0 | 720 | $995 | $1.38 | 43d | 1 | 0.60mi |
| 1308 Clay St Apt 2 Lynchburg, VA | 1.0 | 1.0 | 750 | $995 | $1.33 | 21d | 1 | 0.72mi |
| 1217 Church St Unit 210 Lynchburg, VA | 1.0 | 1.0 | 635 | $1,150 | $1.81 | 13d | 1 | 0.77mi |
| 51 11th St Lynchburg, VA | 1.0 | 1.0 | 608 | $1,295 | $2.13 | 13d | 1 | 0.91mi |
| 801 Church St Unit 6 Lynchburg, VA | 1.0 | 1.0 | 675 | $1,200 | $1.78 | 43d | 1 | 1.08mi |
| 801 Church St Unit 8 Lynchburg, VA | 2.0 | 2.0 | 875 | $1,850 | $2.11 | 13d | 1 | 1.08mi |
| 900 Polk St Unit A Lynchburg, VA | 3.0 | 1.0 | 1100 | $895 | $0.81 | 13d | 1 | 1.08mi |
| 723 Jefferson St Lynchburg, VA | 1.0 | 1.0 | 723 | $1,095 | $1.51 | 13d | 1 | 1.12mi |
| 1106 Pierce St Lynchburg, VA | 3.0 | 2.0 | 1018 | $875 | $0.86 | 21d | 1 | 1.14mi |
| 1401 Kemper St Lynchburg, VA | 2.0–3.0 | 2.0 | 1118 | $707 | $0.63 | 21d | 6 | 1.17mi |
| 2205 Easley Ave Lynchburg, VA | 2.0 | 2.0 | 870 | $1,400 | $1.61 | 43d | 1 | 1.18mi |
| 612 Commerce St Lynchburg, VA | 1.0–2.0 | 1.0–2.0 | 716 | $1,250 | $1.74 | 13d | 2 | 1.20mi |
| 2518 Carter St Lynchburg, VA | 3.0 | 2.0 | 1091 | $1,500 | $1.37 | 43d | 1 | 1.29mi |
| 2336 Aragon St Lynchburg, VA | 2.0 | 1.0 | 1042 | $995 | $0.95 | 13d | 1 | 1.37mi |
| 2210 Haden St Lynchburg, VA | 2.0 | 1.0 | 784 | $1,050 | $1.34 | 43d | 1 | 1.45mi |
| 317 Polk St Lynchburg, VA | 3.0 | 2.0 | 925 | $1,650 | $1.78 | 43d | 1 | 1.45mi |
Listing history 26 events
-
2026-06-19days on market $119,900 Active 53 DOM
-
2026-06-18days on market $119,900 Active 52 DOM
-
2026-06-17days on market $119,900 Active 51 DOM
-
2026-06-16days on market $119,900 Active 50 DOM
-
2026-06-15days on market $119,900 Active 49 DOM
-
2026-06-14days on market $119,900 Active 47 DOM
-
2026-06-13days on market $119,900 Active 46 DOM
-
2026-06-10days on market $119,900 Active 44 DOM
-
2026-06-09days on market $119,900 Active 43 DOM
-
2026-06-08days on market $119,900 Active 42 DOM
-
2026-06-07days on market $119,900 Active 41 DOM
-
2026-06-03days on market $119,900 Active 37 DOM
-
2026-06-02days on market $119,900 Active 36 DOM
-
2026-06-01days on market $119,900 Active 35 DOM
-
2026-05-31days on market $119,900 Active 34 DOM
-
2026-05-30days on market $119,900 Active 33 DOM
-
2026-04-27$119,900 Active 710-char remark
-
2025-11-25price $95,000
-
2025-10-30$99,900 Active
-
2022-08-24soldstatus $58,000 Closed
Show marketing remark (146 chars)
Nice bungalow with updates and 2 spacious bedrooms, one level living. New plumbing, flooring, kitchen and bath. Will rent between $700-$750 month.
-
2022-08-04status Pending
Show marketing remark (146 chars)
Nice bungalow with updates and 2 spacious bedrooms, one level living. New plumbing, flooring, kitchen and bath. Will rent between $700-$750 month.
-
2022-07-11status Active
Show marketing remark (146 chars)
Nice bungalow with updates and 2 spacious bedrooms, one level living. New plumbing, flooring, kitchen and bath. Will rent between $700-$750 month.
-
2022-07-08$64,900 Active
Show marketing remark (146 chars)
Nice bungalow with updates and 2 spacious bedrooms, one level living. New plumbing, flooring, kitchen and bath. Will rent between $700-$750 month.
-
2022-05-18status Pending
-
2022-05-14$64,900 Active
-
2006-01-05soldstatus $15,900
ⓘ Source: listings_history table (triggers on properties + properties_extension) + one-shot
backfill from property_details.listing_events for pre-trigger history.
Tax reassessment forecast VA · Resets to sale price
- Current annual tax
- $620 · $52/mo
- Projected year-2 tax
- $983 · $82/mo
- Expected delta
- +$363/yr (+$30/mo · 58.6%)
ⓘ Screening estimate from a state-policy table — verify with the county assessor before closing.
Climate risk First Street
- Flood 1/10 Low FEMA zone X (unshaded) · 0% chance over 30 yrs
- Wildfire 4/10 Moderate
- Heat 5/10 Major 7 d/yr ≥102°F today · 18 d/yr by 30 yrs out
- Wind 2/10 Low 2% chance of damaging wind over 30 yrs
- Air quality 2/10 Low 0 unhealthy d/yr today · 1 by 30 yrs out
Nearby sold comps map
Loading sold comps map…
Walkable amenities ~0.75 mi
Loading nearby amenities…
Taxation est. · year 1
- Rental income
- $15,467
- − Mortgage interest
- −$6,716
- − Property taxes
- −$620
- − Insurance
- −$600
- − Repairs & maintenance
- −$1,237
- − Management
- −$1,237
- − Depreciation
- −$3,488
- Taxable income
- $1,569
- Est. tax owed @ 24.0%
- −$376
- After-tax cash flow
- $3,078/yr
For passive investors: Depreciation is non-cash, so a rental often shows a tax loss while cash-flowing — sheltering income. Rental losses are passive: they offset passive income freely, and up to $25,000/yr can offset ordinary (W-2) income if you actively participate and your MAGI is under $100k (phasing out to $0 by $150k); unused losses carry forward. On sale, claimed depreciation is recaptured at up to 25%, and gains may owe capital-gains tax (a 1031 exchange can defer both). Figures are a year-1 estimate at your 24.0% rate — not tax advice; consult a CPA.
Schools (NCES district)
- District
- Lynchburg City Public School District
- NCES district ID
- 5102340
- Math proficiency
- 36% ▼ -38.00%
- Reading proficiency
- 61% ▼ -8.00%
- Median HH income
- $39,097
- Composite
- 40.4/100
- National rank
- #3730
- State rank
- #104 of 131 in VA
Livability — Lynchburg
- Score
- 91/100
- State rank
- #1
- US rank
- #58
Category grades
Schools grade is shown separately in the Schools card above.
Census & demographics
- Census place
- Lynchburg, VA
- County
- Lynchburg City · 97,036 people
- City population
- 97,036
- Metro
- Lynchburg, VA
- Population (ZIP)
- 41,979
- Household income
- $68,872
- Rent vs Own
- Severe rent burden
- 1774.0
Population outlook (Lynchburg County) Hauer SSP2
- Today (2025)
- 87,977 people
- By 2030
- 93,626 · +6.4%
- By 2040
- 106,145 · +20.7%
- By 2050
- 120,783 · +37.3%
- By 2075
- 162,249 · +84.4%
- By 2100
- 191,358 · +117.5%
Race, ethnicity, and origin ACS 2023
- Neighborhood character
- Predominantly White (68%)
- Race & ethnicity
- White 68% Black 19% Two or more races 6% Hispanic / Latino 6% Asian 2%
- Hispanic origin (detail)
- Mexican 2%
- Common ancestry
- Slovak 3% Italian 2% Lithuanian 2%
- Foreign-born
- 6% · Canada, South Korea, United Kingdom
- Languages at home
- 91% English-only · Spanish 4% Other Indo-European 1% Other Asian/Pacific 1%
Political lean MEDSL · Lynchburg
- 2024 margin
- Lean R (+7.9) · D 45.4% · R 53.3% · Other 1.3%
- 2008→2024 swing
- -3.9pp toward R · 2008: -4.0pp · 2024: -7.9pp
- All cycles
- 2024: R+7.9 2020: D+2.6 2016: R+9.0 2012: R+10.6 2008: R+4.0
Not yet ingested
- Civics
- —
Market trends
- HPI YoY
- ▼ -222.79%
- Current HPI
- 241.9041
- Rent YoY
- ▲ 5.11%
- Metro
- Lynchburg, VA
- State GDP YoY
- ▲ 2.40%
- F500 in state
- 50
Industry mix (Fortune 500 HQ in VA)
| Industry | F500 HQs | Revenue |
|---|---|---|
| Aerospace / Defense | 4 | $236B |
|
||
| Technology / Defense | 3 | $32B |
|
||
| Financial Services | 2 | $176B |
|
||
| Utilities | 2 | $27B |
|
||
| Insurance | 2 | $25B |
|
||
| Technology | 2 | $15B |
|
||
Price history
+654.1% since first listed10 events — show timeline
- 2026-04-27 Listed $119,900 LMLS
- 2025-11-25 Price Changed $95,000 LMLS
- 2025-10-30 Listed $99,900 LMLS
- 2022-08-24 Sold (MLS) $58,000 LMLS
- 2022-08-04 Pending — LMLS
- 2022-07-11 Relisted — LMLS
- 2022-07-08 Listed $64,900 LMLS
- 2022-05-18 Pending — LMLS
- 2022-05-14 Listed $64,900 LMLS
- 2006-01-05 Sold (Public Records) $15,900 Public Records
Property tax history
+11.2%/yrLatest (2025): $620 · +22.4% YoY. Source: county tax records.
Cash-flow waterfall
monthlySold comps — $/sqft
last 12 mo · ≤1 miLoading sold comps…