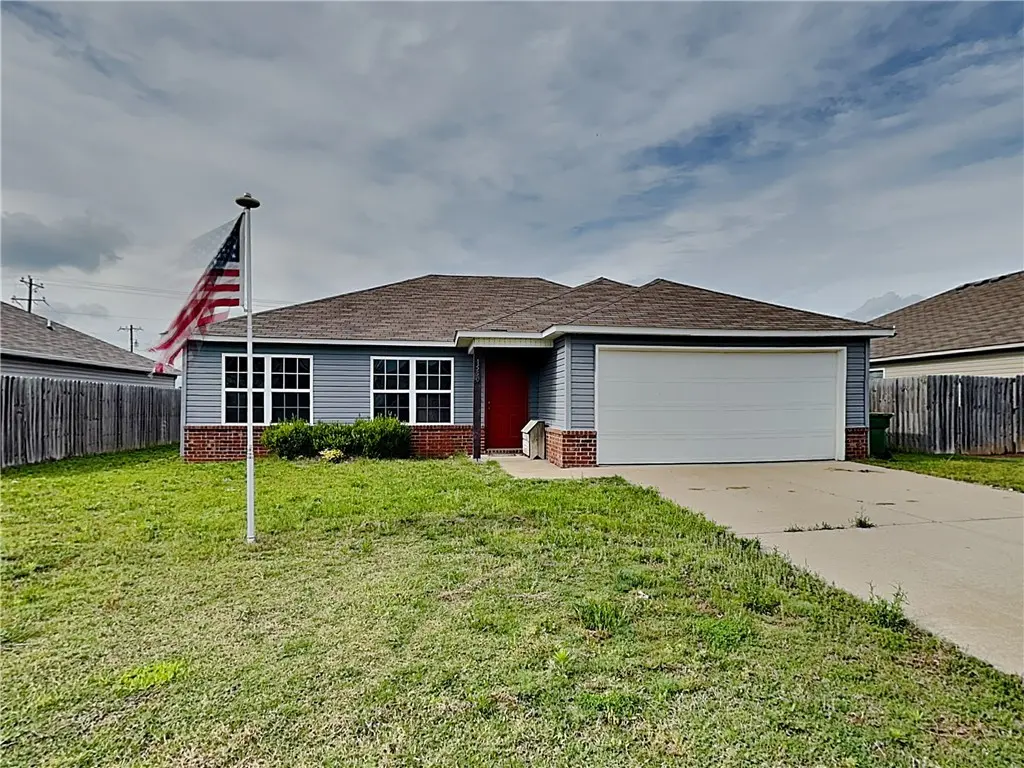
1550 Scotland Dr · Centerton, AR
Flood risk 1/10 · Minimal
- FEMA flood zone
- X (unshaded)
- Chance of flooding over 30 yrs
- 0.0%
- Est. flood insurance / yr
- $507 – $1,088
Fire risk 5/10 · Moderate
- Est. fire insurance / yr
- $1,499 – $2,785
Heat risk 5/10 · Moderate
- Hot days now (above 105°F)
- 7 days/yr
- Hot days in 30 yrs
- 20 days/yr
Wind risk 2/10 · Minimal
- Chance of severe wind over 30 yrs
- 2.0%
Air-quality risk 2/10 · Minimal
- Unhealthy air days now
- 0 days/yr
- Unhealthy air days in 30 yrs
- 1 days/yr
Risk factors via First Street. Map © Google.
Why this score? — see what drove the D grade
The composite is a weighted blend of 9 inputs, each scored 0–100. Each bar is that input's sub-score; the figure is the points it added to the 100-point composite (weight × sub-score).
- ARV discount +10.1/15.0
- Cash flow +8.7/30.0
- Schools +5.2/10.0
- Appreciation +4.6/10.0
- Livability +3.9/5.0
- Rent growth +2.7/5.0
- Condition / age +2.5/5.0
- DSCR +2.4/10.0
- 1% rule +1.8/10.0
$253,000
🖨 Deal sheet 📄 Offer letter ✓ Due diligence
Listing remarks MLS
Up to $5,000 towards Closing Costs with Preferred Lender. BRAND NEW, Just Finished! $0 Down eligible with RD loan. This "Fulton" Floorplan is a 3 Bed, 2 Bath. Inside this new single story home, you will find energy efficient Frigidaire appliances, Eat-In Kitchen, Maple Cabinets, and 2 Car Garage. Includes 2-10 Home Warranty, covering systems for 2 years, structural for 10 years, plus 1 Year Builder's Warranty.
Key facts
- Generous yard
- Split layout
- Full laundry room
Tags
Property features AI
Finance
- HOA & community: Annual association fee of $120 (association management included); Community features: curbs, near schools, shopping
Exterior
- Parking: Attached garage; 2 covered spaces
- Security: Fire alarm; Smoke detector(s)
- Utilities: Public water; Public sewer; Electricity available; High-speed internet available; Cable available
- Home design: Single-story home; Resale (less than 25 years old); Slab foundation
- Construction: Brick and vinyl siding; Architectural shingle roof
- Exterior features: Concrete driveway; Porch; Partial privacy wood fencing; Landscaped, cleared city lot in a subdivision; Paved, public/shared road frontage; Faces south
Interior
- Kitchen: Countertop appliances; Dishwasher; Electric range; Microwave; Range hood; Disposal; Plumbed for ice maker
- Flooring: Carpet; Vinyl
- Bathrooms: 2 full bathrooms
- Heating & cooling: Central electric heating (ENERGY STAR qualified equipment); Central air conditioning (ENERGY STAR qualified equipment)
- Interior features: Ceiling fan(s); Eat-in kitchen; Pantry; Split bedroom layout; Walk-in closet(s); Double-pane vinyl windows (ENERGY STAR qualified)
- Laundry & utility: Washer; Dryer; Electric water heater
Neighborhood map
What this means for you Summary
Snapshot
- This is a 3-bed/2.0-bath single-family listed at $253k.
Deal economics
- At list price, monthly cash flow is $-212 ($-3k/yr) — negative.
- To cash-flow at today's rent, offer at most $216k (14.8% below list).
- To meet the 1% rule (rent ≥ 1% of price), the offer needs to be $173k (31.8% below list).
- Recommended offer: $173k (31.8% below list) — sets the bar for 1% rule.
- Cap rate 5.3% vs local median 2.9% in Centerton — top-decile yield for the area; either an underpriced asset or a hidden risk that comps aren't pricing in. Stress-test before assuming the spread holds.
Location & tenants
- Location reads 77/100 on livability (#11 in AR, #3,194 nationally) — a middle-class / working-renter tenant base. Strengths: crime A+, employment A+, cost of living A+; Watch: amenities F, commute F.
- Bentonville School District (urban): math 59% / reading 59% proficiency, ranked #3 of 238 in AR (top 1%) — acceptable for families but not a draw, mixed tenant base, ~2y average lease.
- Market conditions: Rents flat; 458 active listings in the ZIP; 26 comparable units currently listed for rent nearby; rentals at typical pace (median 24d on market — plan ~3-4 weeks tenant-placement turnaround); high-income renter base; 4,359 units permitted in Benton County in 2024 (402 in 5+ unit buildings).
Forward outlook
- Local home prices are declining (-0.9%/yr); year-one equity from $2k of loan paydown is wiped out by about $2k of value loss. Plan a longer hold.
- Benton County population projected at +56% by 2050 — long-run rental-demand tailwind backs the buy-and-hold thesis.
Negotiation context
- It's been on market 21 days — a 2% lower offer ($249k) is reasonable based on typical stale-listing flexibility.
- 2 sale attempts since 8y ago with the ask held roughly flat each time — persistent listings suggest the price (not the market) is what's stuck; bring a comps-based counter.
- Current owner paid $144k; list at $253k implies a 75% gain — meaningful room to come down on a strong offer.
Risks & watch-outs
- Climate carrying-cost: moderate wildfire risk; extreme-heat days projected 7→20/yr by 2055 (HVAC capex compounding) — expect insurance premiums to compound above CPI over the hold.
Questions for the listing agent
- What do current leases actually rent for vs. the listed asking? Can we see a recent rent roll and the last 12 months of T-12 income?
- What does the HOA fee cover, when was the last increase, and are there any pending special assessments or reserve-fund shortfalls?
- Is there a deadline driving the sale (1031 exchange, divorce, estate, relocation)? That informs how much negotiation room exists.
- Schools are B-rated — typically a magnet for longer-tenancy family renters. What's the average tenant stay here, and is there a school-zone premium baked into asking?
- The area grade is low — what's the realistic commute time and amenity access for the typical tenant pool here? Any planned neighborhood developments (good or bad) we should know about?
- What's the average days-on-market for RENTAL listings here right now (not sales)? A rising rental-DOM trend means longer vacancies and softer asking-rent achievability than the comps imply.
- What's the recent tenant-quality profile in this submarket — average credit score on applications, eviction rate, late-payment / NSF rate, and stable-employment percentage? A property-management company in the area should have these aggregated.
- How much new for-sale + rental construction is in the pipeline within 1–3 miles? Heavy new supply typically softens prices + rents 12–24 months out; constrained supply supports both.
Investment metrics
- 1% rule
- 0.68% ✗
- Cap rate
- 5.29%
- Cash-on-cash
- -3.59%
- DSCR
- 0.84
- GRM
- 12.2
CMA / ARV
- ARV (on-the-fly)
- $268,686
- Comps found
- 12
Show comp detail 12 sales within ~0.75 mi
| Address | Dist | Beds/Ba | Sqft | Sold | Price | $/sf | Match |
|---|---|---|---|---|---|---|---|
| 1531 Scotland Dr | 0.04mi | 3/2.0 | 1,298 (0%) | 0mo | $264,500 | $204 | 98 |
| 1540 Scotland Dr | 0.01mi | 3/2.0 | 1,366 (+5%) | 1mo | $265,000 | $194 | 90 |
| 1721 Greenbank Dr | 0.40mi | 3/2.0 | 1,300 (+0%) | 3mo | $277,000 | $213 | 78 |
| 677 Olivia Ln | 0.32mi | 3/2.0 | 1,354 (+4%) | 2mo | $277,000 | $205 | 76 |
| 1221 Rosemary St | 0.29mi | 3/2.0 | 1,358 (+5%) | 6mo | $307,500 | $226 | 73 |
| 916 Zachary St | 0.61mi | 3/2.0 | 1,246 (-4%) | 0mo | $240,000 | $193 | 65 |
| 1005 Zachary St | 0.65mi | 3/2.0 | 1,302 (+0%) | 5mo | $273,000 | $210 | 65 |
| 688 Olivia Ln | 0.27mi | 3/2.0 | 1,484 (+14%) | 1mo | $310,000 | $209 | 62 |
| 1110 Tulip St | 0.38mi | 3/2.0 | 1,460 (+12%) | 3mo | $310,000 | $212 | 59 |
| 1071 Bliss St | 0.63mi | 3/2.0 | 1,230 (-5%) | 6mo | $255,000 | $207 | 57 |
| 911 Belhaven Rd | 0.32mi | 3/2.0 | 1,480 (+14%) | 6mo | $286,000 | $193 | 57 |
| 551 Firewood Dr | 0.60mi | 3/2.0 | 1,444 (+11%) | 3mo | $280,000 | $194 | 50 |
Match score weights: distance 35% · size 25% · config 20% · recency 20%. Top-matched comps best support the ARV.
Projected returns pro-forma
-0.87% appreciation · 0.64% rent growth · sell at horizon
- IRR
- -11.6%
- Equity multiple
- 0.50×
- Total profit
- $-35,150
- Equity at exit
- $62,653
- IRR
- -6.7%
- Equity multiple
- 0.41×
- Total profit
- $-41,840
- Equity at exit
- $67,147
Cash invested: $70,840 (down + closing). Projections, not guarantees.
Landlord ↔ Tenant lean methodology
- Overall (STATE)
- 92 Strongly Landlord-Friendly
- State Arkansas
- 92 Strongly Landlord-Friendly · R+14
- County
- — inherits STATE
- City
- — inherits STATE
ZIP-level market 72719
- Home prices YoY
- -0.3%
- Rents YoY
- 0.6%
- Active inventory
- 458
- Price-to-rent
- 12.2×
Monthly cashflow live
- Estimated rent
- $1,726 high interval (Pro) →
- Mortgage (P&I)
- −$1,327
- Tax from tax record
- −$133 /mo · $1,596/yr
- Insurance
- −$105
- HOA
- −$10
- Vacancy / Maint / Mgmt
- −$362
- Net cashflow
- $-212
Break-even live
UW: 25.0% down · 7.5% · 30yr · 1.5% tax · 5.0% vac · 8.0% maint · 8.0% mgmt
Financing live
Cash to close
- Down payment
- $63,250
- Closing costs
- $7,590
- Reserves months
- —
- Total cash needed
- —
Loan-product check · same deal, 3 products live
Conventional
25% down · 7.5% · 30yr
- Down + closing
- —
- Monthly P&I
- —
- Monthly cashflow
- —
- DSCR
- —
- Eligible?
- —
Personal DTI + credit; lowest rate.
DSCR
20% down · 8.5% · 30yr
- Down + closing
- —
- Monthly P&I
- —
- Monthly cashflow
- —
- DSCR
- —
- Eligible?
- —
No personal income docs; deal must DSCR.
Hard money
10% down · 12.0% · 12mo
- Down + closing
- —
- Monthly P&I
- —
- Monthly cashflow
- —
- DSCR
- —
- Eligible?
- —
Short-term bridge; refi at stabilization.
Rent comps 26 comps
| Address | Beds | Baths | Sqft | Rent | $/sqft | DOM | Units | Dist |
|---|---|---|---|---|---|---|---|---|
| 901 Belhaven Rd Centerton, AR | 3.0 | 2.0 | 1366 | $1,750 | $1.28 | 14d | 1 | 0.30mi |
| 1121 Monarch Rd Centerton, AR | 3.0 | 2.0 | 1565 | $1,800 | $1.15 | 23d | 1 | 0.45mi |
| 720 Appleridge Dr Centerton, AR | 2.0 | 2.0 | 1200 | $1,300 | $1.08 | 14d | 1 | 0.65mi |
| 901 Valley Oaks Ln Centerton, AR | 3.0 | 2.0 | 1455 | $1,595 | $1.10 | 23d | 1 | 0.66mi |
| 491 Azurite Rd Centerton, AR | 3.0 | 2.5 | 1420 | $1,650 | $1.16 | 14d | 1 | 0.69mi |
| 662 Appleridge Dr Centerton, AR | 2.0 | 2.0 | 1182 | $1,300 | $1.10 | 23d | 1 | 0.70mi |
| 451 Azurite Rd Centerton, AR | 3.0 | 2.5 | 1420 | $1,650 | $1.16 | 14d | 1 | 0.71mi |
| 650 Appleridge Dr Centerton, AR | 2.0 | 2.0 | 1156 | $1,300 | $1.12 | 23d | 1 | 0.71mi |
| 813 Valley Oaks Ln Centerton, AR | 3.0 | 2.0 | 1455 | $1,595 | $1.10 | 23d | 1 | 0.72mi |
| 712 Sun Meadows Loop Centerton, AR | 3.0 | 2.5 | 1601 | $1,995 | $1.25 | 23d | 1 | 0.75mi |
| 440 Spicewood Trl Centerton, AR | 3.0 | 2.0 | 1422 | $1,575 | $1.11 | 23d | 1 | 0.75mi |
| 700 Sun Meadows Loop Centerton, AR | 3.0 | 2.5 | 1601 | $2,000 | $1.25 | 14d | 1 | 0.76mi |
| 440 N Brookfield Dr Centerton, AR | 3.0 | 2.0 | 1279 | $1,495 | $1.17 | 21d | 1 | 0.78mi |
| 672 Sun Meadows Loop Centerton, AR | 3.0 | 2.5 | 1617 | $1,900 | $1.18 | 14d | 1 | 0.78mi |
| 717 Sun Meadows Loop Unit 717 Centerton, AR | 3.0 | 2.5 | 1600 | $1,750 | $1.09 | 23d | 1 | 0.78mi |
| 661 Sun Meadows Loop Centerton, AR | 3.0 | 2.5 | 1601 | $1,850 | $1.16 | 23d | 1 | 0.79mi |
| 1002 Applewood Cir Centerton, AR | 3.0 | 2.0 | 1464 | $1,750 | $1.20 | 23d | 1 | 0.83mi |
| 1389 W Centerton Blvd Centerton, AR | 1.0–3.0 | 1.0–2.5 | 980 | $1,500 | $1.53 | 14d | 16 | 1.02mi |
| 741 Harvest St Centerton, AR | 3.0 | 2.0 | 1811 | $1,750 | $0.97 | 23d | 1 | 1.03mi |
| 231 Graystone Cir Centerton, AR | 3.0 | 2.0 | 1128 | $1,225 | $1.09 | 21d | 1 | 1.12mi |
| 249 Graystone Cir Unit 251 Centerton, AR | 3.0 | 2.0 | 1128 | $1,225 | $1.09 | 23d | 1 | 1.16mi |
| 251 Graystone Cir Centerton, AR | 3.0 | 2.0 | 1300 | $1,225 | $0.94 | 23d | 1 | 1.17mi |
| 616 Sadie Ln Centerton, AR | 2.0 | 2.0 | 1000 | $1,000 | $1.00 | 23d | 1 | 1.28mi |
| 2031 Bluebonnet Ln Centerton, AR | 4.0 | 2.0 | 1586 | $1,850 | $1.17 | 14d | 1 | 1.38mi |
| 182 E 2nd St Centerton, AR | 3.0 | 2.0 | 1468 | $1,650 | $1.12 | 14d | 1 | 1.49mi |
| 2060 Periwinkle Pl Centerton, AR | 3.0 | 2.0 | 1741 | $1,990 | $1.14 | 14d | 1 | 1.50mi |
HOA detail
- Monthly dues
- $10 · $120/yr
Listing history 19 events
-
2026-06-18price $253,000 Active 21 DOM
-
2026-06-18days on market $258,500 Active 21 DOM
-
2026-06-17days on market $258,500 Active 20 DOM
-
2026-06-16days on market $258,500 Active 19 DOM
-
2026-06-15days on market $258,500 Active 18 DOM
-
2026-06-14days on market $258,500 Active 16 DOM
-
2026-06-10days on market $258,500 Active 13 DOM
-
2026-06-09days on market $258,500 Active 12 DOM
-
2026-06-08days on market $258,500 Active 11 DOM
-
2026-06-07days on market $258,500 Active 10 DOM
-
2026-06-05days on market $258,500 Active 7 DOM
-
2026-06-03days on market $258,500 Active 6 DOM
-
2026-06-02days on market $258,500 Active 5 DOM
-
2026-06-01days on market $258,500 Active 4 DOM
-
2026-05-31days on market $258,500 Active 3 DOM
-
2026-05-31days on market $258,500 Active 2 DOM
-
2026-05-28$258,500 Active
-
2018-12-17soldstatus $144,487 424-char remark
Show marketing remark (424 chars)
Up to $5,000 towards Closing Costs with Preferred Lender. BRAND NEW, Just Finished! $0 Down eligible with RD loan. This "Fulton" Floorplan is a 3 Bed, 2 Bath. Inside this new single story home, you will find energy efficient Frigidaire appliances, Eat-In Kitchen, Maple Cabinets, and 2 Car Garage. Includes 2-10 Home Warranty, covering systems for 2 years, structural for 10 years, plus 1 Year Builder's Warranty.
-
2018-06-21$144,487 424-char remark
Show marketing remark (424 chars)
Up to $5,000 towards Closing Costs with Preferred Lender. BRAND NEW, Just Finished! $0 Down eligible with RD loan. This "Fulton" Floorplan is a 3 Bed, 2 Bath. Inside this new single story home, you will find energy efficient Frigidaire appliances, Eat-In Kitchen, Maple Cabinets, and 2 Car Garage. Includes 2-10 Home Warranty, covering systems for 2 years, structural for 10 years, plus 1 Year Builder's Warranty.
ⓘ Source: listings_history table (triggers on properties + properties_extension) + one-shot
backfill from property_details.listing_events for pre-trigger history.
Tax reassessment forecast AR · Resets to sale price
- Current annual tax
- $1,596 · $133/mo
- Projected year-2 tax
- $1,619 · $135/mo
- Expected delta
- +$23/yr (+$2/mo · 1.4%)
ⓘ Screening estimate from a state-policy table — verify with the county assessor before closing.
Climate risk First Street
- Flood 1/10 Low FEMA zone X (unshaded) · 0% chance over 30 yrs
- Wildfire 5/10 Major
- Heat 5/10 Major 7 d/yr ≥105°F today · 20 d/yr by 30 yrs out
- Wind 2/10 Low 2% chance of damaging wind over 30 yrs
- Air quality 2/10 Low 0 unhealthy d/yr today · 1 by 30 yrs out
Nearby sold comps map
Loading sold comps map…
Walkable amenities ~0.75 mi
Loading nearby amenities…
Taxation est. · year 1
- Rental income
- $20,707
- − Mortgage interest
- −$14,172
- − Property taxes
- −$1,596
- − Insurance
- −$1,265
- − Repairs & maintenance
- −$1,657
- − Management
- −$1,657
- − HOA
- −$120
- − Depreciation
- −$7,360
- Taxable loss
- −$7,120
- Est. tax savings @ 24.0%
- +$1,709
- After-tax cash flow
- $-835/yr
For passive investors: Depreciation is non-cash, so a rental often shows a tax loss while cash-flowing — sheltering income. Rental losses are passive: they offset passive income freely, and up to $25,000/yr can offset ordinary (W-2) income if you actively participate and your MAGI is under $100k (phasing out to $0 by $150k); unused losses carry forward. On sale, claimed depreciation is recaptured at up to 25%, and gains may owe capital-gains tax (a 1031 exchange can defer both). Figures are a year-1 estimate at your 24.0% rate — not tax advice; consult a CPA.
Schools (NCES district)
- District
- Bentonville School District
- NCES district ID
- 0503060
- Math proficiency
- 59% ▼ -8.00%
- Reading proficiency
- 59% ▼ -6.00%
- Median HH income
- $66,721
- Composite
- 51.85/100
- National rank
- #1661
- State rank
- #3 of 238 in AR
Livability — Centerton
- Score
- 77/100
- State rank
- #11
- US rank
- #3194
Category grades
Schools grade is shown separately in the Schools card above.
Census & demographics
- Census place
- Centerton, AR
- County
- Benton County · 259,241 people
- City population
- 19,701
- Metro
- Fayetteville-Springdale-Rogers, AR
- Population (ZIP)
- 19,701
- Household income
- $113,542
- Rent vs Own
- Severe rent burden
- 374.0
Population outlook (Benton County) Hauer SSP2
- Today (2025)
- 318,683 people
- By 2030
- 353,481 · +10.9%
- By 2040
- 425,280 · +33.4%
- By 2050
- 497,239 · +56.0%
- By 2075
- 662,114 · +107.8%
- By 2100
- 776,431 · +143.6%
Race, ethnicity, and origin ACS 2023
- Neighborhood character
- Diverse neighborhood (Simpson 0.64)
- Race & ethnicity
- White 58% Two or more races 25% Hispanic / Latino 14% Black 6% Asian 5%
- Hispanic origin (detail)
- Mexican 8% Cuban 2%
- Common ancestry
- Slovak 2% Italian 1% Lithuanian 1%
- Foreign-born
- 10% · Canada, Vietnam
- Languages at home
- 89% English-only · Spanish 9% Vietnamese 1% Other Asian/Pacific 1%
Political lean MEDSL · Benton
- 2024 margin
- Strong R (+27.0) · D 35.2% · R 62.1% · Other 2.7%
- 2008→2024 swing
- +9.6pp toward D · 2008: -36.5pp · 2024: -27.0pp
- All cycles
- 2024: R+27.0 2020: R+26.4 2016: R+34.9 2012: R+40.4 2008: R+36.5
Not yet ingested
- Civics
- —
Market trends
- HPI YoY
- ▼ -0.87%
- Current HPI
- 320.376
- Rent YoY
- ▲ 0.64%
- Metro
- Fayetteville-Springdale-Rogers, AR
- State GDP YoY
- ▲ 3.80%
- F500 in state
- 10
Industry mix (Fortune 500 HQ in AR)
| Industry | F500 HQs | Revenue |
|---|---|---|
| Retail | 1 | $681B |
|
||
| Food / Agriculture | 1 | $53B |
|
||
| Retail / Energy | 1 | $22B |
|
||
| Transportation / Logistics | 1 | $12B |
|
||
| Energy | 1 | $4B |
|
||
Price history
+78.9% since first listed3 events — show timeline
- 2026-05-28 Listed $258,500 NWARMLS
- 2018-12-17 Sold (MLS) $144,487 NWARMLS
- 2018-06-21 Listed $144,487 NWARMLS
Property tax history
+2.1%/yrLatest (2025): $1,596 · +1.7% YoY. Source: county tax records.
Cash-flow waterfall
monthlySold comps — $/sqft
last 12 mo · ≤1 miLoading sold comps…