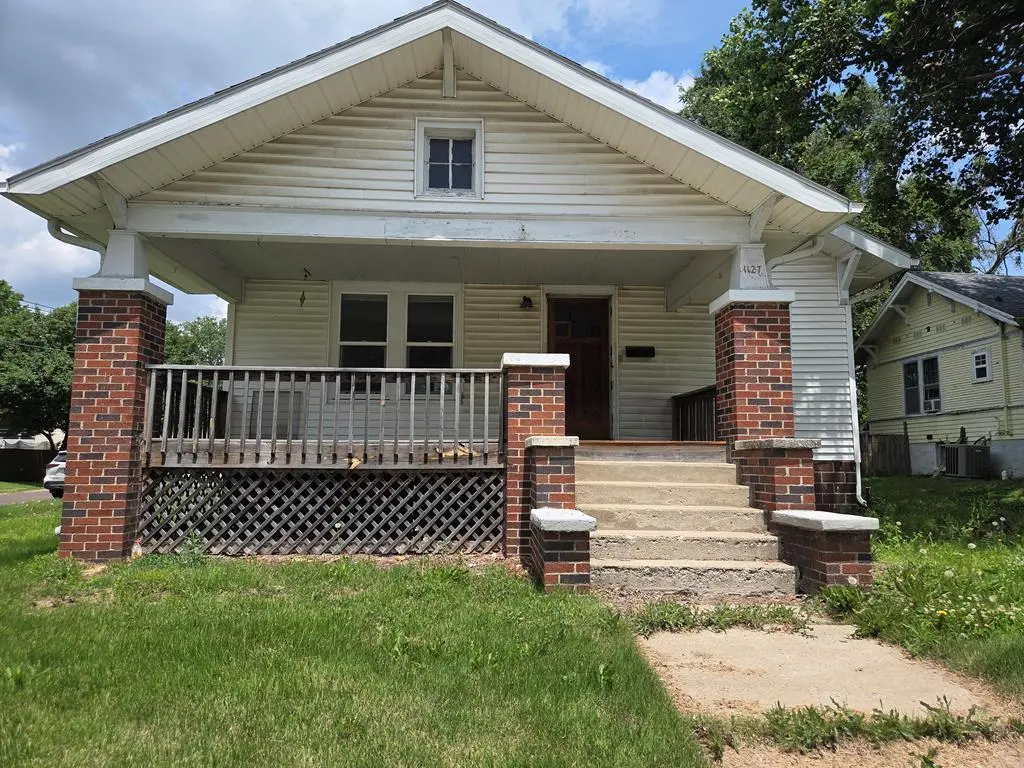
1127 Polk St · Chillicothe, MO
Flood risk 1/10 · Minimal
- FEMA flood zone
- X (unshaded)
- Chance of flooding over 30 yrs
- 0.0%
- Est. flood insurance / yr
- $507 – $1,088
Fire risk 1/10 · Minimal
- Est. fire insurance / yr
- $1,054 – $1,958
Heat risk 4/10 · Minor
- Hot days now (above 107°F)
- 7 days/yr
- Hot days in 30 yrs
- 15 days/yr
Wind risk 2/10 · Minimal
- Chance of severe wind over 30 yrs
- —
Air-quality risk 2/10 · Minimal
- Unhealthy air days now
- 0 days/yr
- Unhealthy air days in 30 yrs
- 1 days/yr
Risk factors via First Street. Map © Google.
Why this score? — see what drove the C- grade
The composite is a weighted blend of 9 inputs, each scored 0–100. Each bar is that input's sub-score; the figure is the points it added to the 100-point composite (weight × sub-score).
- Cash flow +16.2/30.0
- ARV discount +15.0/15.0
- DSCR +5.0/10.0
- Schools +4.1/10.0
- 1% rule +3.4/10.0
- Livability +3.4/5.0
- Rent growth +2.5/5.0
- Condition / age +2.5/5.0
- Appreciation +0.0/10.0
$119,000
🖨 Deal sheet (PDF) 📄 Offer letter ✓ Due diligence
Listing remarks MLS
This home was completely updated in 2012 to includes new roof, siding, porch, privacy fence, flooring, Sheetrock, cabinetry, counter tops, plumbing, ngfa, and central air.
Key facts
- 7,000 sq ft lot
- Garage
- Built 1930
Property features AI
Finance
- Other: Not in a flood plain; Lot approximately 7,000 sq ft (56 x 125)
- HOA & community: No association fees
Exterior
- Parking: Detached 1-car garage
- Utilities: Public water; Public sewer
- Home design: Single-family residence; Residential property; Bungalow style; 1,184 above-grade finished area
- Construction: Frame construction with vinyl siding; Other roof
- Exterior features: Deck; Porch; Paved road access
Interior
- Kitchen: Kitchen on the main level
- Bedrooms: 3 bedrooms on the main level
- Flooring: Laminate
- Bathrooms: 1 full bathroom on the main level
- Heating & cooling: Forced air heating; Electric cooling
- Interior features: Full, unfinished basement; Fireplace (1); Laminate flooring; Bungalow floor plan
Neighborhood map
What this means for you Summary
Snapshot
- This is a 3-bed/1.0-bath single-family listed at $119k.
Deal economics
- At list price, monthly cash flow is $63 ($751/yr) — positive.
- The deal already cash-flows at list — no discount required.
- To meet the 1% rule (rent ≥ 1% of price), the offer needs to be $100k (16.3% below list).
- Recommended offer: $100k (16.3% below list) — sets the bar for 1% rule.
- Cap rate 6.9% vs local median 4.8% in Chillicothe — top-decile yield for the area; either an underpriced asset or a hidden risk that comps aren't pricing in. Stress-test before assuming the spread holds.
Location & tenants
- Location reads 67/100 on livability (#225 in MO) — a middle-class / working-renter tenant base. Strengths: cost of living A+, housing A; Watch: employment D+, amenities F, commute F.
- Chillicothe R-II (town): math 49% / reading 48% proficiency, ranked #60 of 324 in MO (top 18%) — families likely to look elsewhere, expect single-tenant / working-renter base with shorter leases.
- Zoned schools: Chillicothe Elem (327 students, 52% FRL); Chillicothe Middle (math 31% / reading 35%, grade F, #265 of 391 statewide, top 69%, 371 students, 48% FRL); Chillicothe High (math 62% / reading 62%, grade B-, #28 of 521 statewide, top 6%, 609 students, 37% FRL) — zoned schools at 46% FRL track the district average.
- Market conditions: 71 active listings in the ZIP; 47 units permitted in Livingston County in 2024 (0 in 5+ unit buildings).
Forward outlook
- Local home prices are declining (-3.0%/yr); year-one equity from $823 of loan paydown is wiped out by about $4k of value loss. Plan a longer hold.
Negotiation context
- Only 12 days on market — expect competitive offers; lowballing is unlikely to land.
- 2 sale attempts since 12y ago with the ask held roughly flat each time — persistent listings suggest the price (not the market) is what's stuck; bring a comps-based counter.
Risks & watch-outs
- Watch-outs: built in 1930 — expect roof / HVAC / electrical / plumbing capex.
Questions for the listing agent
- Built in 1930 — when were the roof, HVAC, electrical panel, plumbing, and water heater last replaced?
- Is there a deadline driving the sale (1031 exchange, divorce, estate, relocation)? That informs how much negotiation room exists.
- What's the average days-on-market for RENTAL listings here right now (not sales)? A rising rental-DOM trend means longer vacancies and softer asking-rent achievability than the comps imply.
- What's the recent tenant-quality profile in this submarket — average credit score on applications, eviction rate, late-payment / NSF rate, and stable-employment percentage? A property-management company in the area should have these aggregated.
- How much new for-sale + rental construction is in the pipeline within 1–3 miles? Heavy new supply typically softens prices + rents 12–24 months out; constrained supply supports both.
Investment metrics
- 1% rule
- 0.84% ✗
- Cap rate
- 6.92%
- Cash-on-cash
- 2.25%
- DSCR
- 1.10
- GRM
- 10.0
CMA / ARV
- ARV (on-the-fly)
- $146,816
- Comps found
- 12
Show comp detail 12 sales within ~0.75 mi
| Address | Dist | Beds/Ba | Sqft | Sold | Price | $/sf | Match |
|---|---|---|---|---|---|---|---|
| 1521 Webster St | 0.29mi | 3/1.0 | 1,166 (-2%) | 1mo | $165,000 | $142 | 83 |
| 914 Cherry St | 0.15mi | 2/1.0 (-1) | 1,226 (+4%) | 4mo | $139,900 | $114 | 79 |
| 1409 Cooper St | 0.18mi | 2/1.0 (-1) | 1,150 (-3%) | 12mo | $119,000 | $103 | 72 |
| 904 Vine St | 0.39mi | 2/1.0 (-1) | 1,134 (-4%) | 6mo | $135,000 | $119 | 65 |
| 1309 Directory St | 0.41mi | 3/2.0 | 1,260 (+6%) | 2mo | $135,000 | $107 | 64 |
| 400 Calhoun St | 0.51mi | 3/1.0 | 1,162 (-2%) | 13mo | $155,000 | $133 | 62 |
| 714 Vine St | 0.42mi | 2/1.0 (-1) | 1,097 (-7%) | 5mo | $155,000 | $141 | 59 |
| 1116 Webster St | 0.21mi | 2/1.0 (-1) | 1,047 (-12%) | 9mo | $129,900 | $124 | 59 |
| 374 Woodrow St | 0.52mi | 2/1.0 (-1) | 1,100 (-7%) | 2mo | $125,000 | $114 | 57 |
| 406 Calhoun St | 0.50mi | 3/1.5 | 1,092 (-8%) | 6mo | $136,500 | $125 | 56 |
| 427 Mechanic St | 0.45mi | 2/2.0 (-1) | 1,056 (-11%) | 2mo | $169,900 | $161 | 50 |
| 209 Walnut St | 0.55mi | 3/1.0 | 1,348 (+14%) | 14mo | $100,000 | $74 | 40 |
Match score weights: distance 35% · size 25% · config 20% · recency 20%. Top-matched comps best support the ARV.
Projected returns pro-forma
-3.0% appreciation · 3.0% rent growth · sell at horizon
- IRR
- -12.8%
- Equity multiple
- 0.54×
- Total profit
- $-15,344
- Equity at exit
- $17,743
- IRR
- -3.8%
- Equity multiple
- 0.75×
- Total profit
- $-8,413
- Equity at exit
- $10,289
Cash invested: $33,320 (down + closing). Projections, not guarantees.
Landlord ↔ Tenant lean methodology
- Overall (STATE)
- 81 Strongly Landlord-Friendly
- State Missouri
- 81 Strongly Landlord-Friendly · R+10
- County
- — inherits STATE
- City
- — inherits STATE
ZIP-level market 64601
- Home prices YoY
- -15.3%
- Active inventory
- 71
- Price-to-rent
- 10.0×
Monthly cashflow live
- Estimated rent
- $997 medium interval (Pro) →
- Mortgage (P&I)
- −$624
- Tax from tax record
- −$51 /mo · $614/yr
- Insurance
- −$50
- HOA
- −$0
- Vacancy / Maint / Mgmt
- −$209
- Net cashflow
- $63
Break-even live
Sensitivity live
| Price | -10% $130 | -5% $96 | +0% $63 | +5% $29 | +10% $-5 |
|---|---|---|---|---|---|
| Rent | -10% $-16 | -5% $23 | +0% $63 | +5% $102 | +10% $141 |
| Rate | -1.0pp $122 | -0.5pp $93 | base $63 | +0.5pp $32 | +1.0pp $0 |
UW: 25.0% down · 7.5% · 30yr · 1.5% tax · 5.0% vac · 8.0% maint · 8.0% mgmt
Financing live
Cash to close
- Down payment
- $29,750
- Closing costs
- $3,570
- Reserves months
- —
- Total cash needed
- —
Loan-product check · same deal, 3 products live
Conventional
25% down · 7.5% · 30yr
- Down + closing
- —
- Monthly P&I
- —
- Monthly cashflow
- —
- DSCR
- —
- Eligible?
- —
Personal DTI + credit; lowest rate.
DSCR
20% down · 8.5% · 30yr
- Down + closing
- —
- Monthly P&I
- —
- Monthly cashflow
- —
- DSCR
- —
- Eligible?
- —
No personal income docs; deal must DSCR.
Hard money
10% down · 12.0% · 12mo
- Down + closing
- —
- Monthly P&I
- —
- Monthly cashflow
- —
- DSCR
- —
- Eligible?
- —
Short-term bridge; refi at stabilization.
Listing history 9 events
-
2026-06-22days on market $119,000 Active 12 DOM
-
2026-06-21days on market $119,000 Active 11 DOM
-
2026-06-21days on market $119,000 Active 10 DOM
-
2026-06-18days on market $119,000 Active 8 DOM
-
2026-06-17days on market $119,000 Active 7 DOM
-
2026-06-16days on market $119,000 Active 6 DOM
-
2026-06-15days on market $119,000 Active 5 DOM
-
2026-06-13days on market $119,000 Active 3 DOM
-
2026-06-12$119,000 Active 2 DOM
ⓘ Source: listings_history table (triggers on properties + properties_extension) + one-shot
backfill from property_details.listing_events for pre-trigger history.
Tax reassessment forecast MO · Resets to sale price
- Current annual tax
- $614 · $51/mo
- Projected year-2 tax
- $1,154 · $96/mo
- Expected delta
- +$541/yr (+$45/mo · 88.1%)
ⓘ Screening estimate from a state-policy table — verify with the county assessor before closing.
Climate risk First Street
- Flood 1/10 Low FEMA zone X (unshaded) · 0% chance over 30 yrs
- Wildfire 1/10 Low
- Heat 4/10 Moderate 7 d/yr ≥107°F today · 15 d/yr by 30 yrs out
- Wind 2/10 Low
- Air quality 2/10 Low 0 unhealthy d/yr today · 1 by 30 yrs out
Nearby sold comps map
Loading sold comps map…
Walkable amenities ~0.75 mi
Loading nearby amenities…
Taxation est. · year 1
- Rental income
- $11,959
- − Mortgage interest
- −$6,666
- − Property taxes
- −$614
- − Insurance
- −$595
- − Repairs & maintenance
- −$957
- − Management
- −$957
- − Depreciation
- −$3,462
- Taxable loss
- −$1,290
- Est. tax savings @ 24.0%
- +$310
- After-tax cash flow
- $1,060/yr
For passive investors: Depreciation is non-cash, so a rental often shows a tax loss while cash-flowing — sheltering income. Rental losses are passive: they offset passive income freely, and up to $25,000/yr can offset ordinary (W-2) income if you actively participate and your MAGI is under $100k (phasing out to $0 by $150k); unused losses carry forward. On sale, claimed depreciation is recaptured at up to 25%, and gains may owe capital-gains tax (a 1031 exchange can defer both). Figures are a year-1 estimate at your 24.0% rate — not tax advice; consult a CPA.
Schools (NCES district)
- District
- Chillicothe R-II
- NCES district ID
- 2908760
- Math proficiency
- 49% ▲ 4.00%
- Reading proficiency
- 48% ▲ 4.00%
- Median HH income
- $42,193
- Composite
- 40.81/100
- National rank
- #3637
- State rank
- #60 of 324 in MO
Livability — Chillicothe
- Score
- 67/100
- State rank
- #225
- US rank
- #10947
Category grades
Schools grade is shown separately in the Schools card above.
Census & demographics
- Census place
- Chillicothe, MO
- Population (ZIP)
- 12,110
Population outlook (Livingston County) Hauer SSP2
- Today (2025)
- 14,945 people
- By 2030
- 14,945 · +0.0%
- By 2040
- 15,010 · +0.4%
- By 2050
- 15,105 · +1.1%
- By 2075
- 15,950 · +6.7%
- By 2100
- 15,897 · +6.4%
Race, ethnicity, and origin ACS 2023
- Neighborhood character
- Predominantly White (91%)
- Race & ethnicity
- White 91% Two or more races 4% Black 3% Hispanic / Latino 2%
- Common ancestry
- Slovak 2% Italian 1% Romanian 1%
- Foreign-born
- 1% · Canada
Political lean MEDSL · Livingston
- 2024 margin
- Solid R (+57.8) · D 20.7% · R 78.5%
- 2008→2024 swing
- -34.0pp toward R · 2008: -23.8pp · 2024: -57.8pp
- All cycles
- 2024: R+57.8 2020: R+57.1 2016: R+56.4 2012: R+34.7 2008: R+23.8
Not yet ingested
- Civics
- —
Market trends
- HPI YoY
- ▼ -32.00%
- Current HPI
- 177.3092
- Rent YoY
- —
- Metro
- —
- State GDP YoY
- ▲ 1.84%
- F500 in state
- 20
Industry mix (Fortune 500 HQ in MO)
| Industry | F500 HQs | Revenue |
|---|---|---|
| Healthcare | 1 | $163B |
|
||
| Insurance | 1 | $21B |
|
||
| Industrial Technology | 1 | $17B |
|
||
| Retail | 1 | $16B |
|
||
| Industrial Distribution | 1 | $10B |
|
||
| Utilities | 1 | $9B |
|
||
Price history
+40.2% since first listed4 events — show timeline
- 2026-06-10 Listed $119,000 Heartland MLS as Distributed by MLS Grid
- 2015-01-05 Sold (Public Records) — Public Records
- 2015-01-02 Sold (MLS) — NECAR
- 2014-07-16 Listed $84,900 NECAR
Property tax history
+3.3%/yrLatest (2025): $614 · +0.5% YoY. Source: county tax records.
Cash-flow waterfall
monthlySold comps — $/sqft
last 12 mo · ≤1 miLoading sold comps…