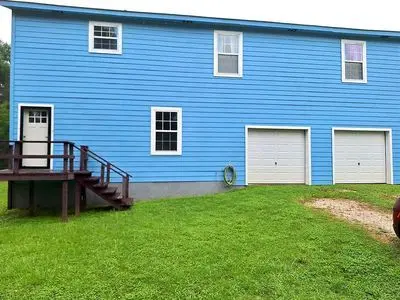
214 Ruth St · Palestine, TX
Flood risk 1/10 · Minimal
- FEMA flood zone
- X (unshaded)
- Chance of flooding over 30 yrs
- 0.0%
- Est. flood insurance / yr
- $507 – $1,088
Fire risk 4/10 · Minor
- Est. fire insurance / yr
- $1,222 – $2,270
Heat risk 7/10 · Major
- Hot days now (above 111°F)
- 7 days/yr
- Hot days in 30 yrs
- 26 days/yr
Wind risk 6/10 · Moderate
- Chance of severe wind over 30 yrs
- 77.0%
Air-quality risk 1/10 · Minimal
- Unhealthy air days now
- 0 days/yr
- Unhealthy air days in 30 yrs
- 0 days/yr
Risk factors via First Street. Map © Google.
Why this score? — see what drove the C- grade
The composite is a weighted blend of 9 inputs, each scored 0–100. Each bar is that input's sub-score; the figure is the points it added to the 100-point composite (weight × sub-score).
- Cash flow +20.6/30.0
- ARV discount +7.5/15.0
- 1% rule +6.8/10.0
- DSCR +6.5/10.0
- Livability +3.3/5.0
- Schools +3.0/10.0
- Rent growth +2.5/5.0
- Condition / age +2.5/5.0
- Appreciation +0.0/10.0
$157,000
🖨 Deal sheet 📄 Offer letter ✓ Due diligence
Listing remarks
INVESTORS - FLIPPERS - LANDLORDS You don & acirc; & euro; & trade; t want to miss this! ARV $240,000+ . 56 ACRES - 3 lots total - current land survey available. Some floors & amp; baseboards need finishing. Downstairs bathroom needs toilet & amp; vanity. (Vanity on-site) 4 out of 5 bedrooms have closets. Call or text today to schedule a walk-thru! This is priced as-is to go FAST 30 days or less close
Key facts
- 56 acres
- 3 lots
- Vanity on-site
Tags
Neighborhood map
What this means for you Summary
Snapshot
- This is a 5-bed/3.0-bath single-family listed at $157k.
Deal economics
- At list price, monthly cash flow is $209 ($3k/yr) — positive.
- The deal already cash-flows at list — no discount required.
- Meets the 1% rule at list price ($2k rent vs $157k).
- Cap rate 7.9% vs local median 3.9% in Palestine — top-decile yield for the area; either an underpriced asset or a hidden risk that comps aren't pricing in. Stress-test before assuming the spread holds.
Location & tenants
- Location reads 66/100 on livability (#657 in TX) — a middle-class / working-renter tenant base. Strengths: cost of living A+, housing A+; Watch: crime D+, schools D, employment D.
- Palestine ISD (town): math 36% / reading 37% proficiency, ranked #509 of 826 in TX (top 62%) — families likely to look elsewhere, expect single-tenant / working-renter base with shorter leases; 67% free/reduced lunch — lower-income household profile, screen leases tightly.
- Market conditions: 196 active listings in the ZIP; 29 units permitted in Anderson County in 2024 (0 in 5+ unit buildings).
- This rent runs 39% of the median local income ($57k/yr) — at the standard rent-burdened threshold; future hikes will face affordability resistance.
Forward outlook
- Local home prices are declining (-3.0%/yr); year-one equity from $1k of loan paydown is wiped out by about $5k of value loss. Plan a longer hold.
- Anderson County population projected at +4% by 2050 — modest demand growth; plan on rents tracking national, not racing it.
Negotiation context
- Only 10 days on market — expect competitive offers; lowballing is unlikely to land.
- 2 sale attempts with the ask held roughly flat each time — persistent listings suggest the price (not the market) is what's stuck; bring a comps-based counter.
Risks & watch-outs
- Watch-outs: property tax is 2.8% of price.
- Climate carrying-cost: major wind risk, 77% chance of damaging wind over 30y; extreme-heat days projected 7→26/yr by 2055 (HVAC capex compounding) — expect insurance premiums to compound above CPI over the hold.
Questions for the listing agent
- Property tax is high relative to price — has the assessment been appealed recently, and will the sale trigger a re-assessment?
- Is there a deadline driving the sale (1031 exchange, divorce, estate, relocation)? That informs how much negotiation room exists.
- Schools are D-rated, which usually means shorter tenancies and higher turnover. Who's the typical renter profile here, and what's been the actual vacancy rate?
- Crime grade is D in this area — have there been break-ins, vandalism, or insurance claims at this property in the last 3 years? What carrier currently insures it and at what premium?
- What's the average days-on-market for RENTAL listings here right now (not sales)? A rising rental-DOM trend means longer vacancies and softer asking-rent achievability than the comps imply.
- What's the recent tenant-quality profile in this submarket — average credit score on applications, eviction rate, late-payment / NSF rate, and stable-employment percentage? A property-management company in the area should have these aggregated.
- How much new for-sale + rental construction is in the pipeline within 1–3 miles? Heavy new supply typically softens prices + rents 12–24 months out; constrained supply supports both.
Investment metrics
- 1% rule
- 1.18% ✓
- Cap rate
- 7.89%
- Cash-on-cash
- 5.70%
- DSCR
- 1.25
- GRM
- 7.1
CMA / ARV
- ARV (on-the-fly)
- $336,600
- Comps found
- 2
Show comp detail 2 sales within ~0.75 mi
| Address | Dist | Beds/Ba | Sqft | Sold | Price | $/sf | Match |
|---|---|---|---|---|---|---|---|
| 1008 Woodland Dr | 0.57mi | 4/2.5 (-1) | 2,336 (+4%) | 3mo | $349,900 | $150 | 57 |
| 501 E Park Ave | 0.23mi | 4/2.0 (-1) | 2,478 (+10%) | 12mo | $119,000 | $48 | 53 |
Match score weights: distance 35% · size 25% · config 20% · recency 20%. Top-matched comps best support the ARV.
Projected returns pro-forma
-3.0% appreciation · 3.0% rent growth · sell at horizon
- IRR
- -7.4%
- Equity multiple
- 0.73×
- Total profit
- $-12,009
- Equity at exit
- $23,409
- IRR
- 2.3%
- Equity multiple
- 1.16×
- Total profit
- $7,204
- Equity at exit
- $13,574
Cash invested: $43,960 (down + closing). Projections, not guarantees.
Landlord ↔ Tenant lean methodology
- Overall (STATE)
- 87 Strongly Landlord-Friendly
- State Texas
- 87 Strongly Landlord-Friendly · R+5
- County
- — inherits STATE
- City
- — inherits STATE
ZIP-level market 75801
- Home prices YoY
- -35.0%
- Active inventory
- 196
- Price-to-rent
- 7.1×
Monthly cashflow live
- Estimated rent
- $1,851 medium interval (Pro) →
- Mortgage (P&I)
- −$823
- Tax from tax record
- −$365 /mo · $4,377/yr
- Insurance
- −$65
- HOA
- −$0
- Vacancy / Maint / Mgmt
- −$389
- Net cashflow
- $209
Break-even live
UW: 25.0% down · 7.5% · 30yr · 1.5% tax · 5.0% vac · 8.0% maint · 8.0% mgmt
Financing live
Cash to close
- Down payment
- $39,250
- Closing costs
- $4,710
- Reserves months
- —
- Total cash needed
- —
Loan-product check · same deal, 3 products live
Conventional
25% down · 7.5% · 30yr
- Down + closing
- —
- Monthly P&I
- —
- Monthly cashflow
- —
- DSCR
- —
- Eligible?
- —
Personal DTI + credit; lowest rate.
DSCR
20% down · 8.5% · 30yr
- Down + closing
- —
- Monthly P&I
- —
- Monthly cashflow
- —
- DSCR
- —
- Eligible?
- —
No personal income docs; deal must DSCR.
Hard money
10% down · 12.0% · 12mo
- Down + closing
- —
- Monthly P&I
- —
- Monthly cashflow
- —
- DSCR
- —
- Eligible?
- —
Short-term bridge; refi at stabilization.
Listing history 8 events
-
2026-06-16status $157,000 Under Contract 10 DOM
-
2026-06-15days on market $157,000 Active 10 DOM
-
2026-06-14days on market $157,000 Active 8 DOM
-
2026-06-12days on market $157,000 Active 7 DOM
-
2026-06-09days on market $157,000 Active 4 DOM
-
2026-06-08days on market $157,000 Active 3 DOM
-
2026-06-07remarks 406-char remark
-
2026-06-07$157,000 Active 2 DOM
ⓘ Source: listings_history table (triggers on properties + properties_extension) + one-shot
backfill from property_details.listing_events for pre-trigger history.
Tax reassessment forecast TX · Resets to sale price
- Current annual tax
- $4,377 · $365/mo
- Projected year-2 tax
- $4,377 · $365/mo
- Expected delta
- $0/yr ($0/mo · 0.0%)
ⓘ Screening estimate from a state-policy table — verify with the county assessor before closing.
Climate risk First Street
- Flood 1/10 Low FEMA zone X (unshaded) · 0% chance over 30 yrs
- Wildfire 4/10 Moderate
- Heat 7/10 Severe 7 d/yr ≥111°F today · 26 d/yr by 30 yrs out
- Wind 6/10 Major 77% chance of damaging wind over 30 yrs
- Air quality 1/10 Low 0 unhealthy d/yr today · 0 by 30 yrs out
Nearby sold comps map
Loading sold comps map…
Walkable amenities ~0.75 mi
Loading nearby amenities…
Taxation est. · year 1
- Rental income
- $22,213
- − Mortgage interest
- −$8,794
- − Property taxes
- −$4,377
- − Insurance
- −$785
- − Repairs & maintenance
- −$1,777
- − Management
- −$1,777
- − Depreciation
- −$4,567
- Taxable income
- $135
- Est. tax owed @ 24.0%
- −$32
- After-tax cash flow
- $2,474/yr
For passive investors: Depreciation is non-cash, so a rental often shows a tax loss while cash-flowing — sheltering income. Rental losses are passive: they offset passive income freely, and up to $25,000/yr can offset ordinary (W-2) income if you actively participate and your MAGI is under $100k (phasing out to $0 by $150k); unused losses carry forward. On sale, claimed depreciation is recaptured at up to 25%, and gains may owe capital-gains tax (a 1031 exchange can defer both). Figures are a year-1 estimate at your 24.0% rate — not tax advice; consult a CPA.
Schools (NCES district)
- District
- Palestine ISD
- NCES district ID
- 4834050
- Math proficiency
- 36% ▼ -12.00%
- Reading proficiency
- 37% ▼ -1.00%
- Median HH income
- $36,881
- Composite
- 30.34/100
- National rank
- #6267
- State rank
- #509 of 826 in TX
Livability — Palestine
- Score
- 66/100
- State rank
- #657
- US rank
- #12357
Category grades
Schools grade is shown separately in the Schools card above.
Census & demographics
- Census place
- Palestine, TX
- County
- Anderson County · 17,531 people
- City population
- 17,531
- Metro
- Palestine, TX
- Population (ZIP)
- 17,531
- Household income
- $56,787
- Rent vs Own
- Severe rent burden
- 609.0
Population outlook (Anderson County) Hauer SSP2
- Today (2025)
- 56,663 people
- By 2030
- 57,373 · +1.3%
- By 2040
- 58,960 · +4.1%
- By 2050
- 59,073 · +4.3%
- By 2075
- 53,737 · -5.2%
- By 2100
- 42,516 · -25.0%
Race, ethnicity, and origin ACS 2023
- Neighborhood character
- Diverse neighborhood (Simpson 0.67)
- Race & ethnicity
- White 48% Black 27% Hispanic / Latino 17% Two or more races 15% Native American 3%
- Hispanic origin (detail)
- Mexican 12%
- Common ancestry
- Lithuanian 2% Iranian 1% Slovak 1%
- Foreign-born
- 8% · Canada
- Languages at home
- 85% English-only · Spanish 12%
Political lean MEDSL · Anderson
- 2024 margin
- Solid R (+61.8) · D 18.8% · R 80.6%
- 2008→2024 swing
- -18.3pp toward R · 2008: -43.5pp · 2024: -61.8pp
- All cycles
- 2024: R+61.8 2020: R+58.0 2016: R+58.1 2012: R+52.2 2008: R+43.5
Not yet ingested
- Civics
- —
Market trends
- HPI YoY
- ▼ -83.17%
- Current HPI
- 154.6138
- Rent YoY
- —
- Metro
- Palestine, TX
- State GDP YoY
- ▲ 3.95%
- F500 in state
- 110
Industry mix (Fortune 500 HQ in TX)
| Industry | F500 HQs | Revenue |
|---|---|---|
| Energy | 16 | $1,198B |
|
||
| Technology | 5 | $198B |
|
||
| Engineering / Construction | 4 | $72B |
|
||
| Energy Services | 3 | $60B |
|
||
| Utilities | 3 | $41B |
|
||
| Healthcare | 2 | $330B |
|
||
Price history
-27.6% since first listed6 events — show timeline
- 2026-06-06 Listed $157,000 FSBO.com
- 2026-04-16 Price Changed $179,000 PAOR
- 2026-04-14 Price Changed $194,900 PAOR
- 2026-04-02 Price Changed $199,000 PAOR
- 2026-03-14 Price Changed $209,000 PAOR
- 2026-02-24 Listed $217,000 PAOR
Property tax history
+55.2%/yrLatest (2025): $4,377 · +9.7% YoY. Source: county tax records.
Cash-flow waterfall
monthlySold comps — $/sqft
last 12 mo · ≤1 miLoading sold comps…