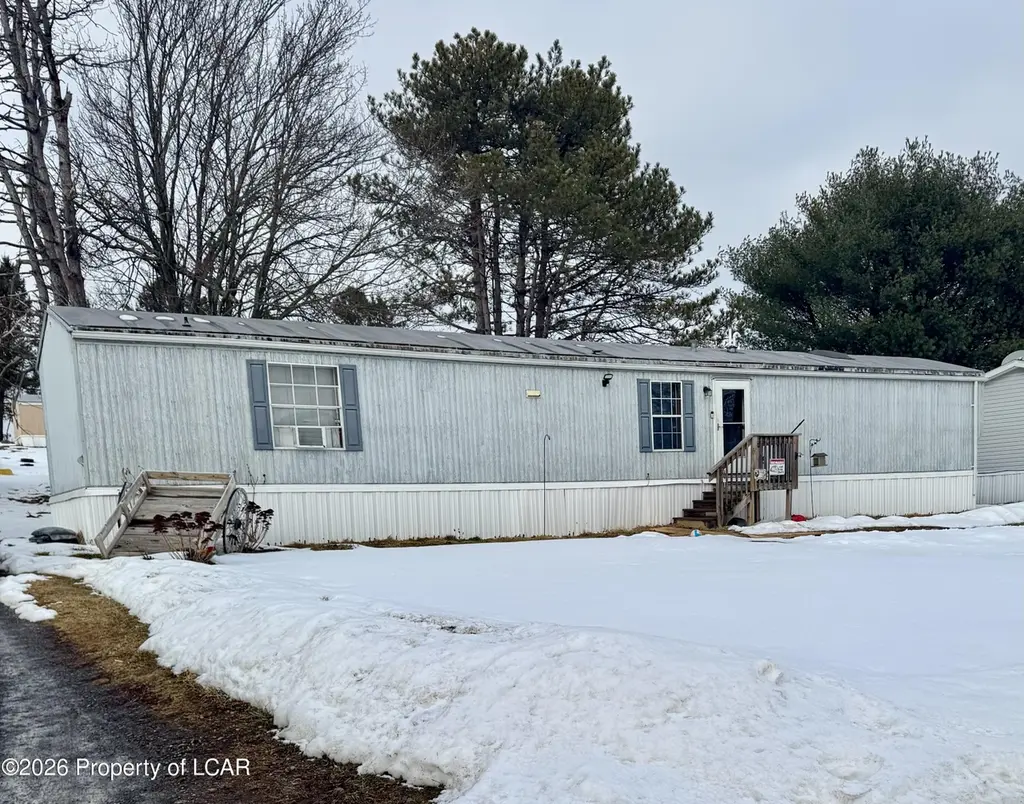
59 Zajac Ln · Berwick, PA
Flood risk 1/10 · Minimal
- FEMA flood zone
- X (unshaded)
- Chance of flooding over 30 yrs
- 0.0%
- Est. flood insurance / yr
- $473 – $860
Fire risk 1/10 · Minimal
- Est. fire insurance / yr
- $511 – $949
Heat risk 3/10 · Minor
- Hot days now (above 97°F)
- 7 days/yr
- Hot days in 30 yrs
- 15 days/yr
Wind risk 4/10 · Minor
- Chance of severe wind over 30 yrs
- 8.0%
Air-quality risk 2/10 · Minimal
- Unhealthy air days now
- 1 days/yr
- Unhealthy air days in 30 yrs
- 2 days/yr
Risk factors via First Street. Map © Google.
Why this score? — see what drove the C- grade
The composite is a weighted blend of 9 inputs, each scored 0–100. Each bar is that input's sub-score; the figure is the points it added to the 100-point composite (weight × sub-score).
- Cash flow +15.0/30.0
- ARV discount +7.5/15.0
- Appreciation +6.6/10.0
- Schools +5.6/10.0
- 1% rule +5.0/10.0
- DSCR +5.0/10.0
- Livability +3.8/5.0
- Rent growth +2.5/5.0
- Condition / age +2.5/5.0
$30,000
🖨 Deal sheet 📄 Offer letter ✓ Due diligence
Listing remarks MLS
Charming Mobile home located in quiet Mountain View Estates. Built in 2004, this mobile home consists of 3 bedrooms, 2 full baths, LR, Kitchen and Laundry Area, Gas propane heat, walk in closet, closet space, and shed. All Appliances included. Schedule an appointment today.
Key facts
- Shed
- Walk in closet
- Gas propane heat
Tags
Neighborhood map
What this means for you Summary
Snapshot
- This is a 3-bed/2.0-bath manufactured listed at $30k.
Deal economics
- At list price, monthly cash flow is $1k ($14k/yr) — positive.
- The deal already cash-flows at list — no discount required.
- Meets the 1% rule at list price ($2k rent vs $30k).
- Recommended offer: $27k (9.0% below list) — sets the bar for market timing.
- Cap rate 51.9% vs local median 5.4% in Berwick — top-decile yield for the area; either an underpriced asset or a hidden risk that comps aren't pricing in. Stress-test before assuming the spread holds.
Location & tenants
- Location reads 76/100 on livability (#412 in PA, #3,762 nationally) — a middle-class / working-renter tenant base. Strengths: crime A+, cost of living A+, housing A+; Watch: amenities F, commute F, employment F.
- Central Columbia SD (suburban): math 58% / reading 73% proficiency, ranked #51 of 539 in PA (top 10%) — acceptable for families but not a draw, mixed tenant base, ~2y average lease.
- Market conditions: 69 active listings in the ZIP; 82 units permitted in Columbia County in 2024 (0 in 5+ unit buildings).
Forward outlook
- In year one you build about $1k of equity ($207 loan paydown + $959 appreciation (3.2% local appreciation)).
- Columbia County population projected at -12% by 2050 — secular population decline; favor cash flow + early exit over multi-decade hold.
- At projected returns (3.2% appreciation + 3.0% rent growth), your $8k cash investment doubles in ~1 year — after that, you're playing with house money.
Negotiation context
- It's been on market 115 days — a 9% lower offer ($27k) is reasonable based on typical stale-listing flexibility.
Risks & watch-outs
- Watch-outs: property tax is 3.0% of price.
Questions for the listing agent
- It's been on market 115 days. Have you received any prior offers? Is the seller open to a 9% concession, seller financing, or rate buy-down credit?
- Property tax is high relative to price — has the assessment been appealed recently, and will the sale trigger a re-assessment?
- Why hasn't it sold? Are there any deal-killer items the seller is aware of (foundation, flood, title, zoning, code violations)?
- Is there a deadline driving the sale (1031 exchange, divorce, estate, relocation)? That informs how much negotiation room exists.
- Schools are B-rated — typically a magnet for longer-tenancy family renters. What's the average tenant stay here, and is there a school-zone premium baked into asking?
- What's the average days-on-market for RENTAL listings here right now (not sales)? A rising rental-DOM trend means longer vacancies and softer asking-rent achievability than the comps imply.
- What's the recent tenant-quality profile in this submarket — average credit score on applications, eviction rate, late-payment / NSF rate, and stable-employment percentage? A property-management company in the area should have these aggregated.
- How much new for-sale + rental construction is in the pipeline within 1–3 miles? Heavy new supply typically softens prices + rents 12–24 months out; constrained supply supports both.
Investment metrics
- 1% rule
- 5.84% ✓
- Cap rate
- 51.90%
- Cash-on-cash
- 162.90%
- DSCR
- 8.25
- GRM
- 1.4
CMA / ARV
- ARV (median comp)
- $119,837
- List price
- $30,000
- Delta
- -74.97%
- Verdict
- UNDERPRICED
- Comps
- 1 within 2.0 mi
Show comp detail 1 sale within ~0.75 mi
| Address | Dist | Beds/Ba | Sqft | Sold | Price | $/sf | Match |
|---|---|---|---|---|---|---|---|
| 25 Wolfe Rd | 0.71mi | 3/1.5 | 900 (-10%) | 6mo | $130,000 | $144 | 43 |
Match score weights: distance 35% · size 25% · config 20% · recency 20%. Top-matched comps best support the ARV.
Projected returns pro-forma
3.2% appreciation · 3.0% rent growth · sell at horizon
- IRR
- —
- Equity multiple
- 10.12×
- Total profit
- $76,603
- Equity at exit
- $13,825
- IRR
- —
- Equity multiple
- 21.31×
- Total profit
- $170,603
- Equity at exit
- $21,570
Cash invested: $8,400 (down + closing). Projections, not guarantees.
Landlord ↔ Tenant lean methodology
- Overall (STATE)
- 62 Landlord-Friendly
- State Pennsylvania
- 62 Landlord-Friendly · EVEN
- County
- — inherits STATE
- City
- — inherits STATE
ZIP-level market 18635
- Home prices YoY
- 1.3%
- Active inventory
- 69
- Price-to-rent
- 1.4×
Monthly cashflow live
- Estimated rent
- $1,753 medium interval (Pro) →
- Mortgage (P&I)
- −$157
- Tax from tax record
- −$75 /mo · $896/yr
- Insurance
- −$12
- HOA
- −$0
- Vacancy / Maint / Mgmt
- −$368
- Net cashflow
- $1,140
Break-even live
UW: 25.0% down · 7.5% · 30yr · 1.5% tax · 5.0% vac · 8.0% maint · 8.0% mgmt
Financing live
Cash to close
- Down payment
- $7,500
- Closing costs
- $900
- Reserves months
- —
- Total cash needed
- —
Loan-product check · same deal, 3 products live
Conventional
25% down · 7.5% · 30yr
- Down + closing
- —
- Monthly P&I
- —
- Monthly cashflow
- —
- DSCR
- —
- Eligible?
- —
Personal DTI + credit; lowest rate.
DSCR
20% down · 8.5% · 30yr
- Down + closing
- —
- Monthly P&I
- —
- Monthly cashflow
- —
- DSCR
- —
- Eligible?
- —
No personal income docs; deal must DSCR.
Hard money
10% down · 12.0% · 12mo
- Down + closing
- —
- Monthly P&I
- —
- Monthly cashflow
- —
- DSCR
- —
- Eligible?
- —
Short-term bridge; refi at stabilization.
Listing history 17 events
-
2026-06-19days on market $30,000 Active 115 DOM
-
2026-06-18days on market $30,000 Active 114 DOM
-
2026-06-17days on market $30,000 Active 113 DOM
-
2026-06-16days on market $30,000 Active 112 DOM
-
2026-06-15days on market $30,000 Active 111 DOM
-
2026-06-14days on market $30,000 Active 109 DOM
-
2026-06-12days on market $30,000 Active 108 DOM
-
2026-06-09days on market $30,000 Active 105 DOM
-
2026-06-08days on market $30,000 Active 104 DOM
-
2026-06-07days on market $30,000 Active 103 DOM
-
2026-06-03days on market $30,000 Active 99 DOM
-
2026-06-02days on market $30,000 Active 98 DOM
-
2026-06-01days on market $30,000 Active 97 DOM
-
2026-05-31days on market $30,000 Active 96 DOM
-
2026-05-30days on market $30,000 Active 95 DOM
-
2026-04-30price $30,000 274-char remark
Show marketing remark (274 chars)
Charming Mobile home located in quiet Mountain View Estates. Built in 2004, this mobile home consists of 3 bedrooms, 2 full baths, LR, Kitchen and Laundry Area, Gas propane heat, walk in closet, closet space, and shed. All Appliances included. Schedule an appointment today.
-
2026-02-20$33,000 Active 274-char remark
Show marketing remark (274 chars)
Charming Mobile home located in quiet Mountain View Estates. Built in 2004, this mobile home consists of 3 bedrooms, 2 full baths, LR, Kitchen and Laundry Area, Gas propane heat, walk in closet, closet space, and shed. All Appliances included. Schedule an appointment today.
ⓘ Source: listings_history table (triggers on properties + properties_extension) + one-shot
backfill from property_details.listing_events for pre-trigger history.
Tax reassessment forecast PA · Partial reset (capped growth)
- Current annual tax
- $896 · $75/mo
- Projected year-2 tax
- $896 · $75/mo
- Expected delta
- $0/yr ($0/mo · 0.0%)
ⓘ Screening estimate from a state-policy table — verify with the county assessor before closing.
Climate risk First Street
- Flood 1/10 Low FEMA zone X (unshaded) · 0% chance over 30 yrs
- Wildfire 1/10 Low
- Heat 3/10 Moderate 7 d/yr ≥97°F today · 15 d/yr by 30 yrs out
- Wind 4/10 Moderate 8% chance of damaging wind over 30 yrs
- Air quality 2/10 Low 1 unhealthy d/yr today · 2 by 30 yrs out
Nearby sold comps map
Loading sold comps map…
Walkable amenities ~0.75 mi
Loading nearby amenities…
Taxation est. · year 1
- Rental income
- $21,035
- − Mortgage interest
- −$1,680
- − Property taxes
- −$896
- − Insurance
- −$150
- − Repairs & maintenance
- −$1,683
- − Management
- −$1,683
- − Depreciation
- −$873
- Taxable income
- $14,070
- Est. tax owed @ 24.0%
- −$3,377
- After-tax cash flow
- $10,307/yr
For passive investors: Depreciation is non-cash, so a rental often shows a tax loss while cash-flowing — sheltering income. Rental losses are passive: they offset passive income freely, and up to $25,000/yr can offset ordinary (W-2) income if you actively participate and your MAGI is under $100k (phasing out to $0 by $150k); unused losses carry forward. On sale, claimed depreciation is recaptured at up to 25%, and gains may owe capital-gains tax (a 1031 exchange can defer both). Figures are a year-1 estimate at your 24.0% rate — not tax advice; consult a CPA.
Schools (NCES district)
- District
- Central Columbia SD
- NCES district ID
- 4205370
- Math proficiency
- 58% ▼ -7.00%
- Reading proficiency
- 73% ▼ -4.00%
- Median HH income
- $54,278
- Composite
- 55.99/100
- National rank
- #1195
- State rank
- #51 of 539 in PA
Livability — Berwick
- Score
- 76/100
- State rank
- #412
- US rank
- #3762
Category grades
Schools grade is shown separately in the Schools card above.
Census & demographics
- Population (ZIP)
- 3,640
Population outlook (Columbia County) Hauer SSP2
- Today (2025)
- 65,170 people
- By 2030
- 64,054 · -1.7%
- By 2040
- 61,131 · -6.2%
- By 2050
- 57,526 · -11.7%
- By 2075
- 50,259 · -22.9%
- By 2100
- 44,756 · -31.3%
Race, ethnicity, and origin ACS 2023
- Neighborhood character
- Predominantly White (96%)
- Race & ethnicity
- White 96% Two or more races 2% Hispanic / Latino 1%
- Common ancestry
- Romanian 8% Lithuanian 4% Iranian 3%
- Foreign-born
- 0%
- Languages at home
- 96% English-only · Spanish 3% Russian/Polish/Slavic 1%
Political lean MEDSL · Columbia
- 2024 margin
- Solid R (+31.0) · D 34.0% · R 65.0%
- 2008→2024 swing
- -26.6pp toward R · 2008: -4.5pp · 2024: -31.0pp
- All cycles
- 2024: R+31.0 2020: R+30.7 2016: R+32.8 2012: R+12.4 2008: R+4.5
Not yet ingested
- Civics
- —
Market trends
- HPI YoY
- ▲ 3.20%
- Current HPI
- 245.2539
- Rent YoY
- —
- Metro
- —
- State GDP YoY
- ▲ 1.68%
- F500 in state
- 34
Industry mix (Fortune 500 HQ in PA)
| Industry | F500 HQs | Revenue |
|---|---|---|
| Healthcare | 2 | $309B |
|
||
| Insurance | 2 | $27B |
|
||
| Telecommunications / Media | 1 | $124B |
|
||
| Industrial Distribution | 1 | $22B |
|
||
| Financial Services | 1 | $20B |
|
||
| Chemicals / Materials | 1 | $18B |
|
||
Price history
-9.1% since first listed2 events — show timeline
- 2026-04-30 Price Changed $30,000 LCAR
- 2026-02-20 Listed $33,000 LCAR
Property tax history
+4.1%/yrLatest (2026): $896 · +2.9% YoY. Source: county tax records.
Cash-flow waterfall
monthlySold comps — $/sqft
last 12 mo · ≤1 miLoading sold comps…