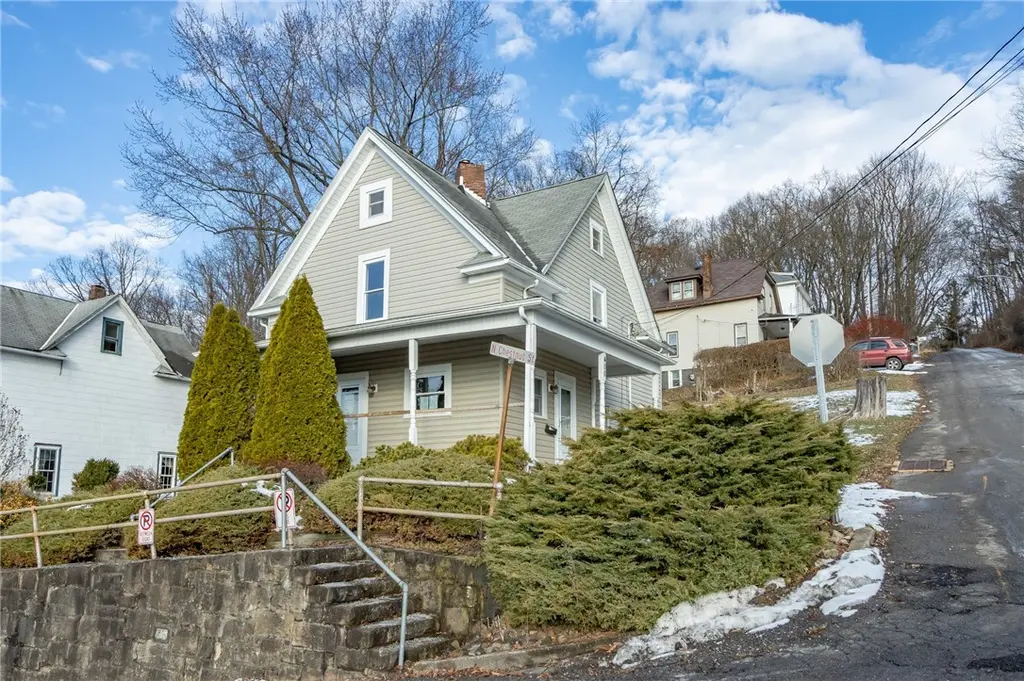
400 W Fulton St · Butler, PA
Flood risk 1/10 · Minimal
- FEMA flood zone
- X (unshaded)
- Chance of flooding over 30 yrs
- 0.0%
- Est. flood insurance / yr
- $473 – $860
Fire risk 1/10 · Minimal
- Est. fire insurance / yr
- $511 – $949
Heat risk 3/10 · Minor
- Hot days now (above 95°F)
- 7 days/yr
- Hot days in 30 yrs
- 16 days/yr
Wind risk 1/10 · Minimal
- Chance of severe wind over 30 yrs
- —
Air-quality risk 3/10 · Minor
- Unhealthy air days now
- 2 days/yr
- Unhealthy air days in 30 yrs
- 4 days/yr
Risk factors via First Street. Map © Google.
Why this score? — see what drove the B grade
The composite is a weighted blend of 9 inputs, each scored 0–100. Each bar is that input's sub-score; the figure is the points it added to the 100-point composite (weight × sub-score).
- Cash flow +27.5/30.0
- ARV discount +15.0/15.0
- DSCR +9.7/10.0
- 1% rule +7.4/10.0
- Rent growth +5.0/5.0
- Schools +4.3/10.0
- Livability +3.6/5.0
- Condition / age +2.5/5.0
- Appreciation +0.0/10.0
$84,000
🖨 Deal sheet 📄 Offer letter ✓ Due diligence
Listing remarks MLS
TOTALLY REDONE! BRAND NEW FURNACE SPRING 2019. FIRST FLOOR LAUNDRY, OFF STREET PARKING AND GREAT PORCH. NEWER PLUMBING, ELECTRICAL AND CARPETING. APPLIANCES AND HOME WARRANTY INCLUDED.
Key facts
- Wrap around porch
- Half bath
- Kitchen
Tags
Property features AI
Exterior
- Parking: On-street parking (1 space indicated)
- Utilities: Public water and sewer (implied); Electric service
- Home design: Two-story home; Resale property
- Construction: Vinyl siding; Asphalt roof
- Exterior features: Lot roughly 50 x 105; 0.12 acre lot
Interior
- Kitchen: Kitchen on main level approximately 16 x 10
- Bedrooms: Bedroom (upper) approximately 13 x 11; Bedroom (upper) approximately 14 x 12
- Flooring: Carpet; Vinyl
- Bathrooms: One full bathroom; One half bathroom
- Heating & cooling: Forced air heating (gas); Central electric air conditioning
- Interior features: Carpet and vinyl flooring; Unfinished basement with interior entry; Six total rooms
- Laundry & utility: Main-level laundry room
Neighborhood map
What this means for you Summary
Snapshot
- This is a 3-bed/1.0-bath single-family listed at $84k.
Deal economics
- At list price, monthly cash flow is $249 ($3k/yr) — positive.
- The deal already cash-flows at list — no discount required.
- Meets the 1% rule at list price ($1k rent vs $84k).
- Cap rate 9.8% vs local median 3.8% in Butler — top-decile yield for the area; either an underpriced asset or a hidden risk that comps aren't pricing in. Stress-test before assuming the spread holds.
Location & tenants
- Location reads 71/100 on livability (#705 in PA) — a middle-class / working-renter tenant base. Strengths: cost of living A+, health & safety A+, schools A-; Watch: crime D-, amenities F, commute F.
- Butler Area SD (town): math 41% / reading 59% proficiency, ranked #181 of 539 in PA (top 34%) — acceptable for families but not a draw, mixed tenant base, ~2y average lease.
- Market conditions: Rents rising fast (+20.4%/yr); 206 active listings in the ZIP; 8 comparable units currently listed for rent nearby; rentals at typical pace (median 21d on market — plan ~3-4 weeks tenant-placement turnaround); 987 units permitted in Butler County in 2024 (0 in 5+ unit buildings).
Forward outlook
- Local home prices are declining (-3.0%/yr); year-one equity from $581 of loan paydown is wiped out by about $3k of value loss. Plan a longer hold.
- Butler County population projected to shrink 5% by 2050 — rents likely to lag national; underwrite the cash flow, not the appreciation.
- At projected returns (-3.0% appreciation + 8.0% rent growth), your $24k cash investment doubles in ~7 years — after that, you're playing with house money.
Negotiation context
- Only 5 days on market — expect competitive offers; lowballing is unlikely to land.
- 12 sale attempts since 19y ago with the ask held roughly flat each time — persistent listings suggest the price (not the market) is what's stuck; bring a comps-based counter.
Risks & watch-outs
- Watch-outs: built in 1900 — expect roof / HVAC / electrical / plumbing capex.
Questions for the listing agent
- Built in 1900 — when were the roof, HVAC, electrical panel, plumbing, and water heater last replaced?
- Is there a deadline driving the sale (1031 exchange, divorce, estate, relocation)? That informs how much negotiation room exists.
- Schools are A-rated — typically a magnet for longer-tenancy family renters. What's the average tenant stay here, and is there a school-zone premium baked into asking?
- Crime grade is D in this area — have there been break-ins, vandalism, or insurance claims at this property in the last 3 years? What carrier currently insures it and at what premium?
- What's the average days-on-market for RENTAL listings here right now (not sales)? A rising rental-DOM trend means longer vacancies and softer asking-rent achievability than the comps imply.
- What's the recent tenant-quality profile in this submarket — average credit score on applications, eviction rate, late-payment / NSF rate, and stable-employment percentage? A property-management company in the area should have these aggregated.
- How much new for-sale + rental construction is in the pipeline within 1–3 miles? Heavy new supply typically softens prices + rents 12–24 months out; constrained supply supports both.
Investment metrics
- 1% rule
- 1.24% ✓
- Cap rate
- 9.85%
- Cash-on-cash
- 12.70%
- DSCR
- 1.57
- GRM
- 6.7
CMA / ARV
- ARV (on-the-fly)
- $145,200
- Comps found
- 12
Show comp detail 12 sales within ~0.75 mi
| Address | Dist | Beds/Ba | Sqft | Sold | Price | $/sf | Match |
|---|---|---|---|---|---|---|---|
| 223 E Fulton St | 0.45mi | 3/1.0 | 1,288 (-2%) | 8mo | $150,000 | $116 | 68 |
| 515 W Brady St | 0.33mi | 3/1.0 | 1,210 (-8%) | 4mo | $83,000 | $69 | 67 |
| 208 American Ave | 0.49mi | 4/1.5 (+1) | 1,274 (-4%) | 4mo | $170,000 | $133 | 60 |
| 526 Forcht St | 0.35mi | 3/1.0 | 1,160 (-12%) | 4mo | $35,000 | $30 | 60 |
| 421 W Diamond St | 0.64mi | 3/1.5 | 1,367 (+4%) | 3mo | $135,000 | $99 | 59 |
| 429 Mercer St | 0.42mi | 2/2.5 (-1) | 1,284 (-3%) | 7mo | $149,900 | $117 | 59 |
| 306 Hempfling St | 0.63mi | 3/1.0 | 1,240 (-6%) | 8mo | $110,300 | $89 | 54 |
| 217 American Ave | 0.53mi | 3/1.0 | 1,152 (-13%) | 0mo | $190,500 | $165 | 54 |
| 532 N Elm St | 0.58mi | 2/1.0 (-1) | 1,200 (-9%) | 0mo | $125,000 | $104 | 53 |
| 125 Germaine Rd | 0.63mi | 3/2.0 | 1,218 (-8%) | 2mo | $233,000 | $191 | 52 |
| 330 N Elm St | 0.59mi | 3/1.0 | 1,434 (+9%) | 8mo | $114,000 | $79 | 52 |
| 503 Miller Ave | 0.31mi | 4/2.0 (+1) | 1,500 (+14%) | 7mo | $165,000 | $110 | 48 |
Match score weights: distance 35% · size 25% · config 20% · recency 20%. Top-matched comps best support the ARV.
Projected returns pro-forma
-3.0% appreciation · 8.0% rent growth · sell at horizon
- IRR
- 8.0%
- Equity multiple
- 1.33×
- Total profit
- $7,772
- Equity at exit
- $12,525
- IRR
- 21.2%
- Equity multiple
- 3.23×
- Total profit
- $52,353
- Equity at exit
- $7,263
Cash invested: $23,520 (down + closing). Projections, not guarantees.
Landlord ↔ Tenant lean methodology
- Overall (STATE)
- 62 Landlord-Friendly
- State Pennsylvania
- 62 Landlord-Friendly · EVEN
- County
- — inherits STATE
- City
- — inherits STATE
ZIP-level market 16001
- Home prices YoY
- -31.7%
- Rents YoY
- 20.4%
- Active inventory
- 206
- Price-to-rent
- 6.7×
Monthly cashflow live
- Estimated rent
- $1,044 high interval (Pro) →
- Mortgage (P&I)
- −$441
- Tax from tax record
- −$101 /mo · $1,208/yr
- Insurance
- −$35
- HOA
- −$0
- Vacancy / Maint / Mgmt
- −$219
- Net cashflow
- $249
Break-even live
UW: 25.0% down · 7.5% · 30yr · 1.5% tax · 5.0% vac · 8.0% maint · 8.0% mgmt
Financing live
Cash to close
- Down payment
- $21,000
- Closing costs
- $2,520
- Reserves months
- —
- Total cash needed
- —
Loan-product check · same deal, 3 products live
Conventional
25% down · 7.5% · 30yr
- Down + closing
- —
- Monthly P&I
- —
- Monthly cashflow
- —
- DSCR
- —
- Eligible?
- —
Personal DTI + credit; lowest rate.
DSCR
20% down · 8.5% · 30yr
- Down + closing
- —
- Monthly P&I
- —
- Monthly cashflow
- —
- DSCR
- —
- Eligible?
- —
No personal income docs; deal must DSCR.
Hard money
10% down · 12.0% · 12mo
- Down + closing
- —
- Monthly P&I
- —
- Monthly cashflow
- —
- DSCR
- —
- Eligible?
- —
Short-term bridge; refi at stabilization.
Rent comps 8 comps
| Address | Beds | Baths | Sqft | Rent | $/sqft | DOM | Units | Dist |
|---|---|---|---|---|---|---|---|---|
| 529 Federal St Unit 2 Butler, PA | 2.0 | 1.0 | 900 | $850 | $0.94 | 43d | 1 | 0.21mi |
| 530 N Main St Butler, PA | 2.0 | 2.0 | 1052 | $1,088 | $1.03 | 1d | 2 | 0.29mi |
| 313 Wilson Ave Butler, PA | 3.0 | 1.0 | 894 | $1,005 | $1.12 | 16d | 1 | 0.29mi |
| 303 Wilson Ave Unit Wilson-313 Butler, PA | 3.0 | 1.0 | 894 | $1,005 | $1.12 | 16d | 1 | 0.31mi |
| 327 W Brady St Unit 2 Butler, PA | 2.0 | 1.0 | 900 | $850 | $0.94 | 21d | 1 | 0.33mi |
| 208 E Walnut St Butler, PA | 3.0 | 1.5 | 1297 | $1,050 | $0.81 | 23d | 1 | 0.48mi |
| 305 American Ave Butler, PA | 2.0 | 1.0 | 986 | $995 | $1.01 | 43d | 1 | 0.57mi |
| 415 Brown Ave Butler, PA | 3.0 | 2.5 | 1640 | $1,500 | $0.91 | 12d | 1 | 1.28mi |
Listing history 26 events
-
2026-05-18status Pending
-
2026-05-15historical Contingent
-
2026-05-13$84,000 Active
-
2026-02-06historical Contingent
-
2026-01-13$84,000 Active
-
2019-05-29soldstatus $89,000
-
2019-05-28status Under Contract 184-char remark
Show marketing remark (184 chars)
TOTALLY REDONE! BRAND NEW FURNACE SPRING 2019. FIRST FLOOR LAUNDRY, OFF STREET PARKING AND GREAT PORCH. NEWER PLUMBING, ELECTRICAL AND CARPETING. APPLIANCES AND HOME WARRANTY INCLUDED.
-
2019-05-24soldstatus $89,000 Sold 184-char remark
Show marketing remark (184 chars)
TOTALLY REDONE! BRAND NEW FURNACE SPRING 2019. FIRST FLOOR LAUNDRY, OFF STREET PARKING AND GREAT PORCH. NEWER PLUMBING, ELECTRICAL AND CARPETING. APPLIANCES AND HOME WARRANTY INCLUDED.
-
2019-05-02Contingent 184-char remark
Show marketing remark (184 chars)
TOTALLY REDONE! BRAND NEW FURNACE SPRING 2019. FIRST FLOOR LAUNDRY, OFF STREET PARKING AND GREAT PORCH. NEWER PLUMBING, ELECTRICAL AND CARPETING. APPLIANCES AND HOME WARRANTY INCLUDED.
-
2019-05-02$89,000 184-char remark
Show marketing remark (184 chars)
TOTALLY REDONE! BRAND NEW FURNACE SPRING 2019. FIRST FLOOR LAUNDRY, OFF STREET PARKING AND GREAT PORCH. NEWER PLUMBING, ELECTRICAL AND CARPETING. APPLIANCES AND HOME WARRANTY INCLUDED.
-
2019-04-30historical Expired
-
2018-07-27status Active
-
2018-07-16historical Contingent
-
2018-05-01$89,000 Active
-
2018-04-04historical Expired
-
2018-03-20status Active
-
2018-03-12historical Contingent
-
2017-04-05$89,000 Active
-
2017-03-27historical Expired
-
2016-03-28$92,000 Active
-
2016-03-23historical Expired
-
2016-03-09price $92,000
-
2015-04-10$95,000 Active
-
2014-03-25$99,900
-
2007-07-26soldstatus $32,000
-
2007-05-30$30,000
ⓘ Source: listings_history table (triggers on properties + properties_extension) + one-shot
backfill from property_details.listing_events for pre-trigger history.
Tax reassessment forecast PA · Partial reset (capped growth)
- Current annual tax
- $1,208 · $101/mo
- Projected year-2 tax
- $1,267 · $106/mo
- Expected delta
- +$60/yr (+$5/mo · 4.9%)
ⓘ Screening estimate from a state-policy table — verify with the county assessor before closing.
Climate risk First Street
- Flood 1/10 Low FEMA zone X (unshaded) · 0% chance over 30 yrs
- Wildfire 1/10 Low
- Heat 3/10 Moderate 7 d/yr ≥95°F today · 16 d/yr by 30 yrs out
- Wind 1/10 Low
- Air quality 3/10 Moderate 2 unhealthy d/yr today · 4 by 30 yrs out
Nearby sold comps map
Loading sold comps map…
Walkable amenities ~0.75 mi
Loading nearby amenities…
Taxation est. · year 1
- Rental income
- $12,532
- − Mortgage interest
- −$4,705
- − Property taxes
- −$1,208
- − Insurance
- −$420
- − Repairs & maintenance
- −$1,003
- − Management
- −$1,003
- − Depreciation
- −$2,444
- Taxable income
- $1,750
- Est. tax owed @ 24.0%
- −$420
- After-tax cash flow
- $2,567/yr
For passive investors: Depreciation is non-cash, so a rental often shows a tax loss while cash-flowing — sheltering income. Rental losses are passive: they offset passive income freely, and up to $25,000/yr can offset ordinary (W-2) income if you actively participate and your MAGI is under $100k (phasing out to $0 by $150k); unused losses carry forward. On sale, claimed depreciation is recaptured at up to 25%, and gains may owe capital-gains tax (a 1031 exchange can defer both). Figures are a year-1 estimate at your 24.0% rate — not tax advice; consult a CPA.
Schools (NCES district)
- District
- Butler Area SD
- NCES district ID
- 4204590
- Math proficiency
- 41% ▼ -11.00%
- Reading proficiency
- 59% ▼ -10.00%
- Median HH income
- $49,348
- Composite
- 42.65/100
- National rank
- #3180
- State rank
- #181 of 539 in PA
Livability — Butler
- Score
- 71/100
- State rank
- #705
- US rank
- #6951
Category grades
Schools grade is shown separately in the Schools card above.
Census & demographics
- Census place
- Butler, PA
- County
- Butler County · 73,107 people
- City population
- 39,234
- Metro
- Pittsburgh, PA
- Population (ZIP)
- 39,234
- Household income
- $63,635
- Rent vs Own
- Severe rent burden
- 1441.0
Population outlook (Butler County) Hauer SSP2
- Today (2025)
- 190,777 people
- By 2030
- 191,476 · +0.4%
- By 2040
- 189,474 · -0.7%
- By 2050
- 182,050 · -4.6%
- By 2075
- 159,526 · -16.4%
- By 2100
- 129,028 · -32.4%
Race, ethnicity, and origin ACS 2023
- Neighborhood character
- Predominantly White (92%)
- Race & ethnicity
- White 92% Two or more races 4% Hispanic / Latino 2% Black 1%
- Common ancestry
- Romanian 8% Serbian 4% Slovak 2%
- Foreign-born
- 1% · Canada
- Languages at home
- 98% English-only · Spanish 1%
Political lean MEDSL · Butler
- 2024 margin
- Solid R (+32.2) · D 33.5% · R 65.7%
- 2008→2024 swing
- -4.8pp toward R · 2008: -27.4pp · 2024: -32.2pp
- All cycles
- 2024: R+32.2 2020: R+32.5 2016: R+37.5 2012: R+34.9 2008: R+27.4
Not yet ingested
- Civics
- —
Market trends
- HPI YoY
- ▼ -103.40%
- Current HPI
- 222.4445
- Rent YoY
- ▲ 20.36%
- Metro
- Pittsburgh, PA
- State GDP YoY
- ▲ 1.68%
- F500 in state
- 34
Industry mix (Fortune 500 HQ in PA)
| Industry | F500 HQs | Revenue |
|---|---|---|
| Healthcare | 2 | $309B |
|
||
| Insurance | 2 | $27B |
|
||
| Telecommunications / Media | 1 | $124B |
|
||
| Industrial Distribution | 1 | $22B |
|
||
| Financial Services | 1 | $20B |
|
||
| Chemicals / Materials | 1 | $18B |
|
||
Price history
+180.0% since first listed26 events — show timeline
- 2026-05-18 Pending — West Penn MLS
- 2026-05-15 Contingent — West Penn MLS
- 2026-05-13 Listed $84,000 West Penn MLS
- 2026-02-06 Contingent — West Penn MLS
- 2026-01-13 Listed $84,000 West Penn MLS
- 2019-05-29 Sold (Public Records) $89,000 Public Records
- 2019-05-28 Pending — West Penn MLS
- 2019-05-24 Sold (MLS) $89,000 West Penn MLS
- 2019-05-02 Listed — West Penn MLS
- 2019-05-02 Listed $89,000 West Penn MLS
- 2019-04-30 Delisted — West Penn MLS
- 2018-07-27 Relisted — West Penn MLS
- 2018-07-16 Contingent — West Penn MLS
- 2018-05-01 Listed $89,000 West Penn MLS
- 2018-04-04 Delisted — West Penn MLS
- 2018-03-20 Relisted — West Penn MLS
- 2018-03-12 Contingent — West Penn MLS
- 2017-04-05 Listed $89,000 West Penn MLS
- 2017-03-27 Delisted — West Penn MLS
- 2016-03-28 Listed $92,000 West Penn MLS
- 2016-03-23 Delisted — West Penn MLS
- 2016-03-09 Price Changed $92,000 West Penn MLS
- 2015-04-10 Listed $95,000 West Penn MLS
- 2014-03-25 Listed $99,900 West Penn MLS
- 2007-07-26 Sold (MLS) $32,000 West Penn MLS
- 2007-05-30 Listed $30,000 West Penn MLS
Property tax history
+0.8%/yrLatest (2026): $1,208 · -6.3% YoY. Source: county tax records.
Cash-flow waterfall
monthlySold comps — $/sqft
last 12 mo · ≤1 miLoading sold comps…