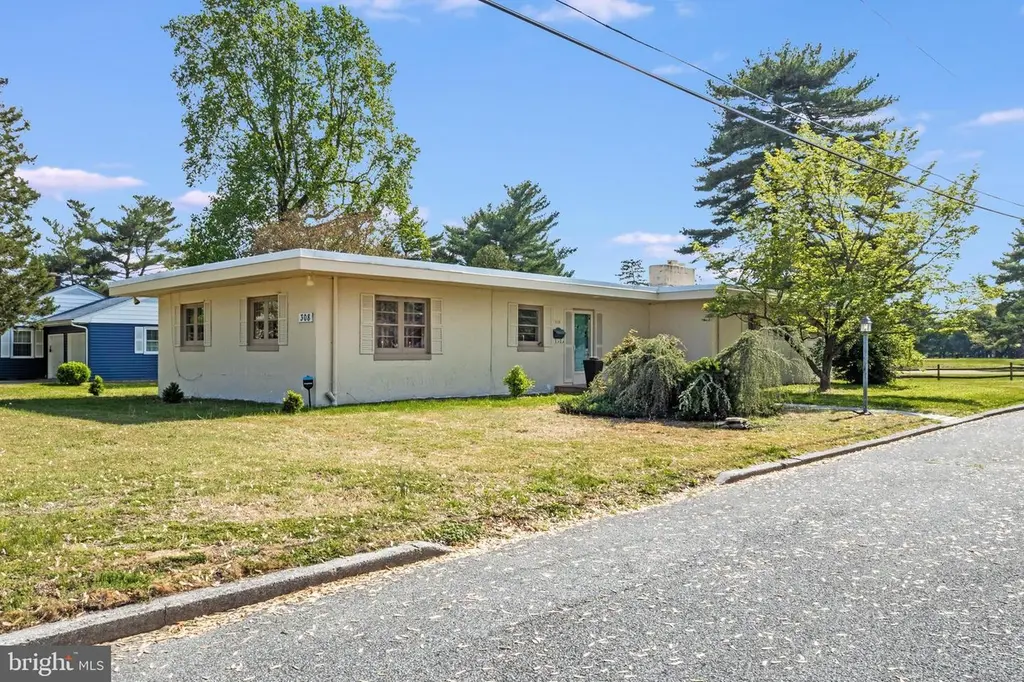
308 Nylon Blvd · Seaford, DE
Flood risk No data
- FEMA flood zone
- —
- Chance of flooding over 30 yrs
- —
- Est. flood insurance / yr
- —
Fire risk No data
- Est. fire insurance / yr
- —
Heat risk No data
- Hot days now (above threshold)
- —
- Hot days in 30 yrs
- —
Wind risk No data
- Chance of severe wind over 30 yrs
- —
Air-quality risk No data
- Unhealthy air days now
- —
- Unhealthy air days in 30 yrs
- —
Risk factors via First Street. Map © Google.
Why this score? — see what drove the D+ grade
The composite is a weighted blend of 9 inputs, each scored 0–100. Each bar is that input's sub-score; the figure is the points it added to the 100-point composite (weight × sub-score).
- ARV discount +15.0/15.0
- Cash flow +14.9/30.0
- DSCR +4.6/10.0
- Livability +3.2/5.0
- 1% rule +2.8/10.0
- Schools +2.8/10.0
- Rent growth +2.5/5.0
- Condition / age +2.5/5.0
- Appreciation +0.0/10.0
$275,000
🖨 Deal sheet (PDF) 📄 Offer letter ✓ Due diligence
Listing remarks
Beautifully maintained Mid-Century Modern home in Seaford, lovingly owned by one family and full of original charm. This 3-bedroom, 2.5-bath home features a main-level living room with fireplace, dining area, and a private primary suite with ensuite bath and walk-in shower, set apart from the additional bedrooms. A spacious versatile area offers endless possibilities for a den, game room, or entertaining space, complete with a half bath, wet bar, and sliders overlooking Hoopers Landing Golf Course. The partially finished walk-out basement includes laundry and added flexibility. Conveniently located near local shops, dining, and outdoor recreation, with easy access to the Nanticoke River and
Key facts
- Half bath
- Wet bar
- Ensuite bath
Tags
Property features AI
Finance
- Other: Additional parcel identified (Tax ID provided in records); Accessibility with 2+ access exits
Exterior
- Parking: On-street parking
- Utilities: Public water; Public sewer
- Home design: Detached property; Flat roof; Not in a federal flood zone; Fee simple ownership
- Construction: Stucco and block construction; Block foundation; Above-grade structures present; Approximately 2,300 sq ft finished above grade (estimated); Approximately 600 sq ft below grade (finished/unfinished areas noted)
- Exterior features: Sidewalks; Exterior lighting; Corner lot; Additional parcel included
Interior
- Kitchen: Oven/Range (Electric); Microwave; Dishwasher; Refrigerator; Additional refrigerator/freezer; Disposal
- Bedrooms: Three bedrooms on the main level
- Bathrooms: Two full bathrooms and one half bathroom on the main level
- Heating & cooling: Hot water heating with baseboard hot water radiators; Oil-fired heating; Central air conditioning; 200+ amp electric service with circuit breakers and fuses
- Interior features: Window treatments; Ceiling fans; Storm doors
- Laundry & utility: Washer/Dryer (dryer listed in appliances); Laundry located on the lower floor; Electric water heater
Neighborhood map
What this means for you Summary
Snapshot
- This is a 3-bed/2.0-bath single-family listed at $275k.
Deal economics
- At list price, monthly cash flow is $83 ($994/yr) — positive.
- The deal already cash-flows at list — no discount required.
- To meet the 1% rule (rent ≥ 1% of price), the offer needs to be $215k (21.8% below list).
- Recommended offer: $215k (21.8% below list) — sets the bar for 1% rule.
- Cap rate 6.7% vs local median 4.4% in Seaford — top-decile yield for the area; either an underpriced asset or a hidden risk that comps aren't pricing in. Stress-test before assuming the spread holds.
Location & tenants
- Location reads 64/100 on livability (#54 in DE) — a middle-class / working-renter tenant base. Strengths: cost of living A+, housing A+, health & safety A+; Watch: schools C-, employment D, crime F.
- Seaford School District (suburban): math 25% / reading 40% proficiency, ranked #15 of 26 in DE (top 58%) — families likely to look elsewhere, expect single-tenant / working-renter base with shorter leases; 65% free/reduced lunch — lower-income household profile, screen leases tightly.
- Market conditions: 216 active listings in the ZIP; 1 comparable units currently listed for rent nearby; 4,354 units permitted in Sussex County in 2024 (344 in 5+ unit buildings).
Forward outlook
- Local home prices are declining (-3.0%/yr); year-one equity from $2k of loan paydown is wiped out by about $8k of value loss. Plan a longer hold.
- Sussex County population projected at +25% by 2050 — long-run rental-demand tailwind backs the buy-and-hold thesis.
Negotiation context
- Only 5 days on market — expect competitive offers; lowballing is unlikely to land.
Risks & watch-outs
- Watch-outs: built in 1954 — expect roof / HVAC / electrical / plumbing capex.
Questions for the listing agent
- Built in 1954 — when were the roof, HVAC, electrical panel, plumbing, and water heater last replaced?
- Is there a deadline driving the sale (1031 exchange, divorce, estate, relocation)? That informs how much negotiation room exists.
- Crime grade is F in this area — have there been break-ins, vandalism, or insurance claims at this property in the last 3 years? What carrier currently insures it and at what premium?
- The area grade is low — what's the realistic commute time and amenity access for the typical tenant pool here? Any planned neighborhood developments (good or bad) we should know about?
- What's the average days-on-market for RENTAL listings here right now (not sales)? A rising rental-DOM trend means longer vacancies and softer asking-rent achievability than the comps imply.
- What's the recent tenant-quality profile in this submarket — average credit score on applications, eviction rate, late-payment / NSF rate, and stable-employment percentage? A property-management company in the area should have these aggregated.
- How much new for-sale + rental construction is in the pipeline within 1–3 miles? Heavy new supply typically softens prices + rents 12–24 months out; constrained supply supports both.
Investment metrics
- 1% rule
- 0.78% ✗
- Cap rate
- 6.65%
- Cash-on-cash
- 1.29%
- DSCR
- 1.06
- GRM
- 10.7
CMA / ARV
- ARV (on-the-fly)
- $384,800
- Comps found
- 5
Show comp detail 5 sales within ~0.75 mi
| Address | Dist | Beds/Ba | Sqft | Sold | Price | $/sf | Match |
|---|---|---|---|---|---|---|---|
| 35 Read St | 0.23mi | 4/3.5 (+1) | 2,500 (-4%) | 2mo | $377,500 | $151 | 71 |
| 38 Read St | 0.20mi | 4/3.0 (+1) | 2,420 (-7%) | 6mo | $405,000 | $167 | 65 |
| 104 Nylon Blvd | 0.30mi | 4/2.5 (+1) | 2,804 (+8%) | 8mo | $415,990 | $148 | 59 |
| 100 Nylon Blvd | 0.35mi | 4/2.5 (+1) | 2,818 (+8%) | 5mo | $399,990 | $142 | 59 |
| 94 Nylon Blvd | 0.31mi | 4/2.5 (+1) | 2,804 (+8%) | 11mo | $408,740 | $146 | 56 |
Match score weights: distance 35% · size 25% · config 20% · recency 20%. Top-matched comps best support the ARV.
Projected returns pro-forma
-3.0% appreciation · 3.0% rent growth · sell at horizon
- IRR
- -14.3%
- Equity multiple
- 0.49×
- Total profit
- $-39,431
- Equity at exit
- $41,003
- IRR
- -5.6%
- Equity multiple
- 0.63×
- Total profit
- $-28,125
- Equity at exit
- $23,777
Cash invested: $77,000 (down + closing). Projections, not guarantees.
Landlord ↔ Tenant lean methodology
- Overall (STATE)
- 70 Landlord-Friendly
- State Delaware
- 70 Landlord-Friendly · D+7
- County
- — inherits STATE
- City
- — inherits STATE
ZIP-level market 19973
- Home prices YoY
- -17.8%
- Active inventory
- 216
- Price-to-rent
- 10.7×
Monthly cashflow live
- Estimated rent
- $2,150 medium interval (Pro) →
- Mortgage (P&I)
- −$1,442
- Tax from tax record
- −$59 /mo · $708/yr
- Insurance
- −$115
- HOA
- −$0
- Vacancy / Maint / Mgmt
- −$452
- Net cashflow
- $83
Break-even live
Sensitivity live
| Price | -10% $238 | -5% $161 | +0% $83 | +5% $5 | +10% $-73 |
|---|---|---|---|---|---|
| Rent | -10% $-87 | -5% $-2 | +0% $83 | +5% $168 | +10% $253 |
| Rate | -1.0pp $221 | -0.5pp $153 | base $83 | +0.5pp $12 | +1.0pp $-61 |
UW: 25.0% down · 7.5% · 30yr · 1.5% tax · 5.0% vac · 8.0% maint · 8.0% mgmt
Financing live
Cash to close
- Down payment
- $68,750
- Closing costs
- $8,250
- Reserves months
- —
- Total cash needed
- —
Loan-product check · same deal, 3 products live
Conventional
25% down · 7.5% · 30yr
- Down + closing
- —
- Monthly P&I
- —
- Monthly cashflow
- —
- DSCR
- —
- Eligible?
- —
Personal DTI + credit; lowest rate.
DSCR
20% down · 8.5% · 30yr
- Down + closing
- —
- Monthly P&I
- —
- Monthly cashflow
- —
- DSCR
- —
- Eligible?
- —
No personal income docs; deal must DSCR.
Hard money
10% down · 12.0% · 12mo
- Down + closing
- —
- Monthly P&I
- —
- Monthly cashflow
- —
- DSCR
- —
- Eligible?
- —
Short-term bridge; refi at stabilization.
Rent comps 1 comps
| Address | Beds | Baths | Sqft | Rent | $/sqft | DOM | Units | Dist |
|---|---|---|---|---|---|---|---|---|
| 215 William Ross Ln Seaford, DE | 3.0 | 2.5 | 1850 | $2,150 | $1.16 | 44d | 1 | 1.07mi |
Listing history 2 events
-
2026-04-29status Pending
-
2026-04-24$275,000 Active
ⓘ Source: listings_history table (triggers on properties + properties_extension) + one-shot
backfill from property_details.listing_events for pre-trigger history.
Tax reassessment forecast DE · Partial reset (capped growth)
- Current annual tax
- $708 · $59/mo
- Projected year-2 tax
- $1,151 · $96/mo
- Expected delta
- +$444/yr (+$37/mo · 62.7%)
ⓘ Screening estimate from a state-policy table — verify with the county assessor before closing.
Nearby sold comps map
Loading sold comps map…
Walkable amenities ~0.75 mi
Loading nearby amenities…
Taxation est. · year 1
- Rental income
- $25,800
- − Mortgage interest
- −$15,404
- − Property taxes
- −$708
- − Insurance
- −$1,375
- − Repairs & maintenance
- −$2,064
- − Management
- −$2,064
- − Depreciation
- −$8,000
- Taxable loss
- −$3,815
- Est. tax savings @ 24.0%
- +$916
- After-tax cash flow
- $1,909/yr
For passive investors: Depreciation is non-cash, so a rental often shows a tax loss while cash-flowing — sheltering income. Rental losses are passive: they offset passive income freely, and up to $25,000/yr can offset ordinary (W-2) income if you actively participate and your MAGI is under $100k (phasing out to $0 by $150k); unused losses carry forward. On sale, claimed depreciation is recaptured at up to 25%, and gains may owe capital-gains tax (a 1031 exchange can defer both). Figures are a year-1 estimate at your 24.0% rate — not tax advice; consult a CPA.
Schools (NCES district)
- District
- Seaford School District
- NCES district ID
- 1001530
- Math proficiency
- 25% ▼ -18.00%
- Reading proficiency
- 40% ▼ -12.00%
- Median HH income
- $48,427
- Composite
- 28.07/100
- National rank
- #6835
- State rank
- #15 of 26 in DE
Livability — Seaford
- Score
- 64/100
- State rank
- #54
- US rank
- #14448
Category grades
Schools grade is shown separately in the Schools card above.
Census & demographics
- Census place
- Seaford, DE
- Population (ZIP)
- 25,786
Population outlook (Sussex County) Hauer SSP2
- Today (2025)
- 248,853 people
- By 2030
- 264,464 · +6.3%
- By 2040
- 290,980 · +16.9%
- By 2050
- 311,259 · +25.1%
- By 2075
- 352,488 · +41.6%
- By 2100
- 367,406 · +47.6%
Race, ethnicity, and origin ACS 2023
- Neighborhood character
- Diverse neighborhood (Simpson 0.61)
- Race & ethnicity
- White 58% Black 20% Two or more races 13% Hispanic / Latino 11%
- Hispanic origin (detail)
- Mexican 5% Puerto Rican 1% Dominican 2%
- Common ancestry
- Hispanic 4% Romanian 3% Italian 2%
- Foreign-born
- 9% · Canada, Vietnam
- Languages at home
- 85% English-only · Spanish 8% French/Haitian/Cajun 5% Vietnamese 1%
Political lean MEDSL · Sussex
- 2024 margin
- R (+11.0) · D 43.9% · R 54.9% · Other 1.2%
- 2008→2024 swing
- -2.4pp toward R · 2008: -8.6pp · 2024: -11.0pp
- All cycles
- 2024: R+11.0 2020: R+11.2 2016: R+22.0 2012: R+13.0 2008: R+8.6
Not yet ingested
- Civics
- —
Market trends
- HPI YoY
- ▼ -62.40%
- Current HPI
- 288.5652
- Rent YoY
- —
- Metro
- —
- State GDP YoY
- —
- F500 in state
- 0
Price history
2 events — show timeline
- 2026-04-29 Pending — BRIGHT MLS
- 2026-04-24 Listed $275,000 BRIGHT MLS
Property tax history
+8.0%/yrLatest (2025): $708 · +83.8% YoY. Source: county tax records.
Cash-flow waterfall
monthlySold comps — $/sqft
last 12 mo · ≤1 miLoading sold comps…