 🏗️ New Construction
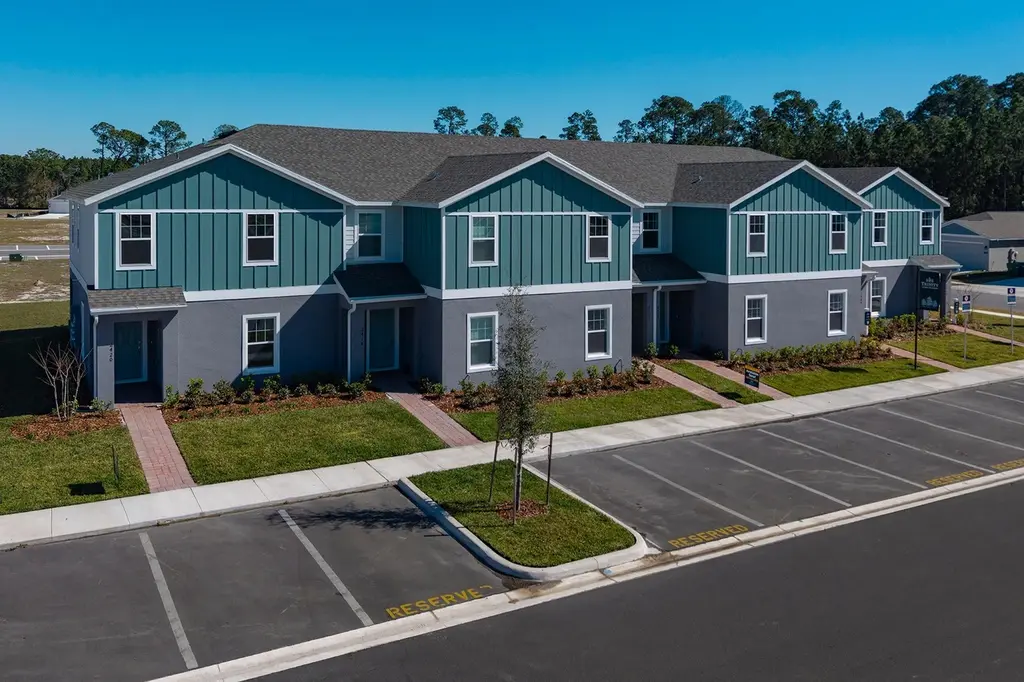
Ashley Plan · Eustis, FL
Flood risk No data
- FEMA flood zone
- —
- Chance of flooding over 30 yrs
- —
- Est. flood insurance / yr
- —
Fire risk No data
- Est. fire insurance / yr
- —
Heat risk No data
- Hot days now (above threshold)
- —
- Hot days in 30 yrs
- —
Wind risk No data
- Chance of severe wind over 30 yrs
- —
Air-quality risk No data
- Unhealthy air days now
- —
- Unhealthy air days in 30 yrs
- —
Risk factors via First Street. Map © Google.
Why this score? — see what drove the F grade
The composite is a weighted blend of 9 inputs, each scored 0–100. Each bar is that input's sub-score; the figure is the points it added to the 100-point composite (weight × sub-score).
- Cash flow +8.1/30.0
- ARV discount +7.5/15.0
- Schools +4.2/10.0
- Livability +3.7/5.0
- Rent growth +3.3/5.0
- 1% rule +2.5/10.0
- Condition / age +2.5/5.0
- DSCR +2.1/10.0
- Appreciation +0.0/10.0
$294,999
🖨 Deal sheet 📄 Offer letter ✓ Due diligence
Listing remarks
The Ashley townhome at Pine Meadows Reserve in Eustis, Florida showcases thoughtful design in a two-story floor plan with four bedrooms, three full baths, and 1,898 square feet of well-appointed living space built by Trinity Family Builders. An open-concept layout flows naturally through the kitchen, dining, and living areas, creating an inviting environment whether you're hosting gatherings or enjoying quiet family time. The primary suite on the upper level provides a private retreat with an ensuite bath, while three additional bedrooms offer flexibility for a growing family, guest accommodations, or a dedicated home office. Practical features including a second-floor laundry room, covered
Key facts
- Covered lanai
- Energy efficiency
- Private retreat
Tags
Property features AI
Finance
- Financial info: List price $294,997
Exterior
- Home design: New construction plan home; Address: 2011 Town Pasture Dr, Eustis FL 32726
- Exterior features: Living area approximately 1,898 (living area reported)
Interior
- Bedrooms: 4 bedrooms
- Bathrooms: 3 full bathrooms
- Heating & cooling: Heat pump heating; Central air conditioning
- Interior features: Plan name: Ashley; Active new construction plan
Neighborhood map
What this means for you Summary
Snapshot
- This is a 4-bed/3.0-bath single-family listed at $295k.
Deal economics
- At list price, monthly cash flow is $-329 ($-4k/yr) — negative.
- To cash-flow at today's rent, offer at most $290k (1.6% below list).
- To meet the 1% rule (rent ≥ 1% of price), the offer needs to be $254k (14.0% below list).
- Recommended offer: $254k (14.0% below list) — sets the bar for 1% rule.
Location & tenants
- Location reads 73/100 on livability (#309 in FL) — a middle-class / working-renter tenant base. Strengths: cost of living A+, housing A+, health & safety A; Watch: employment C-, schools D+, amenities F.
- Lake (suburban): math 49% / reading 50% proficiency, ranked #37 of 73 in FL (top 51%) — families likely to look elsewhere, expect single-tenant / working-renter base with shorter leases.
- Market conditions: Rents rising (+3.2%/yr); 305 active listings in the ZIP; 3 comparable units currently listed for rent nearby; rentals leasing fast (median 4d on market — plan ~1-2 weeks tenant-placement turnaround); 4,799 units permitted in Lake County in 2024 (814 in 5+ unit buildings).
- At $2,538/mo this rent would consume 48% of the median local household income ($63k/yr) (locally 584% of renters already pay >50% of income on rent) — very limited rent-growth headroom before tenants either downsize or default.
Forward outlook
- Local home prices are declining (-3.0%/yr); year-one equity from $2k of loan paydown is wiped out by about $10k of value loss. Plan a longer hold.
- Lake County population projected at +37% by 2050 — long-run rental-demand tailwind backs the buy-and-hold thesis.
Negotiation context
- Only 2 days on market — expect competitive offers; lowballing is unlikely to land.
Questions for the listing agent
- What do current leases actually rent for vs. the listed asking? Can we see a recent rent roll and the last 12 months of T-12 income?
- Is there a deadline driving the sale (1031 exchange, divorce, estate, relocation)? That informs how much negotiation room exists.
- Schools are D-rated, which usually means shorter tenancies and higher turnover. Who's the typical renter profile here, and what's been the actual vacancy rate?
- The area grade is low — what's the realistic commute time and amenity access for the typical tenant pool here? Any planned neighborhood developments (good or bad) we should know about?
- What's the average days-on-market for RENTAL listings here right now (not sales)? A rising rental-DOM trend means longer vacancies and softer asking-rent achievability than the comps imply.
- What's the recent tenant-quality profile in this submarket — average credit score on applications, eviction rate, late-payment / NSF rate, and stable-employment percentage? A property-management company in the area should have these aggregated.
- How much new for-sale + rental construction is in the pipeline within 1–3 miles? Heavy new supply typically softens prices + rents 12–24 months out; constrained supply supports both.
Investment metrics
- 1% rule
- 0.75% ✗
- Cap rate
- 5.12%
- Cash-on-cash
- -4.18%
- DSCR
- 0.81
- GRM
- 11.1
CMA / ARV
- ARV (on-the-fly)
- $337,844
- Comps found
- 12
Show comp detail 12 sales within ~0.75 mi
| Address | Dist | Beds/Ba | Sqft | Sold | Price | $/sf | Match |
|---|---|---|---|---|---|---|---|
| 2490 Hallow Garden Rd | 0.05mi | 4/2.5 | 1,880 (-1%) | 1mo | $351,278 | $187 | 93 |
| 1507 Willow Garden Loop | 0.10mi | 4/2.5 | 1,874 (-1%) | 2mo | $326,990 | $174 | 90 |
| 1455 Acorn Meadow Loop | 0.13mi | 4/2.5 | 1,874 (-1%) | 9mo | $346,440 | $185 | 82 |
| 1427 Acorn Meadow Loop | 0.16mi | 4/2.5 | 1,874 (-1%) | 11mo | $334,490 | $178 | 79 |
| 1409 Acorn Meadow Loop | 0.20mi | 4/2.5 | 1,874 (-1%) | 12mo | $339,990 | $181 | 77 |
| 2494 Hallow Garden Rd | 0.06mi | 5/2.5 (+1) | 2,112 (+11%) | 1mo | $336,990 | $160 | 70 |
| 1499 Willow Garden Loop | 0.10mi | 4/3.0 | 2,174 (+14%) | 4mo | $352,900 | $162 | 68 |
| 1439 Acorn Meadow Loop | 0.15mi | 5/2.5 (+1) | 2,112 (+11%) | 10mo | $355,640 | $168 | 59 |
| 1393 Acorn Meadow Loop | 0.18mi | 5/2.5 (+1) | 2,112 (+11%) | 11mo | $334,890 | $159 | 57 |
| 1014 Pine Tree Dr | 0.67mi | 3/2.0 (-1) | 1,827 (-4%) | 6mo | $339,900 | $186 | 49 |
| 1930 Pine Meadows Golfcourse Rd | 0.61mi | 4/3.0 | 2,174 (+14%) | 1mo | $345,900 | $159 | 46 |
| 37207 Oak Ln | 0.62mi | 3/3.0 (-1) | 2,060 (+8%) | 12mo | $375,000 | $182 | 42 |
Match score weights: distance 35% · size 25% · config 20% · recency 20%. Top-matched comps best support the ARV.
Projected returns pro-forma
-3.0% appreciation · 3.2% rent growth · sell at horizon
- IRR
- -23.1%
- Equity multiple
- 0.21×
- Total profit
- $-75,180
- Equity at exit
- $50,374
- IRR
- -17.1%
- Equity multiple
- 0.05×
- Total profit
- $-90,223
- Equity at exit
- $29,211
Cash invested: $94,596 (down + closing). Projections, not guarantees.
Landlord ↔ Tenant lean methodology
- Overall (STATE)
- 87 Strongly Landlord-Friendly
- State Florida
- 87 Strongly Landlord-Friendly · R+3
- County
- — inherits STATE
- City
- — inherits STATE
ZIP-level market 32726
- Home prices YoY
- -21.3%
- Rents YoY
- 3.2%
- Active inventory
- 305
- Price-to-rent
- 9.7×
Monthly cashflow live
- Estimated rent
- $2,538 medium interval (Pro) →
- Mortgage (P&I)
- −$1,772
- Tax est. 1.5%
- −$422 /mo · $5,068/yr
- Insurance
- −$141
- HOA
- −$0
- Vacancy / Maint / Mgmt
- −$533
- Net cashflow
- $-329
Break-even live
UW: 25.0% down · 7.5% · 30yr · 1.5% tax · 5.0% vac · 8.0% maint · 8.0% mgmt
Financing live
Cash to close
- Down payment
- $84,461
- Closing costs
- $10,135
- Reserves months
- —
- Total cash needed
- —
Loan-product check · same deal, 3 products live
Conventional
25% down · 7.5% · 30yr
- Down + closing
- —
- Monthly P&I
- —
- Monthly cashflow
- —
- DSCR
- —
- Eligible?
- —
Personal DTI + credit; lowest rate.
DSCR
20% down · 8.5% · 30yr
- Down + closing
- —
- Monthly P&I
- —
- Monthly cashflow
- —
- DSCR
- —
- Eligible?
- —
No personal income docs; deal must DSCR.
Hard money
10% down · 12.0% · 12mo
- Down + closing
- —
- Monthly P&I
- —
- Monthly cashflow
- —
- DSCR
- —
- Eligible?
- —
Short-term bridge; refi at stabilization.
Rent comps 3 comps
| Address | Beds | Baths | Sqft | Rent | $/sqft | DOM | Units | Dist |
|---|---|---|---|---|---|---|---|---|
| 2510 Hallow Garden Rd Eustis, FL | 4.0 | 2.5 | 1880 | $2,550 | $1.36 | 23d | 1 | 0.05mi |
| 2486 Hallow Garden Rd Eustis, FL | 3.0 | 2.0 | 1429 | $2,400 | $1.68 | 4d | 1 | 0.08mi |
| 1914 Pine Meadows Golf Course Rd Eustis, FL | 4.0 | 3.0 | 2174 | $2,600 | $1.20 | 4d | 1 | 0.61mi |
Listing history 13 events
-
2026-06-18days on market $294,999 Active 2 DOM
-
2026-06-17days on market $294,999 Active 1 DOM
-
2026-06-16days on market $294,999 Active 210 DOM
-
2026-06-15days on market $294,999 Active 209 DOM
-
2026-06-13days on market $294,999 Active 207 DOM
-
2026-06-09pricedays on market $294,999 Active 203 DOM
-
2026-06-08pricedays on market $289,999 Active 202 DOM
-
2026-06-07days on market $294,997 Active 201 DOM
-
2026-06-04days on market $294,997 Active 198 DOM
-
2026-06-03days on market $294,997 Active 197 DOM
-
2026-06-02days on market $294,997 Active 196 DOM
-
2026-06-02days on market $294,997 Active 195 DOM
-
2026-05-31days on market $294,997 Active 194 DOM
ⓘ Source: listings_history table (triggers on properties + properties_extension) + one-shot
backfill from property_details.listing_events for pre-trigger history.
Nearby sold comps map
Loading sold comps map…
Walkable amenities ~0.75 mi
Loading nearby amenities…
Taxation est. · year 1
- Rental income
- $30,460
- − Mortgage interest
- −$18,925
- − Property taxes
- −$5,068
- − Insurance
- −$1,689
- − Repairs & maintenance
- −$2,437
- − Management
- −$2,437
- − Depreciation
- −$9,828
- Taxable loss
- −$9,923
- Est. tax savings @ 24.0%
- +$2,382
- After-tax cash flow
- $-1,572/yr
For passive investors: Depreciation is non-cash, so a rental often shows a tax loss while cash-flowing — sheltering income. Rental losses are passive: they offset passive income freely, and up to $25,000/yr can offset ordinary (W-2) income if you actively participate and your MAGI is under $100k (phasing out to $0 by $150k); unused losses carry forward. On sale, claimed depreciation is recaptured at up to 25%, and gains may owe capital-gains tax (a 1031 exchange can defer both). Figures are a year-1 estimate at your 24.0% rate — not tax advice; consult a CPA.
Schools (NCES district)
- District
- Lake
- NCES district ID
- 1201050
- Math proficiency
- 49% ▼ -7.00%
- Reading proficiency
- 50% ▼ -4.00%
- Median HH income
- $46,632
- Composite
- 42.05/100
- National rank
- #3327
- State rank
- #37 of 73 in FL
Livability — Eustis
- Score
- 73/100
- State rank
- #309
- US rank
- #5286
Category grades
Schools grade is shown separately in the Schools card above.
Census & demographics
- Census place
- Eustis, FL
- County
- Lake County · 364,602 people
- City population
- 24,715
- Metro
- Orlando-Kissimmee-Sanford, FL
- Population (ZIP)
- 24,715
- Household income
- $63,152
- Rent vs Own
- Severe rent burden
- 584.0
Population outlook (Lake County) Hauer SSP2
- Today (2025)
- 386,640 people
- By 2030
- 417,107 · +7.9%
- By 2040
- 476,676 · +23.3%
- By 2050
- 531,296 · +37.4%
- By 2075
- 648,303 · +67.7%
- By 2100
- 698,530 · +80.7%
Race, ethnicity, and origin ACS 2023
- Neighborhood character
- Diverse neighborhood (Simpson 0.59)
- Race & ethnicity
- White 59% Black 19% Hispanic / Latino 17% Two or more races 12% Asian 2%
- Hispanic origin (detail)
- Mexican 3% Puerto Rican 7% Dominican 4%
- Common ancestry
- Hispanic 2% Romanian 2% Lithuanian 2%
- Foreign-born
- 14% · Canada, Vietnam
- Languages at home
- 84% English-only · Spanish 10% French/Haitian/Cajun 3% Other Indo-European 1%
Political lean MEDSL · Lake
- 2024 margin
- Strong R (+24.7) · D 37.3% · R 62.0%
- 2008→2024 swing
- -11.2pp toward R · 2008: -13.5pp · 2024: -24.7pp
- All cycles
- 2024: R+24.7 2020: R+20.0 2016: R+23.1 2012: R+17.1 2008: R+13.5
Not yet ingested
- Civics
- —
Market trends
- HPI YoY
- ▼ -88.12%
- Current HPI
- 325.4692
- Rent YoY
- ▲ 3.20%
- Metro
- Orlando-Kissimmee-Sanford, FL
- State GDP YoY
- ▲ 3.28%
- F500 in state
- 36
Industry mix (Fortune 500 HQ in FL)
| Industry | F500 HQs | Revenue |
|---|---|---|
| Industrial Technology | 2 | $29B |
|
||
| Insurance | 2 | $17B |
|
||
| Retail | 1 | $60B |
|
||
| Technology Distribution | 1 | $58B |
|
||
| Homebuilding | 1 | $35B |
|
||
| Technology Manufacturing | 1 | $35B |
|
||
Cash-flow waterfall
monthlySold comps — $/sqft
last 12 mo · ≤1 miLoading sold comps…