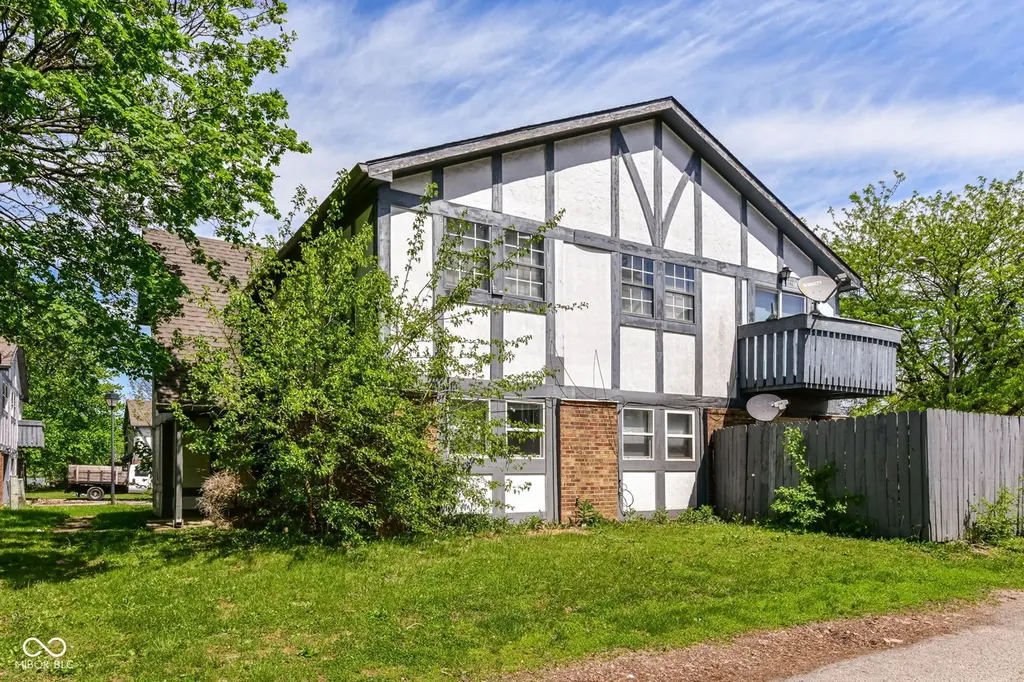
9855 Haven Ct · Indianapolis city (balance), IN
Flood risk No data
- FEMA flood zone
- —
- Chance of flooding over 30 yrs
- —
- Est. flood insurance / yr
- —
Fire risk No data
- Est. fire insurance / yr
- —
Heat risk No data
- Hot days now (above threshold)
- —
- Hot days in 30 yrs
- —
Wind risk No data
- Chance of severe wind over 30 yrs
- —
Air-quality risk No data
- Unhealthy air days now
- —
- Unhealthy air days in 30 yrs
- —
Risk factors via First Street. Map © Google.
Why this score? — see what drove the B- grade
The composite is a weighted blend of 9 inputs, each scored 0–100. Each bar is that input's sub-score; the figure is the points it added to the 100-point composite (weight × sub-score).
- Cash flow +30.0/30.0
- 1% rule +10.0/10.0
- DSCR +10.0/10.0
- ARV discount +7.5/15.0
- Rent growth +3.1/5.0
- Livability +2.5/5.0
- Condition / age +2.5/5.0
- Schools +1.4/10.0
- Appreciation +0.0/10.0
$45,000
🖨 Deal sheet 📄 Offer letter ✓ Due diligence
Listing remarks MLS
Great investment and ownership opportunity. 2 bedroom condo in good condition. No maintenance living. Located near shopping, bus line, schools and the interstate. Rents in this complex rage from 600-700. HOA fee includes water, trash and exterior insurance. Enjoy a cup of coffee on the balcony or in front of the fireplace.
Key facts
- $250 HOA
- Garage
- Built 1973
Property features AI
Finance
- Other: Unit part of a horizontal property regime with a shared interest in common areas
- HOA & community: Homeowners association with a monthly fee of $250; Low-maintenance lifestyle
Exterior
- Parking: Detached garage (1 car)
- Utilities: Public water; Municipal sewer
- Home design: Residential condominium (co-op); Upper level unit; Two levels; Mandatory fee ownership interest
- Construction: Stucco and vinyl with brick exterior; Slab foundation
- Exterior features: Balcony; End unit with no one above or below; Low-maintenance exterior
Interior
- Kitchen: Dishwasher; Electric oven; Refrigerator
- Bedrooms: Two bedrooms on the upper level; Primary bedroom with walk-in closet
- Bathrooms: One full bathroom (upper level)
- Heating & cooling: Forced air heating (natural gas); Central air conditioning
- Interior features: Walk-in closet(s); Stained woodwork; Balcony; Fireplace in living room
Neighborhood map
What this means for you Summary
Snapshot
- This is a 2-bed/1.0-bath condo listed at $45k.
Deal economics
- At list price, monthly cash flow is $582 ($7k/yr) — positive.
- The deal already cash-flows at list — no discount required.
- Meets the 1% rule at list price ($1k rent vs $45k).
- Recommended offer: $44k (1.5% below list) — sets the bar for market timing.
- Cap rate 21.8% vs local median 4.4% in Indianapolis city (balance) — top-decile yield for the area; either an underpriced asset or a hidden risk that comps aren't pricing in. Stress-test before assuming the spread holds.
Location & tenants
- Location reads: area grade B — affects rentability + tenant quality, not the cash-flow math above.
- Indianapolis Public Schools (urban): math 14% / reading 20% proficiency, ranked #286 of 301 in IN (top 95%) — low school quality limits family demand, transient renter base, plan for 1-2y turnover; 77% free/reduced lunch — lower-income household profile, screen leases tightly.
- Zoned schools: George S Buck School 94 (math 2% / reading 8%, grade F, #970 of 994 statewide, top 99%, 245 students, 75% FRL); Arsenal Technical High School (math 6% / reading 27%, grade F, #353 of 369 statewide, top 96%, 2,366 students, 74% FRL) — zoned schools at 74% FRL track the district average.
- Market conditions: Rents rising (+2.6%/yr); 54 active listings in the ZIP; 3 comparable units currently listed for rent nearby; rentals at typical pace (median 24d on market — plan ~3-4 weeks tenant-placement turnaround); 1,906 units permitted in Marion County in 2024 (621 in 5+ unit buildings).
Forward outlook
- Local home prices are declining (-3.0%/yr); year-one equity from $311 of loan paydown is wiped out by about $1k of value loss. Plan a longer hold.
- Marion County population projected at +18% by 2050 — long-run rental-demand tailwind backs the buy-and-hold thesis.
- At projected returns (-3.0% appreciation + 2.6% rent growth), your $13k cash investment doubles in ~3 years — after that, you're playing with house money.
Negotiation context
- It's been on market 28 days — a 2% lower offer ($44k) is reasonable based on typical stale-listing flexibility.
- 8 sale attempts since 26y ago with the ask held roughly flat each time — persistent listings suggest the price (not the market) is what's stuck; bring a comps-based counter.
- Current owner paid $39k; 15% above their basis — modest negotiation headroom, anchor on the comps not their cost.
Questions for the listing agent
- Built in 1973 — when were the roof, HVAC, electrical panel, plumbing, and water heater last replaced?
- What does the HOA fee cover, when was the last increase, and are there any pending special assessments or reserve-fund shortfalls?
- Any open or pending special assessments — roof, HVAC, plumbing, elevator, façade? What's the per-unit balance and payoff schedule, and is the seller paying it off at close or rolling it to the buyer?
- Is there a deadline driving the sale (1031 exchange, divorce, estate, relocation)? That informs how much negotiation room exists.
- What's the average days-on-market for RENTAL listings here right now (not sales)? A rising rental-DOM trend means longer vacancies and softer asking-rent achievability than the comps imply.
- What's the recent tenant-quality profile in this submarket — average credit score on applications, eviction rate, late-payment / NSF rate, and stable-employment percentage? A property-management company in the area should have these aggregated.
- How much new apartment / multifamily construction is in the pipeline within 1–3 miles? Heavy new supply (>2% of stock underway) typically softens rents 12–24 months out; light construction supports rent growth.
Investment metrics
- 1% rule
- 3.10% ✓
- Cap rate
- 21.82%
- Cash-on-cash
- 55.45%
- DSCR
- 3.47
- GRM
- 2.7
CMA / ARV
No comps found within radius.
Projected returns pro-forma
-3.0% appreciation · 2.56% rent growth · sell at horizon
- IRR
- 53.3%
- Equity multiple
- 3.33×
- Total profit
- $29,323
- Equity at exit
- $6,710
- IRR
- 58.3%
- Equity multiple
- 6.67×
- Total profit
- $71,387
- Equity at exit
- $3,891
Cash invested: $12,600 (down + closing). Projections, not guarantees.
Landlord ↔ Tenant lean methodology
- Overall (STATE)
- 90 Strongly Landlord-Friendly
- State Indiana
- 90 Strongly Landlord-Friendly · R+11
- County
- — inherits STATE
- City
- — inherits STATE
ZIP-level market 46235
- Home prices YoY
- -4.3%
- Rents YoY
- 2.6%
- Active inventory
- 54
- Price-to-rent
- 2.7×
Monthly cashflow live
- Estimated rent
- $1,396 medium interval (Pro) →
- Mortgage (P&I)
- −$236
- Tax from tax record
- −$16 /mo · $187/yr
- Insurance
- −$19
- HOA
- −$250
- Vacancy / Maint / Mgmt
- −$293
- Net cashflow
- $582
Break-even live
UW: 25.0% down · 7.5% · 30yr · 1.5% tax · 5.0% vac · 8.0% maint · 8.0% mgmt
Financing live
Cash to close
- Down payment
- $11,250
- Closing costs
- $1,350
- Reserves months
- —
- Total cash needed
- —
Loan-product check · same deal, 3 products live
Conventional
25% down · 7.5% · 30yr
- Down + closing
- —
- Monthly P&I
- —
- Monthly cashflow
- —
- DSCR
- —
- Eligible?
- —
Personal DTI + credit; lowest rate.
DSCR
20% down · 8.5% · 30yr
- Down + closing
- —
- Monthly P&I
- —
- Monthly cashflow
- —
- DSCR
- —
- Eligible?
- —
No personal income docs; deal must DSCR.
Hard money
10% down · 12.0% · 12mo
- Down + closing
- —
- Monthly P&I
- —
- Monthly cashflow
- —
- DSCR
- —
- Eligible?
- —
Short-term bridge; refi at stabilization.
Rent comps 3 comps
| Address | Beds | Baths | Sqft | Rent | $/sqft | DOM | Units | Dist |
|---|---|---|---|---|---|---|---|---|
| 10101 Montery Rd Indianapolis, IN | 2.0 | 1.0 | 627 | $1,439 | $2.30 | 2d | 10 | 0.56mi |
| 3645 Wingate Ct Indianapolis, IN | 3.0 | 1.0–2.0 | 774 | $1,258 | $1.62 | 23d | 6 | 0.63mi |
| 9060 E 39th Pl Indianapolis, IN | 1.0–2.0 | 1.0–1.5 | 820 | $1,040 | $1.27 | 23d | 1 | 0.82mi |
HOA detail condo
- Monthly dues
- $250 · $3,000/yr
- Likely covers
- watertrash
- Assessments
- None detected in remarks — confirm with the listing agent.
Listing history 15 events
-
2026-04-16$45,000 Active 465-char remark
-
2025-04-28$40,000 Active
-
2018-07-30soldstatus $21,000 Sold
Show marketing remark (324 chars)
Great investment and ownership opportunity. 2 bedroom condo in good condition. No maintenance living. Located near shopping, bus line, schools and the interstate. Rents in this complex rage from 600-700. HOA fee includes water, trash and exterior insurance. Enjoy a cup of coffee on the balcony or in front of the fireplace.
-
2018-07-20status Pending
Show marketing remark (324 chars)
Great investment and ownership opportunity. 2 bedroom condo in good condition. No maintenance living. Located near shopping, bus line, schools and the interstate. Rents in this complex rage from 600-700. HOA fee includes water, trash and exterior insurance. Enjoy a cup of coffee on the balcony or in front of the fireplace.
-
2018-07-14$20,500 Active
Show marketing remark (324 chars)
Great investment and ownership opportunity. 2 bedroom condo in good condition. No maintenance living. Located near shopping, bus line, schools and the interstate. Rents in this complex rage from 600-700. HOA fee includes water, trash and exterior insurance. Enjoy a cup of coffee on the balcony or in front of the fireplace.
-
2013-02-25historical
-
2011-08-30$21,000
-
2006-02-21soldstatus $12,000
-
2005-12-31historical
-
2005-11-22$12,000
-
2005-10-05
-
2003-09-11historical
-
2002-10-18$29,900
-
2001-12-04historical
-
2000-12-04$30,900
ⓘ Source: listings_history table (triggers on properties + properties_extension) + one-shot
backfill from property_details.listing_events for pre-trigger history.
Tax reassessment forecast IN · Partial reset (capped growth)
- Current annual tax
- $187 · $16/mo
- Projected year-2 tax
- $285 · $24/mo
- Expected delta
- +$98/yr (+$8/mo · 52.4%)
ⓘ Screening estimate from a state-policy table — verify with the county assessor before closing.
Nearby sold comps map
Loading sold comps map…
Walkable amenities ~0.75 mi
Loading nearby amenities…
Taxation est. · year 1
- Rental income
- $16,747
- − Mortgage interest
- −$2,521
- − Property taxes
- −$187
- − Insurance
- −$225
- − Repairs & maintenance
- −$1,340
- − Management
- −$1,340
- − HOA
- −$3,000
- − Depreciation
- −$1,309
- Taxable income
- $6,826
- Est. tax owed @ 24.0%
- −$1,638
- After-tax cash flow
- $5,348/yr
For passive investors: Depreciation is non-cash, so a rental often shows a tax loss while cash-flowing — sheltering income. Rental losses are passive: they offset passive income freely, and up to $25,000/yr can offset ordinary (W-2) income if you actively participate and your MAGI is under $100k (phasing out to $0 by $150k); unused losses carry forward. On sale, claimed depreciation is recaptured at up to 25%, and gains may owe capital-gains tax (a 1031 exchange can defer both). Figures are a year-1 estimate at your 24.0% rate — not tax advice; consult a CPA.
Schools (NCES district)
- District
- Indianapolis Public Schools
- NCES district ID
- 1804770
- Math proficiency
- 14% ▼ -7.00%
- Reading proficiency
- 20% ▼ -3.00%
- Median HH income
- $32,034
- Composite
- 13.69/100
- National rank
- #9499
- State rank
- #286 of 301 in IN
Livability — Indianapolis city (balance)
No livability data for this city. (Only ~50 U.S. cities are tracked.)
Census & demographics
- Census place
- Indianapolis city (balance), IN
- County
- Marion County · 998,460 people
- City population
- 881,119
- Metro
- Indianapolis-Carmel-Anderson, IN
- Population (ZIP)
- 36,317
- Household income
- $58,951
- Rent vs Own
- Severe rent burden
- 1901.0
Population outlook (Marion County) Hauer SSP2
- Today (2025)
- 1,025,572 people
- By 2030
- 1,065,727 · +3.9%
- By 2040
- 1,141,577 · +11.3%
- By 2050
- 1,208,920 · +17.9%
- By 2075
- 1,367,288 · +33.3%
- By 2100
- 1,438,201 · +40.2%
Race, ethnicity, and origin ACS 2023
- Neighborhood character
- Diverse neighborhood (Simpson 0.62)
- Race & ethnicity
- Black 57% White 18% Hispanic / Latino 17% Two or more races 11%
- Hispanic origin (detail)
- Mexican 11% Puerto Rican 2%
- Common ancestry
- Hispanic 3% Slovak 1% Romanian 1%
- Foreign-born
- 11% · Canada
- Languages at home
- 80% English-only · Spanish 15% French/Haitian/Cajun 4%
Political lean MEDSL · Marion
- 2024 margin
- Strong D (+27.7) · D 63.0% · R 35.3% · Other 1.7%
- 2008→2024 swing
- -0.7pp no change · 2008: 28.4pp · 2024: 27.7pp
- All cycles
- 2024: D+27.7 2020: D+29.1 2016: D+22.8 2012: D+22.2 2008: D+28.4
Not yet ingested
- Civics
- —
Market trends
- HPI YoY
- ▼ -12.41%
- Current HPI
- 275.1505
- Rent YoY
- ▲ 2.56%
- Metro
- Indianapolis-Carmel-Anderson, IN
- State GDP YoY
- ▲ 2.90%
- F500 in state
- 18
Industry mix (Fortune 500 HQ in IN)
| Industry | F500 HQs | Revenue |
|---|---|---|
| Industrial Machinery | 2 | $37B |
|
||
| Healthcare | 1 | $177B |
|
||
| Pharmaceuticals | 1 | $45B |
|
||
| Metals / Steel | 1 | $18B |
|
||
| Agriculture | 1 | $17B |
|
||
| Packaging | 1 | $12B |
|
||
Price history
+26.2% since first listed17 events — show timeline
- 2026-06-12 Sold (MLS) $39,000 MIBOR as Distributed by MLS Grid
- 2026-05-26 Pending — MIBOR as Distributed by MLS Grid
- 2026-04-16 Listed $45,000 MIBOR as Distributed by MLS Grid
- 2025-04-28 Listed $40,000 MIBOR as Distributed by MLS Grid
- 2018-07-30 Sold (MLS) $21,000 MIBOR as Distributed by MLS Grid
- 2018-07-20 Pending — MIBOR as Distributed by MLS Grid
- 2018-07-14 Listed $20,500 MIBOR as Distributed by MLS Grid
- 2013-02-25 Listing Removed — MIBOR as Distributed by MLS Grid
- 2011-08-30 Listed $21,000 MIBOR as Distributed by MLS Grid
- 2006-02-21 Sold (MLS) $12,000 MIBOR as Distributed by MLS Grid
- 2005-12-31 Listing Removed — MIBOR as Distributed by MLS Grid
- 2005-11-22 Listed $12,000 MIBOR as Distributed by MLS Grid
- 2005-10-05 Listed — MIBOR as Distributed by MLS Grid
- 2003-09-11 Listing Removed — MIBOR as Distributed by MLS Grid
- 2002-10-18 Listed $29,900 MIBOR as Distributed by MLS Grid
- 2001-12-04 Listing Removed — MIBOR as Distributed by MLS Grid
- 2000-12-04 Listed $30,900 MIBOR as Distributed by MLS Grid
Property tax history
+5.4%/yrLatest (2025): $187 · -37.5% YoY. Source: county tax records.
Cash-flow waterfall
monthlySold comps — $/sqft
last 12 mo · ≤1 miLoading sold comps…