 Triplex
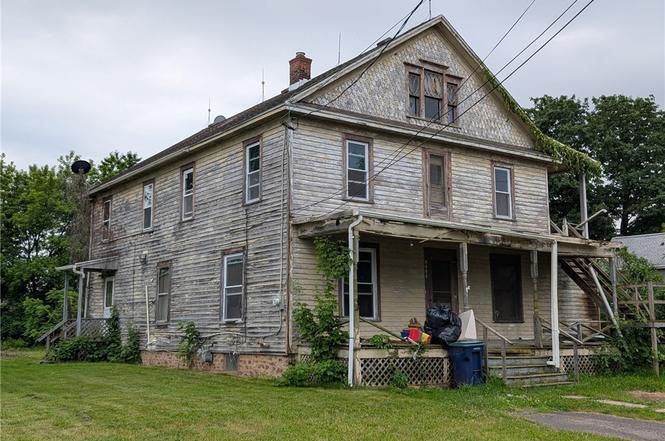
8688 Church St · Barker, NY
Flood risk 1/10 · Minimal
- FEMA flood zone
- X (unshaded)
- Chance of flooding over 30 yrs
- 0.0%
- Est. flood insurance / yr
- $473 – $860
Fire risk 3/10 · Minor
- Est. fire insurance / yr
- $691 – $1,283
Heat risk 3/10 · Minor
- Hot days now (above 94°F)
- 7 days/yr
- Hot days in 30 yrs
- 15 days/yr
Wind risk 1/10 · Minimal
- Chance of severe wind over 30 yrs
- —
Air-quality risk 2/10 · Minimal
- Unhealthy air days now
- 1 days/yr
- Unhealthy air days in 30 yrs
- 2 days/yr
Risk factors via First Street. Map © Google.
Why this score? — see what drove the A- grade
The composite is a weighted blend of 9 inputs, each scored 0–100. Each bar is that input's sub-score; the figure is the points it added to the 100-point composite (weight × sub-score).
- Cash flow +30.0/30.0
- 1% rule +10.0/10.0
- DSCR +10.0/10.0
- Appreciation +10.0/10.0
- ARV discount +7.5/15.0
- Schools +5.3/10.0
- Livability +3.0/5.0
- Rent growth +2.5/5.0
- Condition / age +2.5/5.0
$79,900
🖨 Deal sheet 📄 Offer letter ✓ Due diligence
Multi-family units
County records classify this as Multi-Family (2-4 Unit). Listing-text estimate: 3 units. confirmed
Listing remarks
Bring your handy people and/or investors! Most windows have been replaced. With over 3700 sq. ft. , this 3-family home was built in 1880. If you're looking for a project, you've found it! 9 bedrooms, 3 full bathrooms and one half bath, with generous room sizes and a full stone basement. Centrally located in the village of Barker, close to schools and churches. There is a 1st floor laundry and public water and sewers. Owner's apartment has a bath and a half and there are front and rear staircases.
Key facts
- Replaced windows
- Centrally located
- 1st floor laundry
Tags
Property features AI
Finance
- Other: 3 total units in the building; Single gas meter; Single electric meter
- Financial info: Owner pays grounds care, hot water, trash collection, water (per rental info); Rent may include gardener and utilities (per rental info); Operating expense details: see remarks (multi-family)
Exterior
- Parking: Gravel parking
- Utilities: High-speed internet available; Public water (connected); Sewer connected; Electric service with circuit breakers and fuses
- Home design: 2 stories; Existing/resale property
- Construction: Wood siding; Copper plumbing; Stone foundation
- Exterior features: Near public transit; Rectangular residential lot; City street frontage
Interior
- Kitchen: Oil water heater (appliance/equipment listed)
- Bedrooms: 3 separate dwelling units (multi-family property)
- Flooring: Carpet; Hardwood; Tile; Vinyl; Varied flooring types
- Bathrooms: 3 full bathrooms; 1 half bathroom
- Heating & cooling: Gas heating; Hot water heating with radiators; Has heating
- Interior features: Natural woodwork throughout; Walk-out basement access
- Laundry & utility: Owner pays all utilities (multi-family arrangement noted)
Neighborhood map
What this means for you Summary
Snapshot
- This is a 3 × 2-bed/1.7-bath units multifamily listed at $80k.
Deal economics
- At list price, monthly cash flow is $2k ($22k/yr) — positive. Per door: $609/mo.
- The deal already cash-flows at list — no discount required.
- Meets the 1% rule at list price ($3k rent vs $80k).
Location & tenants
- Location reads 60/100 on livability (#1,001 in NY) — a middle-class / working-renter tenant base. Strengths: cost of living A+, housing A+; Watch: employment D, crime F, amenities F.
- Barker Central School District (rural): math 60% / reading 65% proficiency, ranked #204 of 590 in NY (top 35%) — acceptable for families but not a draw, mixed tenant base, ~2y average lease.
- Market conditions: 20 active listings in the ZIP; 167 units permitted in Niagara County in 2024 (0 in 5+ unit buildings).
Forward outlook
- In year one you build about $9k of equity ($552 loan paydown + $8k appreciation (10.0% local appreciation)).
- Niagara County population projected at -19% by 2050 — secular population decline; favor cash flow + early exit over multi-decade hold.
- At projected returns (10.0% appreciation + 3.0% rent growth), your $22k cash investment doubles in ~1 year — after that, you're playing with house money.
- By year 4, paydown + projected appreciation supports a ~$30k cash-out refi (75% LTV) — recoverable capital for the next deal without selling this one.
Negotiation context
- Only 3 days on market — expect competitive offers; lowballing is unlikely to land.
Risks & watch-outs
- Watch-outs: property tax is 3.4% of price; built in 1880 — expect roof / HVAC / electrical / plumbing capex.
Questions for the listing agent
- Can we see the unit-by-unit rent roll, current vacancy, and any below-market leases? What's the average tenancy length?
- What capital expenditures (roof, boiler, parking lot, exteriors) have been made in the last 5 years, and what's planned in the next 2?
- Built in 1880 — when were the roof, HVAC, electrical panel, plumbing, and water heater last replaced?
- Property tax is high relative to price — has the assessment been appealed recently, and will the sale trigger a re-assessment?
- Is there a deadline driving the sale (1031 exchange, divorce, estate, relocation)? That informs how much negotiation room exists.
- Crime grade is F in this area — have there been break-ins, vandalism, or insurance claims at this property in the last 3 years? What carrier currently insures it and at what premium?
- What's the average days-on-market for RENTAL listings here right now (not sales)? A rising rental-DOM trend means longer vacancies and softer asking-rent achievability than the comps imply.
- What's the recent tenant-quality profile in this submarket — average credit score on applications, eviction rate, late-payment / NSF rate, and stable-employment percentage? A property-management company in the area should have these aggregated.
- How much new apartment / multifamily construction is in the pipeline within 1–3 miles? Heavy new supply (>2% of stock underway) typically softens rents 12–24 months out; light construction supports rent growth.
Investment metrics
- 1% rule
- 3.96% ✓
- Cap rate
- 33.72%
- Cash-on-cash
- 97.97%
- DSCR
- 5.36
- GRM
- 2.1
CMA / ARV
No comps found within radius.
Projected returns pro-forma
10.0% appreciation · 3.0% rent growth · sell at horizon
- IRR
- —
- Equity multiple
- 8.15×
- Total profit
- $159,968
- Equity at exit
- $71,980
- IRR
- —
- Equity multiple
- 17.98×
- Total profit
- $379,846
- Equity at exit
- $155,228
Cash invested: $22,372 (down + closing). Projections, not guarantees.
Landlord ↔ Tenant lean methodology
- Overall (STATE)
- 15 Strongly Tenant-Friendly
- State New York
- 15 Strongly Tenant-Friendly · D+10
- County
- — inherits STATE
- City
- — inherits STATE
ZIP-level market 14012
- Home prices YoY
- 14.8%
- Active inventory
- 20
- Price-to-rent
- 6.3×
Monthly cashflow live
- Estimated rent
- $3,168 medium interval (Pro) →
- Mortgage (P&I)
- −$419
- Tax from tax record
- −$224 /mo · $2,688/yr
- Insurance
- −$33
- HOA
- −$0
- Vacancy / Maint / Mgmt
- −$665
- Net cashflow
- $1,826
Break-even live
3-unit breakdown (identical units grouped — click to expand)
| Units | Beds | Baths | Est. rent |
|---|---|---|---|
| 3× units | 2 | 1.7 | $3,168 |
| #1 | 2 | 1.7 | $1,056 |
| #2 | 2 | 1.7 | $1,056 |
| #3 | 2 | 1.7 | $1,056 |
| Total (3 units) | $3,168 | ||
UW: 25.0% down · 7.5% · 30yr · 1.5% tax · 5.0% vac · 8.0% maint · 8.0% mgmt
Financing live
Cash to close
- Down payment
- $19,975
- Closing costs
- $2,397
- Reserves months
- —
- Total cash needed
- —
Loan-product check · same deal, 3 products live
Conventional
25% down · 7.5% · 30yr
- Down + closing
- —
- Monthly P&I
- —
- Monthly cashflow
- —
- DSCR
- —
- Eligible?
- —
Personal DTI + credit; lowest rate.
DSCR
20% down · 8.5% · 30yr
- Down + closing
- —
- Monthly P&I
- —
- Monthly cashflow
- —
- DSCR
- —
- Eligible?
- —
No personal income docs; deal must DSCR.
Hard money
10% down · 12.0% · 12mo
- Down + closing
- —
- Monthly P&I
- —
- Monthly cashflow
- —
- DSCR
- —
- Eligible?
- —
Short-term bridge; refi at stabilization.
Listing history 5 events
-
2026-06-18days on market $79,900 Active 3 DOM
-
2026-06-17days on market $79,900 Active 2 DOM
-
2026-06-16remarks 501-char remark
-
2026-06-15remarks 470-char remark
-
2026-06-15$79,900 Active 1 DOM
ⓘ Source: listings_history table (triggers on properties + properties_extension) + one-shot
backfill from property_details.listing_events for pre-trigger history.
Tax reassessment forecast NY · Partial reset (capped growth)
- Current annual tax
- $2,688 · $224/mo
- Projected year-2 tax
- $2,688 · $224/mo
- Expected delta
- $0/yr ($0/mo · 0.0%)
ⓘ Screening estimate from a state-policy table — verify with the county assessor before closing.
Climate risk First Street
- Flood 1/10 Low FEMA zone X (unshaded) · 0% chance over 30 yrs
- Wildfire 3/10 Moderate
- Heat 3/10 Moderate 7 d/yr ≥94°F today · 15 d/yr by 30 yrs out
- Wind 1/10 Low
- Air quality 2/10 Low 1 unhealthy d/yr today · 2 by 30 yrs out
Nearby sold comps map
Loading sold comps map…
Walkable amenities ~0.75 mi
Loading nearby amenities…
Taxation est. · year 1
- Rental income
- $38,016
- − Mortgage interest
- −$4,476
- − Property taxes
- −$2,688
- − Insurance
- −$400
- − Repairs & maintenance
- −$3,041
- − Management
- −$3,041
- − Depreciation
- −$2,324
- Taxable income
- $22,046
- Est. tax owed @ 24.0%
- −$5,291
- After-tax cash flow
- $16,626/yr
For passive investors: Depreciation is non-cash, so a rental often shows a tax loss while cash-flowing — sheltering income. Rental losses are passive: they offset passive income freely, and up to $25,000/yr can offset ordinary (W-2) income if you actively participate and your MAGI is under $100k (phasing out to $0 by $150k); unused losses carry forward. On sale, claimed depreciation is recaptured at up to 25%, and gains may owe capital-gains tax (a 1031 exchange can defer both). Figures are a year-1 estimate at your 24.0% rate — not tax advice; consult a CPA.
Schools (NCES district)
- District
- Barker Central School District
- NCES district ID
- 3603960
- Math proficiency
- 60% ▼ -10.00%
- Reading proficiency
- 65% ▲ 6.00%
- Median HH income
- $53,339
- Composite
- 53.45/100
- National rank
- #1463
- State rank
- #204 of 590 in NY
Livability — Barker
- Score
- 60/100
- State rank
- #1001
- US rank
- #19513
Category grades
Schools grade is shown separately in the Schools card above.
Census & demographics
- Census place
- Barker, NY
- Population (ZIP)
- 2,944
Population outlook (Niagara County) Hauer SSP2
- Today (2025)
- 204,149 people
- By 2030
- 197,900 · -3.1%
- By 2040
- 182,239 · -10.7%
- By 2050
- 165,198 · -19.1%
- By 2075
- 129,416 · -36.6%
- By 2100
- 96,222 · -52.9%
Race, ethnicity, and origin ACS 2023
- Neighborhood character
- Predominantly White (80%)
- Race & ethnicity
- White 80% Black 8% Two or more races 7% Native American 4% Hispanic / Latino 2%
- Common ancestry
- Italian 5% Romanian 3% Slovak 1%
- Foreign-born
- 5% · Canada
- Languages at home
- 95% English-only · Spanish 1% Other Asian/Pacific 1% Other Indo-European 1%
Political lean MEDSL · Niagara
- 2024 margin
- R (+14.9) · D 42.5% · R 57.5%
- 2008→2024 swing
- -15.9pp toward R · 2008: 1.0pp · 2024: -14.9pp
- All cycles
- 2024: R+14.9 2020: R+9.7 2016: R+19.0 2012: D+0.6 2008: D+1.0
Not yet ingested
- Civics
- —
Market trends
- HPI YoY
- ▲ 40.61%
- Current HPI
- 315.6587
- Rent YoY
- —
- Metro
- —
- State GDP YoY
- ▲ 2.60%
- F500 in state
- 92
Industry mix (Fortune 500 HQ in NY)
| Industry | F500 HQs | Revenue |
|---|---|---|
| Financial Services | 10 | $950B |
|
||
| Consumer Goods | 9 | $162B |
|
||
| Insurance | 4 | $225B |
|
||
| Telecommunications | 2 | $144B |
|
||
| Pharmaceuticals | 2 | $112B |
|
||
| Media / Entertainment | 2 | $69B |
|
||
Price history
1 event — show timeline
- 2026-06-15 Listed $79,900 WNYREIS
Property tax history
+4.3%/yrLatest (2025): $2,688 · -2.1% YoY. Source: county tax records.
Cash-flow waterfall
monthlySold comps — $/sqft
last 12 mo · ≤1 miLoading sold comps…