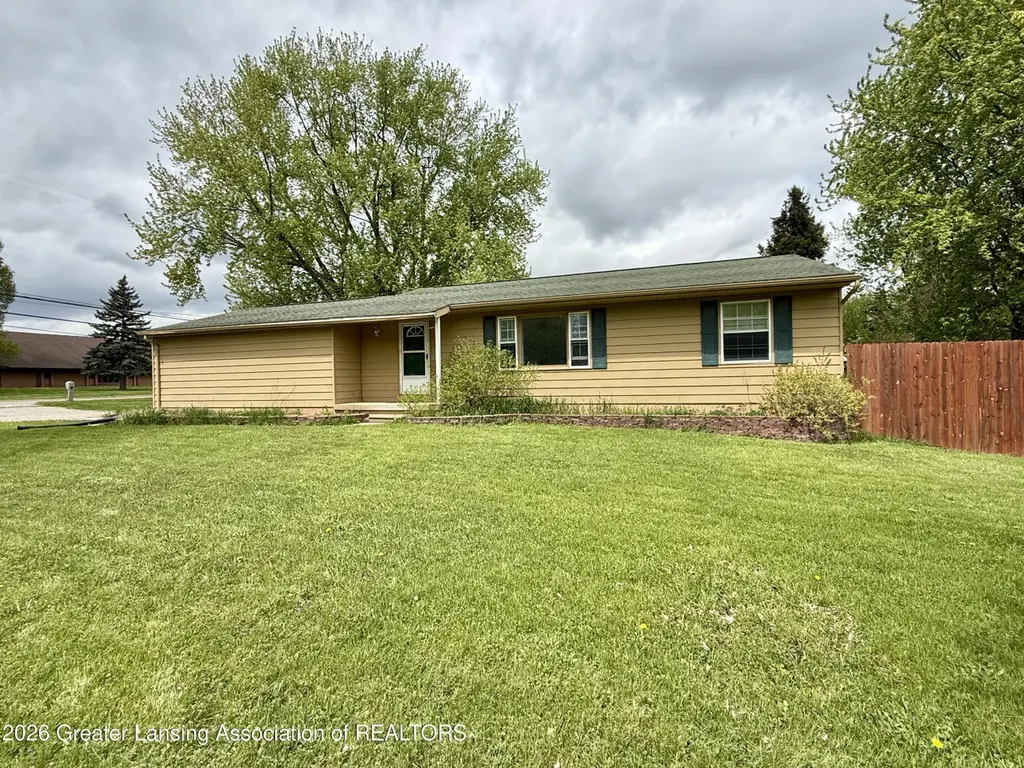
3380 W Clark Rd · DeWitt, MI
Flood risk 5/10 · Moderate
- FEMA flood zone
- X (unshaded)
- Chance of flooding over 30 yrs
- 0.66%
- Est. flood insurance / yr
- $473 – $860
Fire risk 1/10 · Minimal
- Est. fire insurance / yr
- $784 – $1,456
Heat risk 2/10 · Minimal
- Hot days now (above 96°F)
- 7 days/yr
- Hot days in 30 yrs
- 15 days/yr
Wind risk 2/10 · Minimal
- Chance of severe wind over 30 yrs
- —
Air-quality risk 2/10 · Minimal
- Unhealthy air days now
- 1 days/yr
- Unhealthy air days in 30 yrs
- 2 days/yr
Risk factors via First Street. Map © Google.
Why this score? — see what drove the D+ grade
The composite is a weighted blend of 9 inputs, each scored 0–100. Each bar is that input's sub-score; the figure is the points it added to the 100-point composite (weight × sub-score).
- ARV discount +15.0/15.0
- Cash flow +11.0/30.0
- Schools +5.0/10.0
- Livability +3.9/5.0
- 1% rule +3.7/10.0
- DSCR +3.2/10.0
- Rent growth +2.5/5.0
- Condition / age +2.5/5.0
- Appreciation +0.0/10.0
$265,000
🖨 Deal sheet 📄 Offer letter ✓ Due diligence
Listing remarks MLS
Welcome to 3380 W Clark Rd in the heart of DeWitt! This well-located home offers the perfect blend of convenience and community, situated within the highly sought-after DeWitt School District. Enjoy easy walking access to local schools, shopping, dining, and everything downtown DeWitt has to offer. Whether you're looking for everyday convenience or a connected neighborhood feel, this property delivers an ideal lifestyle in a prime location.
Key facts
- Prime location
- 0.4 acre lot
- Garage
Tags
Property features AI
Finance
- Other: Lot approximately 0.4 acres (136 x 128); Located in Luroma Park subdivision; Directions: Corner of Schavey and Clark
Exterior
- Parking: Attached garage
- Utilities: Public sewer
- Home design: One-story home; Built in 1977
- Construction: Vinyl siding
- Exterior features: Private yard; Patio; Barn(s)
Interior
- Kitchen: Dishwasher; Microwave; Oven; Range; Refrigerator
- Bedrooms: 4 bedrooms; Primary bedroom (12.6 x 12.0)
- Bathrooms: 2 full bathrooms
- Heating & cooling: Central air conditioning; Forced air heating
- Interior features: Full, partially finished basement; 10 total rooms; Living room (23.0 x 13.6); Dining room (13.0 x 13.0); Kitchen (13.0 x 13.0)
- Laundry & utility: Washer; Dryer; Laundry located in basement
Neighborhood map
What this means for you Summary
Snapshot
- This is a 3-bed/2.0-bath single-family listed at $265k.
Deal economics
- At list price, monthly cash flow is $-111 ($-1k/yr) — negative.
- To cash-flow at today's rent, offer at most $245k (7.4% below list).
- To meet the 1% rule (rent ≥ 1% of price), the offer needs to be $230k (13.4% below list).
- Recommended offer: $230k (13.4% below list) — sets the bar for 1% rule.
- Cap rate 5.8% vs local median 2.9% in DeWitt — top-decile yield for the area; either an underpriced asset or a hidden risk that comps aren't pricing in. Stress-test before assuming the spread holds.
Location & tenants
- Location reads 78/100 on livability (#99 in MI, #2,361 nationally) — a middle-class / working-renter tenant base. Strengths: crime A+, employment A+, cost of living A+; Watch: amenities F, commute F, health & safety D-.
- Dewitt Public Schools (suburban): math 51% / reading 60% proficiency, ranked #53 of 540 in MI (top 10%) — acceptable for families but not a draw, mixed tenant base, ~2y average lease; only 12% free/reduced lunch — higher-income household profile.
- Zoned schools: David Scott Elementary School (math 62% / reading 50%, grade C+, #267 of 1,397 statewide, top 19%, 448 students, 21% FRL).
- Market conditions: 103 active listings in the ZIP; 1 comparable units currently listed for rent nearby; high-income renter base; 154 units permitted in Clinton County in 2024 (0 in 5+ unit buildings).
Forward outlook
- Local home prices are declining (-3.0%/yr); year-one equity from $2k of loan paydown is wiped out by about $8k of value loss. Plan a longer hold.
Negotiation context
- It's been on market 45 days — a 3% lower offer ($257k) is reasonable based on typical stale-listing flexibility.
- 6 sale attempts since 17y ago with the ask held roughly flat each time — persistent listings suggest the price (not the market) is what's stuck; bring a comps-based counter.
- Current owner paid $146k; list at $265k implies a 82% gain — meaningful room to come down on a strong offer.
Risks & watch-outs
- Climate carrying-cost: moderate flood risk — expect insurance premiums to compound above CPI over the hold.
Questions for the listing agent
- What do current leases actually rent for vs. the listed asking? Can we see a recent rent roll and the last 12 months of T-12 income?
- It's been on market 45 days. Have you received any prior offers? Is the seller open to a 13% concession, seller financing, or rate buy-down credit?
- Built in 1977 — when were the roof, HVAC, electrical panel, plumbing, and water heater last replaced?
- Is there a deadline driving the sale (1031 exchange, divorce, estate, relocation)? That informs how much negotiation room exists.
- Schools are A-rated — typically a magnet for longer-tenancy family renters. What's the average tenant stay here, and is there a school-zone premium baked into asking?
- The area grade is low — what's the realistic commute time and amenity access for the typical tenant pool here? Any planned neighborhood developments (good or bad) we should know about?
- What's the average days-on-market for RENTAL listings here right now (not sales)? A rising rental-DOM trend means longer vacancies and softer asking-rent achievability than the comps imply.
- What's the recent tenant-quality profile in this submarket — average credit score on applications, eviction rate, late-payment / NSF rate, and stable-employment percentage? A property-management company in the area should have these aggregated.
- How much new for-sale + rental construction is in the pipeline within 1–3 miles? Heavy new supply typically softens prices + rents 12–24 months out; constrained supply supports both.
Investment metrics
- 1% rule
- 0.87% ✗
- Cap rate
- 5.79%
- Cash-on-cash
- -1.79%
- DSCR
- 0.92
- GRM
- 9.6
CMA / ARV
- ARV (median comp)
- $350,103
- List price
- $265,000
- Delta
- -24.31%
- Verdict
- UNDERPRICED
- Comps
- 20 within 1.0 mi
Show comp detail 12 sales within ~0.75 mi
| Address | Dist | Beds/Ba | Sqft | Sold | Price | $/sf | Match |
|---|---|---|---|---|---|---|---|
| 13820 Myrtle Dr | 0.30mi | 3/2.5 | 1,786 (+2%) | 10mo | $365,000 | $204 | 73 |
| 13955 Ducharme Dr | 0.18mi | 4/1.5 (+1) | 1,876 (+7%) | 7mo | $275,000 | $147 | 66 |
| 13865 Kaleidoscope Dr | 0.41mi | 4/2.5 (+1) | 1,830 (+4%) | 1mo | $384,900 | $210 | 66 |
| 13871 Kaleidoscope Dr | 0.40mi | 4/2.5 (+1) | 1,883 (+8%) | 2mo | $389,900 | $207 | 60 |
| 2984 Moccasin Dr | 0.48mi | 4/2.5 (+1) | 1,830 (+4%) | 3mo | $374,900 | $205 | 60 |
| 2956 Moccasin Dr | 0.50mi | 4/2.5 (+1) | 1,830 (+4%) | 4mo | $384,900 | $210 | 59 |
| 3012 Moccasin Dr | 0.46mi | 4/2.5 (+1) | 1,830 (+4%) | 7mo | $374,900 | $205 | 58 |
| 2938 Moccasin Dr | 0.49mi | 4/2.5 (+1) | 1,883 (+8%) | 4mo | $389,900 | $207 | 54 |
| 2891 Moccasin Dr | 0.51mi | 4/2.5 (+1) | 1,883 (+8%) | 5mo | $400,050 | $212 | 53 |
| 13860 Kaleidoscope Dr | 0.40mi | 4/2.5 (+1) | 1,883 (+8%) | 13mo | $379,900 | $202 | 52 |
| 2998 Moccasin Dr | 0.47mi | 4/2.5 (+1) | 1,883 (+8%) | 10mo | $390,050 | $207 | 50 |
| 2968 Moccasin Dr | 0.49mi | 4/2.5 (+1) | 1,883 (+8%) | 10mo | $395,050 | $210 | 49 |
Match score weights: distance 35% · size 25% · config 20% · recency 20%. Top-matched comps best support the ARV.
Projected returns pro-forma
-3.0% appreciation · 3.0% rent growth · sell at horizon
- IRR
- -19.2%
- Equity multiple
- 0.33×
- Total profit
- $-49,897
- Equity at exit
- $39,512
- IRR
- -11.8%
- Equity multiple
- 0.30×
- Total profit
- $-52,152
- Equity at exit
- $22,912
Cash invested: $74,200 (down + closing). Projections, not guarantees.
Landlord ↔ Tenant lean methodology
- Overall (STATE)
- 62 Landlord-Friendly
- State Michigan
- 62 Landlord-Friendly · EVEN
- County
- — inherits STATE
- City
- — inherits STATE
ZIP-level market 48820
- Active inventory
- 103
- Price-to-rent
- 9.6×
Monthly cashflow live
- Estimated rent
- $2,295 medium interval (Pro) →
- Mortgage (P&I)
- −$1,390
- Tax from tax record
- −$424 /mo · $5,088/yr
- Insurance
- −$110
- HOA
- −$0
- Vacancy / Maint / Mgmt
- −$482
- Net cashflow
- $-111
Break-even live
UW: 25.0% down · 7.5% · 30yr · 1.5% tax · 5.0% vac · 8.0% maint · 8.0% mgmt
Financing live
Cash to close
- Down payment
- $66,250
- Closing costs
- $7,950
- Reserves months
- —
- Total cash needed
- —
Loan-product check · same deal, 3 products live
Conventional
25% down · 7.5% · 30yr
- Down + closing
- —
- Monthly P&I
- —
- Monthly cashflow
- —
- DSCR
- —
- Eligible?
- —
Personal DTI + credit; lowest rate.
DSCR
20% down · 8.5% · 30yr
- Down + closing
- —
- Monthly P&I
- —
- Monthly cashflow
- —
- DSCR
- —
- Eligible?
- —
No personal income docs; deal must DSCR.
Hard money
10% down · 12.0% · 12mo
- Down + closing
- —
- Monthly P&I
- —
- Monthly cashflow
- —
- DSCR
- —
- Eligible?
- —
Short-term bridge; refi at stabilization.
Rent comps 1 comps
| Address | Beds | Baths | Sqft | Rent | $/sqft | DOM | Units | Dist |
|---|---|---|---|---|---|---|---|---|
| 3505 W Clark Rd DeWitt, MI | 1.0–3.0 | 1.0–2.5 | 1196 | $3,326 | $2.78 | 21d | 1 | 0.18mi |
Listing history 26 events
-
2026-06-18days on market $265,000 Active 45 DOM
-
2026-06-17days on market $265,000 Active 44 DOM
-
2026-06-16days on market $265,000 Active 43 DOM
-
2026-06-15days on market $265,000 Active 42 DOM
-
2026-06-14days on market $265,000 Active 40 DOM
-
2026-06-10days on market $265,000 Active 37 DOM
-
2026-06-09days on market $265,000 Active 36 DOM
-
2026-06-08days on market $265,000 Active 35 DOM
-
2026-06-07days on market $265,000 Active 34 DOM
-
2026-06-03days on market $265,000 Active 30 DOM
-
2026-06-02days on market $265,000 Active 29 DOM
-
2026-06-01days on market $265,000 Active 28 DOM
-
2026-05-31days on market $265,000 Active 27 DOM
-
2026-05-30days on market $265,000 Active 26 DOM
-
2026-05-04$274,900 Active 444-char remark
Show marketing remark (444 chars)
Welcome to 3380 W Clark Rd in the heart of DeWitt! This well-located home offers the perfect blend of convenience and community, situated within the highly sought-after DeWitt School District. Enjoy easy walking access to local schools, shopping, dining, and everything downtown DeWitt has to offer. Whether you're looking for everyday convenience or a connected neighborhood feel, this property delivers an ideal lifestyle in a prime location.
-
2015-08-31soldstatus $145,500
-
2015-08-25soldstatus $145,500
-
2015-08-25soldstatus $145,500
-
2015-06-16$145,500
-
2015-06-16$145,500
-
2014-12-25historical
-
2014-06-25$143,900
-
2010-03-09historical
-
2009-12-09$149,900
-
2005-07-06soldstatus $146,500
ⓘ Source: listings_history table (triggers on properties + properties_extension) + one-shot
backfill from property_details.listing_events for pre-trigger history.
Tax reassessment forecast MI · Partial reset (capped growth)
- Current annual tax
- $5,088 · $424/mo
- Projected year-2 tax
- $5,088 · $424/mo
- Expected delta
- $0/yr ($0/mo · 0.0%)
ⓘ Screening estimate from a state-policy table — verify with the county assessor before closing.
Climate risk First Street
- Flood 5/10 Major FEMA zone X (unshaded) · 66% chance over 30 yrs
- Wildfire 1/10 Low
- Heat 2/10 Low 7 d/yr ≥96°F today · 15 d/yr by 30 yrs out
- Wind 2/10 Low
- Air quality 2/10 Low 1 unhealthy d/yr today · 2 by 30 yrs out
Nearby sold comps map
Loading sold comps map…
Walkable amenities ~0.75 mi
Loading nearby amenities…
Taxation est. · year 1
- Rental income
- $27,546
- − Mortgage interest
- −$14,844
- − Property taxes
- −$5,088
- − Insurance
- −$1,325
- − Repairs & maintenance
- −$2,204
- − Management
- −$2,204
- − Depreciation
- −$7,709
- Taxable loss
- −$5,827
- Est. tax savings @ 24.0%
- +$1,399
- After-tax cash flow
- $71/yr
For passive investors: Depreciation is non-cash, so a rental often shows a tax loss while cash-flowing — sheltering income. Rental losses are passive: they offset passive income freely, and up to $25,000/yr can offset ordinary (W-2) income if you actively participate and your MAGI is under $100k (phasing out to $0 by $150k); unused losses carry forward. On sale, claimed depreciation is recaptured at up to 25%, and gains may owe capital-gains tax (a 1031 exchange can defer both). Figures are a year-1 estimate at your 24.0% rate — not tax advice; consult a CPA.
Schools (NCES district)
- District
- Dewitt Public Schools
- NCES district ID
- 2611550
- Math proficiency
- 51% ▼ -5.00%
- Reading proficiency
- 60% ▼ -9.00%
- Median HH income
- $80,391
- Composite
- 50.22/100
- National rank
- #1895
- State rank
- #53 of 540 in MI
Livability — DeWitt
- Score
- 78/100
- State rank
- #99
- US rank
- #2361
Category grades
Schools grade is shown separately in the Schools card above.
Census & demographics
- County
- Clinton County · 18,357 people
- City population
- 18,357
- Metro
- Lansing-East Lansing, MI
- Population (ZIP)
- 18,357
- Household income
- $112,526
- Rent vs Own
- Severe rent burden
- 183.0
Population outlook (Clinton County) Hauer SSP2
- Today (2025)
- 81,490 people
- By 2030
- 82,558 · +1.3%
- By 2040
- 82,325 · +1.0%
- By 2050
- 79,133 · -2.9%
- By 2075
- 65,737 · -19.3%
- By 2100
- 51,314 · -37.0%
Race, ethnicity, and origin ACS 2023
- Neighborhood character
- Predominantly White (88%)
- Race & ethnicity
- White 88% Hispanic / Latino 6% Two or more races 5% Black 2%
- Hispanic origin (detail)
- Mexican 5%
- Common ancestry
- Romanian 5% Lithuanian 3% Slovak 3%
- Foreign-born
- 2% · Canada
- Languages at home
- 96% English-only · Spanish 2% German/W. Germanic 1%
Political lean MEDSL · Clinton
- 2024 margin
- Lean R (+8.6) · D 44.9% · R 53.5% · Other 1.5%
- 2008→2024 swing
- -9.3pp toward R · 2008: 0.7pp · 2024: -8.6pp
- All cycles
- 2024: R+8.6 2020: R+6.5 2016: R+12.7 2012: R+6.2 2008: D+0.7
Not yet ingested
- Civics
- —
Market trends
- HPI YoY
- ▼ -167.50%
- Current HPI
- 231.0122
- Rent YoY
- —
- Metro
- Lansing-East Lansing, MI
- State GDP YoY
- ▲ 1.37%
- F500 in state
- 28
Industry mix (Fortune 500 HQ in MI)
| Industry | F500 HQs | Revenue |
|---|---|---|
| Automotive Parts | 3 | $48B |
|
||
| Automotive | 2 | $372B |
|
||
| Chemicals | 1 | $45B |
|
||
| Automotive Retail | 1 | $29B |
|
||
| Healthcare / Medical Devices | 1 | $23B |
|
||
| Automotive Technology | 1 | $20B |
|
||
Price history
+80.9% since first listed14 events — show timeline
- 2026-05-19 Price Changed $265,000 REALCOMP
- 2026-05-19 Price Changed $265,000 Greater Lansing AoR
- 2026-05-04 Listed $274,900 Greater Lansing AoR
- 2026-05-04 Listed $274,900 REALCOMP
- 2015-08-31 Sold (Public Records) $145,500 Public Records
- 2015-08-25 Sold (MLS) $145,500 Greater Lansing AoR
- 2015-08-25 Sold (MLS) $145,500 REALCOMP
- 2015-06-16 Listed $145,500 Greater Lansing AoR
- 2015-06-16 Listed $145,500 REALCOMP
- 2014-12-25 Listing Removed — Greater Lansing AoR
- 2014-06-25 Listed $143,900 Greater Lansing AoR
- 2010-03-09 Listing Removed — Greater Lansing AoR
- 2009-12-09 Listed $149,900 Greater Lansing AoR
- 2005-07-06 Sold (Public Records) $146,500 Public Records
Property tax history
+5.6%/yrLatest (2025): $5,088 · +24.3% YoY. Source: county tax records.
Cash-flow waterfall
monthlySold comps — $/sqft
last 12 mo · ≤1 miLoading sold comps…