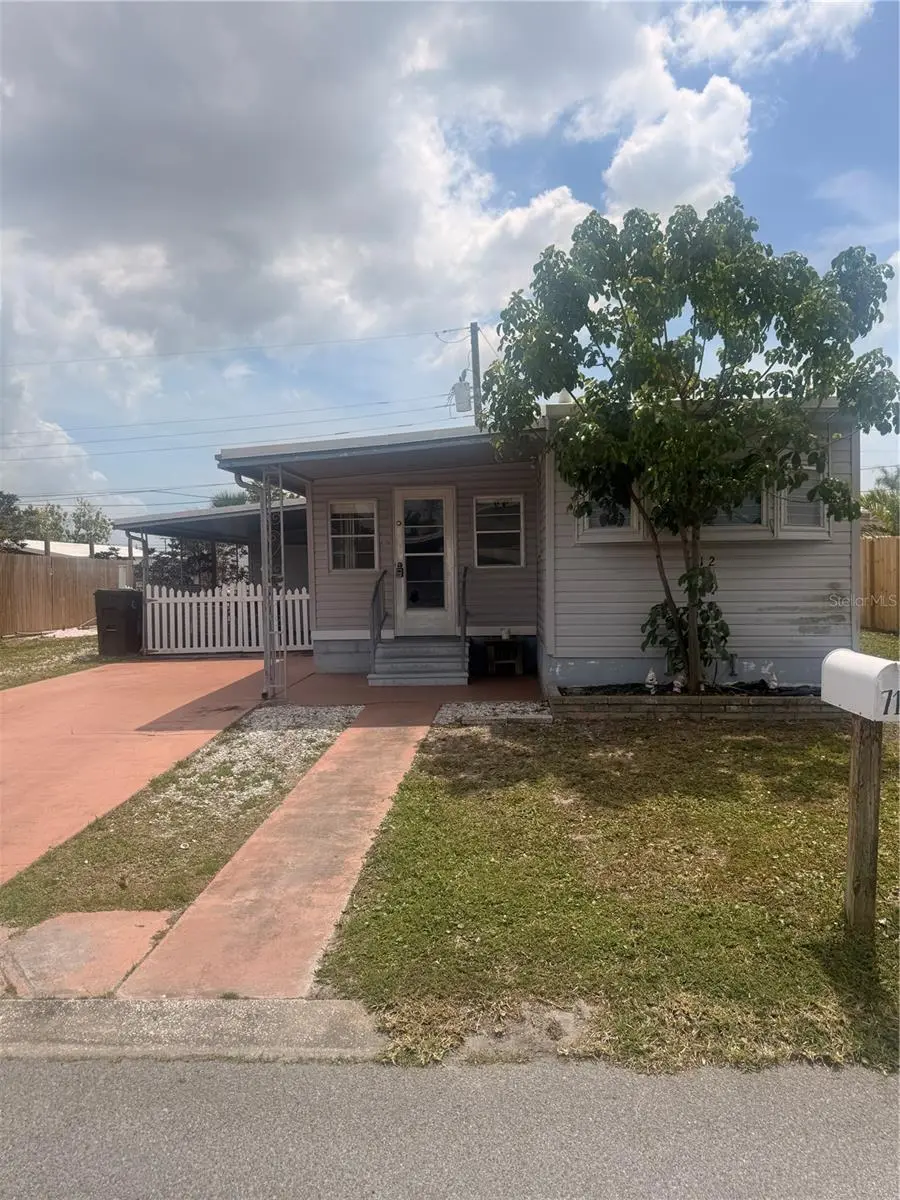
712 50th Avenue Dr W · South Bradenton, FL
Flood risk 1/10 · Minimal
- FEMA flood zone
- AE
- Chance of flooding over 30 yrs
- 0.0%
- Est. flood insurance / yr
- $1,737 – $8,500
Fire risk 1/10 · Minimal
- Est. fire insurance / yr
- $947 – $1,759
Heat risk 10/10 · Severe
- Hot days now (above 107°F)
- 6 days/yr
- Hot days in 30 yrs
- 24 days/yr
Wind risk 10/10 · Severe
- Chance of severe wind over 30 yrs
- 99.0%
Air-quality risk 3/10 · Minor
- Unhealthy air days now
- 2 days/yr
- Unhealthy air days in 30 yrs
- 2 days/yr
Risk factors via First Street. Map © Google.
Why this score? — see what drove the B+ grade
The composite is a weighted blend of 9 inputs, each scored 0–100. Each bar is that input's sub-score; the figure is the points it added to the 100-point composite (weight × sub-score).
- Cash flow +30.0/30.0
- ARV discount +15.0/15.0
- 1% rule +10.0/10.0
- DSCR +10.0/10.0
- Schools +4.4/10.0
- Livability +3.9/5.0
- Condition / age +2.5/5.0
- Rent growth +1.1/5.0
- Appreciation +0.0/10.0
$40,000
🖨 Deal sheet 📄 Offer letter ✓ Due diligence
Listing remarks
Don’t miss this great investment opportunity! This home offers plenty of potential and is being sold AS-IS, making it perfect for investors, seasonal residents, or buyers looking to add their personal touch. Situated on a large lot, the property features a covered carport, laundry area, and ample outdoor space for gardening, entertaining, or additional storage. Enjoy the benefits of low HOA fees, helping to keep ownership affordable. Conveniently located with easy access to shopping, dining, medical facilities, and local attractions. Whether you’re looking for a rental property, winter retreat, or affordable full-time residence, this home is full of possibilities. Schedule your
Key facts
- Ample outdoor space
- Low hoa fees
- Laundry area
Tags
Property features AI
Finance
- Other: Lot approximately 0.09 acres (approx. 60 x 65); Living area about 460 square feet; total building area about 740 square feet; Association fees reported annually $1,620 / monthly $135; Lease restrictions apply
- HOA & community: Has HOA — monthly fee $135 (association approval required); Senior community; Pets allowed
Exterior
- Parking: Has carport (1 space)
- Utilities: Public water; Other sewer; Other utilities
- Home design: Residential mobile home (single wide); One story; Faces north
- Construction: Vinyl siding; Metal roof; Built as single-wide mobile home
- Exterior features: Other exterior features; Asphalt/paved road access
Interior
- Kitchen: Dishwasher; Range
- Bedrooms: 1 bedroom
- Flooring: Other flooring
- Bathrooms: 1 full bathroom
- Heating & cooling: Other heating; Wall/window AC unit(s)
- Interior features: Ceiling fans
- Laundry & utility: Laundry area (other)
Neighborhood map
What this means for you Summary
Snapshot
- This is a 1-bed/1.0-bath manufactured listed at $40k.
Deal economics
- At list price, monthly cash flow is $85 ($1k/yr) — positive.
- The deal already cash-flows at list — no discount required.
- Meets the 1% rule at list price ($1k rent vs $40k).
- Cap rate 21.7% vs local median 4.1% in South Bradenton — top-decile yield for the area; either an underpriced asset or a hidden risk that comps aren't pricing in. Stress-test before assuming the spread holds.
Location & tenants
- Location reads 77/100 on livability (#195 in FL, #3,092 nationally) — a middle-class / working-renter tenant base. Strengths: cost of living A+, housing A+, health & safety A+; Watch: amenities C-, crime D+, commute F.
- Manatee (suburban): math 54% / reading 50% proficiency, ranked #26 of 73 in FL (top 36%) — acceptable for families but not a draw, mixed tenant base, ~2y average lease.
- Market conditions: Rents falling (-5.5%/yr); 361 active listings in the ZIP; 7,472 units permitted in Manatee County in 2024 (1,782 in 5+ unit buildings).
- This rent runs 32% of the median local income ($45k/yr) — at the standard rent-burdened threshold; future hikes will face affordability resistance.
Forward outlook
- Local home prices are declining (-3.0%/yr); year-one equity from $277 of loan paydown is wiped out by about $1k of value loss. Plan a longer hold.
- Manatee County population projected at +43% by 2050 — long-run rental-demand tailwind backs the buy-and-hold thesis.
Negotiation context
- Only 4 days on market — expect competitive offers; lowballing is unlikely to land.
- 2 sale attempts since 4y ago with the ask held roughly flat each time — persistent listings suggest the price (not the market) is what's stuck; bring a comps-based counter.
- Current owner paid $28k; 43% above their basis — modest negotiation headroom, anchor on the comps not their cost.
Risks & watch-outs
- Watch-outs: flood insurance adds $427/mo.
- Climate carrying-cost: in FEMA flood zone AE (mandatory federal flood insurance); severe wind risk, 99% chance of damaging wind over 30y; extreme-heat days projected 6→24/yr by 2055 (HVAC capex compounding) — expect insurance premiums to compound above CPI over the hold.
Questions for the listing agent
- Built in 1960 — when were the roof, HVAC, electrical panel, plumbing, and water heater last replaced?
- What's the actual annual flood-insurance premium (NFIP or private), and is the property in a SFHA with mandatory coverage?
- What does the HOA fee cover, when was the last increase, and are there any pending special assessments or reserve-fund shortfalls?
- Is there a deadline driving the sale (1031 exchange, divorce, estate, relocation)? That informs how much negotiation room exists.
- Schools are B-rated — typically a magnet for longer-tenancy family renters. What's the average tenant stay here, and is there a school-zone premium baked into asking?
- Crime grade is D in this area — have there been break-ins, vandalism, or insurance claims at this property in the last 3 years? What carrier currently insures it and at what premium?
- What's the average days-on-market for RENTAL listings here right now (not sales)? A rising rental-DOM trend means longer vacancies and softer asking-rent achievability than the comps imply.
- What's the recent tenant-quality profile in this submarket — average credit score on applications, eviction rate, late-payment / NSF rate, and stable-employment percentage? A property-management company in the area should have these aggregated.
- How much new for-sale + rental construction is in the pipeline within 1–3 miles? Heavy new supply typically softens prices + rents 12–24 months out; constrained supply supports both.
Investment metrics
- 1% rule
- 2.96% ✓
- Cap rate
- 21.65%
- Cash-on-cash
- 54.85%
- DSCR
- 3.44
- GRM
- 2.8
CMA / ARV
- ARV (on-the-fly)
- $64,860
- Comps found
- 8
Show comp detail 8 sales within ~0.75 mi
| Address | Dist | Beds/Ba | Sqft | Sold | Price | $/sf | Match |
|---|---|---|---|---|---|---|---|
| 618 51st Ave W | 0.10mi | 2/1.5 (+1) | 470 (+2%) | 6mo | $66,000 | $140 | 80 |
| 1017 51st Avenue Dr W | 0.23mi | 1/1.0 | 440 (-4%) | 5mo | $70,000 | $159 | 78 |
| 611 51st Avenue Plz W | 0.15mi | 2/1.0 (+1) | 460 (0%) | 14mo | $65,000 | $141 | 77 |
| 1109 49th Avenue Dr W | 0.25mi | 1/1.0 | 427 (-7%) | 2mo | $70,900 | $166 | 75 |
| 704 49th Ave W | 0.12mi | 1/1.0 | 410 (-11%) | 5mo | $59,900 | $146 | 72 |
| 1107 49th Ave W | 0.26mi | 2/1.0 (+1) | 450 (-2%) | 10mo | $55,000 | $122 | 71 |
| 709 49th Avenue Dr W | 0.08mi | 1/1.0 | 528 (+15%) | 2mo | $30,000 | $57 | 70 |
| 108 51st Avenue Ter W | 0.43mi | 1/1.0 | 520 (+13%) | 8mo | $57,000 | $110 | 52 |
Match score weights: distance 35% · size 25% · config 20% · recency 20%. Top-matched comps best support the ARV.
Projected returns pro-forma
-3.0% appreciation · 0.0% rent growth · sell at horizon
- IRR
- -11.0%
- Equity multiple
- 0.63×
- Total profit
- $-4,148
- Equity at exit
- $5,964
- IRR
- -30.7%
- Equity multiple
- 0.24×
- Total profit
- $-8,531
- Equity at exit
- $3,458
Cash invested: $11,200 (down + closing). Projections, not guarantees.
Landlord ↔ Tenant lean methodology
- Overall (STATE)
- 87 Strongly Landlord-Friendly
- State Florida
- 87 Strongly Landlord-Friendly · R+3
- County
- — inherits STATE
- City
- — inherits STATE
ZIP-level market 34207
- Rents YoY
- -5.5%
- Active inventory
- 361
- Price-to-rent
- 2.8×
Monthly cashflow live
- Estimated rent
- $1,186 medium interval (Pro) →
- Mortgage (P&I)
- −$210
- Tax from tax record
- −$63 /mo · $760/yr
- Insurance
- −$17
- Flood insurance flood zone
- −$427 /mo · $5,118/yr
- HOA
- −$135
- Vacancy / Maint / Mgmt
- −$249
- Net cashflow
- $85
Break-even live
UW: 25.0% down · 7.5% · 30yr · 1.5% tax · 5.0% vac · 8.0% maint · 8.0% mgmt
Financing live
Cash to close
- Down payment
- $10,000
- Closing costs
- $1,200
- Reserves months
- —
- Total cash needed
- —
Loan-product check · same deal, 3 products live
Conventional
25% down · 7.5% · 30yr
- Down + closing
- —
- Monthly P&I
- —
- Monthly cashflow
- —
- DSCR
- —
- Eligible?
- —
Personal DTI + credit; lowest rate.
DSCR
20% down · 8.5% · 30yr
- Down + closing
- —
- Monthly P&I
- —
- Monthly cashflow
- —
- DSCR
- —
- Eligible?
- —
No personal income docs; deal must DSCR.
Hard money
10% down · 12.0% · 12mo
- Down + closing
- —
- Monthly P&I
- —
- Monthly cashflow
- —
- DSCR
- —
- Eligible?
- —
Short-term bridge; refi at stabilization.
HOA detail
- Monthly dues
- $135 · $1,620/yr
Listing history 6 events
-
2026-06-13status $40,000 Pending 4 DOM
-
2026-06-10days on market $40,000 Active 4 DOM
-
2026-06-09days on market $40,000 Active 3 DOM
-
2026-06-08days on market $40,000 Active 2 DOM
-
2026-06-07remarks 687-char remark
-
2026-06-07$40,000 Active 1 DOM
ⓘ Source: listings_history table (triggers on properties + properties_extension) + one-shot
backfill from property_details.listing_events for pre-trigger history.
Tax reassessment forecast FL · Resets to sale price
- Current annual tax
- $760 · $63/mo
- Projected year-2 tax
- $760 · $63/mo
- Expected delta
- $0/yr ($0/mo · 0.0%)
ⓘ Screening estimate from a state-policy table — verify with the county assessor before closing.
Climate risk First Street
- Flood 1/10 Low FEMA zone AE · 0% chance over 30 yrs
- Wildfire 1/10 Low
- Heat 10/10 Extreme 6 d/yr ≥107°F today · 24 d/yr by 30 yrs out
- Wind 10/10 Extreme 99% chance of damaging wind over 30 yrs
- Air quality 3/10 Moderate 2 unhealthy d/yr today · 2 by 30 yrs out
Nearby sold comps map
Loading sold comps map…
Walkable amenities ~0.75 mi
Loading nearby amenities…
Taxation est. · year 1
- Rental income
- $14,228
- − Mortgage interest
- −$2,241
- − Property taxes
- −$760
- − Insurance
- −$5,318
- − Repairs & maintenance
- −$1,138
- − Management
- −$1,138
- − HOA
- −$1,620
- − Depreciation
- −$1,164
- Taxable income
- $849
- Est. tax owed @ 24.0%
- −$204
- After-tax cash flow
- $821/yr
For passive investors: Depreciation is non-cash, so a rental often shows a tax loss while cash-flowing — sheltering income. Rental losses are passive: they offset passive income freely, and up to $25,000/yr can offset ordinary (W-2) income if you actively participate and your MAGI is under $100k (phasing out to $0 by $150k); unused losses carry forward. On sale, claimed depreciation is recaptured at up to 25%, and gains may owe capital-gains tax (a 1031 exchange can defer both). Figures are a year-1 estimate at your 24.0% rate — not tax advice; consult a CPA.
Schools (NCES district)
- District
- Manatee
- NCES district ID
- 1201230
- Math proficiency
- 54% ▼ -6.00%
- Reading proficiency
- 50% ▼ -2.00%
- Median HH income
- $49,607
- Composite
- 44.43/100
- National rank
- #2806
- State rank
- #26 of 73 in FL
Livability — South Bradenton
- Score
- 77/100
- State rank
- #195
- US rank
- #3092
Category grades
Schools grade is shown separately in the Schools card above.
Census & demographics
- Census place
- South Bradenton, FL
- County
- Manatee County · 416,364 people
- Metro
- North Port-Sarasota-Bradenton, FL
- Population (ZIP)
- 34,081
- Household income
- $45,010
- Rent vs Own
- Severe rent burden
- 1474.0
Population outlook (Manatee County) Hauer SSP2
- Today (2025)
- 447,342 people
- By 2030
- 488,911 · +9.3%
- By 2040
- 567,934 · +27.0%
- By 2050
- 637,995 · +42.6%
- By 2075
- 781,970 · +74.8%
- By 2100
- 848,272 · +89.6%
Race, ethnicity, and origin ACS 2023
- Neighborhood character
- Diverse neighborhood (Simpson 0.57)
- Race & ethnicity
- White 58% Hispanic / Latino 29% Two or more races 13% Black 7%
- Hispanic origin (detail)
- Mexican 12% Puerto Rican 4% Cuban 3% Dominican 1%
- Common ancestry
- Lithuanian 3% Romanian 2% Slovak 2%
- Foreign-born
- 16% · Canada, Jamaica
- Languages at home
- 74% English-only · Spanish 22% Other Indo-European 1% French/Haitian/Cajun 1%
Political lean MEDSL · Manatee
- 2024 margin
- Strong R (+23.5) · D 37.9% · R 61.4%
- 2008→2024 swing
- -16.5pp toward R · 2008: -7.0pp · 2024: -23.5pp
- All cycles
- 2024: R+23.5 2020: R+16.1 2016: R+17.1 2012: R+12.5 2008: R+7.0
Not yet ingested
- Civics
- —
Market trends
- HPI YoY
- ▼ -305.32%
- Current HPI
- 369.9899
- Rent YoY
- ▼ -5.50%
- Metro
- North Port-Sarasota-Bradenton, FL
- State GDP YoY
- ▲ 3.28%
- F500 in state
- 36
Industry mix (Fortune 500 HQ in FL)
| Industry | F500 HQs | Revenue |
|---|---|---|
| Industrial Technology | 2 | $29B |
|
||
| Insurance | 2 | $17B |
|
||
| Retail | 1 | $60B |
|
||
| Technology Distribution | 1 | $58B |
|
||
| Homebuilding | 1 | $35B |
|
||
| Technology Manufacturing | 1 | $35B |
|
||
Price history
+42.9% since first listed4 events — show timeline
- 2026-06-06 Listed $40,000 Stellar MLS as Distributed by MLS Grid
- 2022-11-11 Listing Removed — Stellar MLS as Distributed by MLS Grid
- 2022-08-14 Listed $85,000 Stellar MLS as Distributed by MLS Grid
- 1989-12-14 Sold (Public Records) $28,000 Public Records
Property tax history
+3.8%/yrLatest (2025): $760 · +5.1% YoY. Source: county tax records.
Cash-flow waterfall
monthlySold comps — $/sqft
last 12 mo · ≤1 miLoading sold comps…