 Multi-family
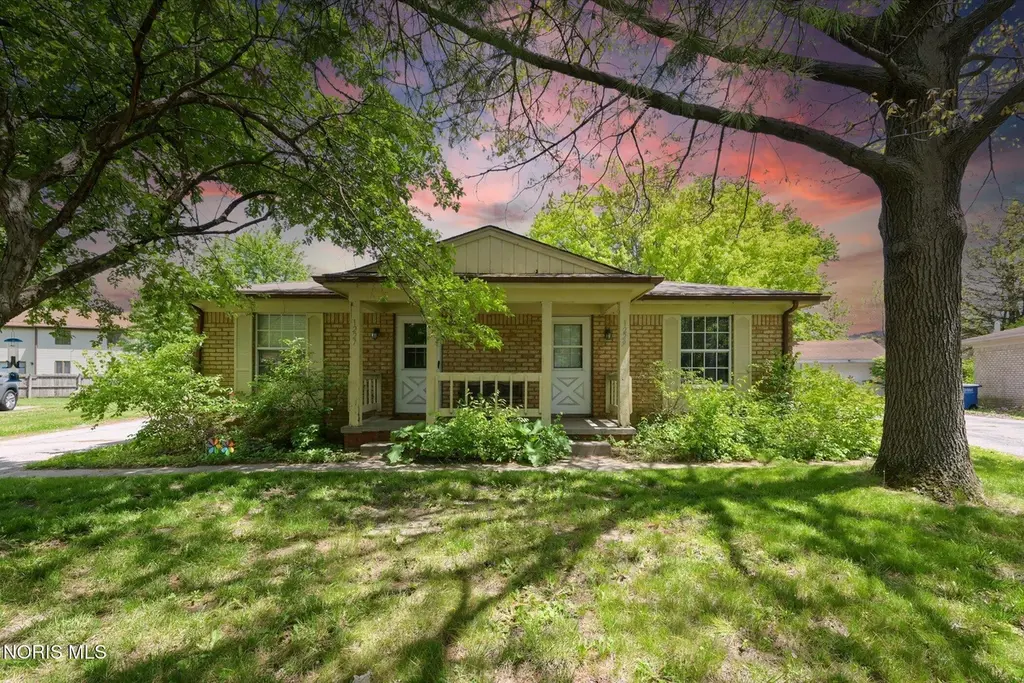
1227 Cypress Creek Ln · Toledo, OH
Flood risk 1/10 · Minimal
- FEMA flood zone
- X (unshaded)
- Chance of flooding over 30 yrs
- 0.0%
- Est. flood insurance / yr
- $507 – $1,088
Fire risk 1/10 · Minimal
- Est. fire insurance / yr
- $713 – $1,323
Heat risk 4/10 · Minor
- Hot days now (above 100°F)
- 7 days/yr
- Hot days in 30 yrs
- 16 days/yr
Wind risk 2/10 · Minimal
- Chance of severe wind over 30 yrs
- —
Air-quality risk 2/10 · Minimal
- Unhealthy air days now
- 1 days/yr
- Unhealthy air days in 30 yrs
- 2 days/yr
Risk factors via First Street. Map © Google.
Why this score? — see what drove the B grade
The composite is a weighted blend of 9 inputs, each scored 0–100. Each bar is that input's sub-score; the figure is the points it added to the 100-point composite (weight × sub-score).
- Cash flow +27.7/30.0
- ARV discount +14.9/15.0
- DSCR +9.8/10.0
- 1% rule +8.1/10.0
- Livability +3.3/5.0
- Rent growth +3.1/5.0
- Condition / age +2.5/5.0
- Schools +1.6/10.0
- Appreciation +0.0/10.0
$159,900
🖨 Deal sheet (PDF) 📄 Offer letter ✓ Due diligence
Multi-family units
County records classify this as Multi-Family (2-4 Unit). Listing-text estimate: 1 unit. estimate disagrees with records
Listing remarks
Great opportunity in a quiet neighborhood! This 1978 single-story Ranch-style twinplex offers two side-by-side units on one level. One unit is currently rented for $700/month, while the other is vacant and ready for a new owner-occupant or tenant. Each unit features 2 bedrooms, 1 bathroom, a spacious living room, and a large eat-in kitchen. Both sides include in-unit laundry, forced-air furnace, and central air conditioning. Updated vinyl windows throughout, low-maintenance brick exterior, and a fully fenced privacy backyard provide comfort and ease of ownership. Additional features include a two-car garage with dedicated driveway and a small covered front porch. Perfect for an owner-occupa
Key facts
- In-unit laundry
- Forced-air furnace
- 0.29 acre lot
Tags
Property features AI
Finance
- Financial info: Two-unit building with one unit occupied and one unit vacant; Tenants pay electricity and gas; Owner responsible for grounds care, water, snow removal, and taxes
Exterior
- Parking: Detached garage; Total 4 parking spaces (2 in garage); Asphalt driveway
- Utilities: Electricity available; Natural gas available; Public water; Public sewer
- Home design: Residential income property (duplex); Single-story
- Construction: Brick construction; Shingle roof; Crawl space foundation; Built as a duplex / multi-family
- Exterior features: Full privacy fencing; Irregular lot
Interior
- Kitchen: Dishwasher; Electric oven; Refrigerator
- Flooring: Carpet; Tile
- Heating & cooling: Forced air heating; Central air conditioning
- Interior features: No interior steps
- Laundry & utility: In-unit washer and dryer
Neighborhood map
What this means for you Summary
Snapshot
- This is a 4-bed/2.0-bath multifamily listed at $160k.
Deal economics
- At list price, monthly cash flow is $483 ($6k/yr) — positive.
- The deal already cash-flows at list — no discount required.
- Meets the 1% rule at list price ($2k rent vs $160k).
- Recommended offer: $158k (1.5% below list) — sets the bar for market timing.
- Cap rate 9.9% vs local median 7.5% in Toledo — top-decile yield for the area; either an underpriced asset or a hidden risk that comps aren't pricing in. Stress-test before assuming the spread holds.
Location & tenants
- Location reads 66/100 on livability (#645 in OH) — a middle-class / working-renter tenant base. Strengths: cost of living A+, housing A+, health & safety A+; Watch: amenities C-, crime F, commute F.
- Toledo City (urban): math 15% / reading 24% proficiency, ranked #634 of 656 in OH (top 97%) — low school quality limits family demand, transient renter base, plan for 1-2y turnover; 72% free/reduced lunch — lower-income household profile, screen leases tightly.
- Zoned schools: Grove Patterson Academy Elementary School (math 47% / reading 66%, grade C+, #761 of 1,584 statewide, top 48%, 403 students, 38% FRL); Rogers High School (math 8% / reading 27%, grade F, #689 of 781 statewide, top 90%, 721 students, 0% FRL) — zoned schools average 19% FRL vs 72% district-wide (53 pts lower); this property's tenant base skews higher-income than the district average.
- Zoned-school proficiency averages 37% at this address vs 20% district-wide (+17 pts) — the actual schools serving this property are materially stronger than the Toledo City average implies; a family-tenant draw the district grade alone would hide.
- Market conditions: Rents rising (+2.6%/yr); 116 active listings in the ZIP; 1 comparable units currently listed for rent nearby; 415 units permitted in Lucas County in 2024 (122 in 5+ unit buildings).
- This rent runs 44% of the median local income ($58k/yr) — at the standard rent-burdened threshold; future hikes will face affordability resistance.
Forward outlook
- Local home prices are declining (-3.0%/yr); year-one equity from $1k of loan paydown is wiped out by about $5k of value loss. Plan a longer hold.
- Lucas County population projected at -16% by 2050 — secular population decline; favor cash flow + early exit over multi-decade hold.
- At projected returns (-3.0% appreciation + 2.6% rent growth), your $45k cash investment doubles in ~10 years — after that, you're playing with house money.
Negotiation context
- It's been on market 26 days — a 2% lower offer ($158k) is reasonable based on typical stale-listing flexibility.
- 8 sale attempts since 18y ago with the ask held roughly flat each time — persistent listings suggest the price (not the market) is what's stuck; bring a comps-based counter.
- Current owner paid $79k; list at $160k implies a 103% gain — meaningful room to come down on a strong offer.
Questions for the listing agent
- Built in 1978 — when were the roof, HVAC, electrical panel, plumbing, and water heater last replaced?
- Is there a deadline driving the sale (1031 exchange, divorce, estate, relocation)? That informs how much negotiation room exists.
- Schools are D-rated, which usually means shorter tenancies and higher turnover. Who's the typical renter profile here, and what's been the actual vacancy rate?
- Crime grade is F in this area — have there been break-ins, vandalism, or insurance claims at this property in the last 3 years? What carrier currently insures it and at what premium?
- What's the average days-on-market for RENTAL listings here right now (not sales)? A rising rental-DOM trend means longer vacancies and softer asking-rent achievability than the comps imply.
- What's the recent tenant-quality profile in this submarket — average credit score on applications, eviction rate, late-payment / NSF rate, and stable-employment percentage? A property-management company in the area should have these aggregated.
- How much new apartment / multifamily construction is in the pipeline within 1–3 miles? Heavy new supply (>2% of stock underway) typically softens rents 12–24 months out; light construction supports rent growth.
Investment metrics
- 1% rule
- 1.31% ✓
- Cap rate
- 9.92%
- Cash-on-cash
- 12.94%
- DSCR
- 1.58
- GRM
- 6.4
CMA / ARV
- ARV (median comp)
- $191,202
- List price
- $159,900
- Delta
- -16.37%
- Verdict
- UNDERPRICED
- Comps
- 4 within 1.0 mi
Projected returns pro-forma
-3.0% appreciation · 2.59% rent growth · sell at horizon
- IRR
- 2.4%
- Equity multiple
- 1.09×
- Total profit
- $4,055
- Equity at exit
- $23,842
- IRR
- 11.6%
- Equity multiple
- 1.89×
- Total profit
- $39,924
- Equity at exit
- $13,825
Cash invested: $44,772 (down + closing). Projections, not guarantees.
Landlord ↔ Tenant lean methodology
- Overall (STATE)
- 73 Landlord-Friendly
- State Ohio
- 73 Landlord-Friendly · R+6
- County
- — inherits STATE
- City
- — inherits STATE
ZIP-level market 43615
- Home prices YoY
- -31.9%
- Rents YoY
- 2.6%
- Active inventory
- 116
- Price-to-rent
- 12.7×
Monthly cashflow live
- Estimated rent
- $2,098 high interval (Pro) →
- Mortgage (P&I)
- −$839
- Tax from tax record
- −$269 /mo · $3,233/yr
- Insurance
- −$67
- HOA
- −$0
- Vacancy / Maint / Mgmt
- −$441
- Net cashflow
- $483
Break-even live
Sensitivity live
| Price | -10% $573 | -5% $528 | +0% $483 | +5% $438 | +10% $392 |
|---|---|---|---|---|---|
| Rent | -10% $317 | -5% $400 | +0% $483 | +5% $566 | +10% $649 |
| Rate | -1.0pp $563 | -0.5pp $524 | base $483 | +0.5pp $441 | +1.0pp $399 |
2-unit breakdown (identical units grouped — click to expand)
| Units | Beds | Baths | Est. rent |
|---|---|---|---|
| 2× units | 2 | 1 | $2,098 |
| #1 | 2 | 1 | $1,049 |
| #2 | 2 | 1 | $1,049 |
| Total (2 units) | $2,098 | ||
UW: 25.0% down · 7.5% · 30yr · 1.5% tax · 5.0% vac · 8.0% maint · 8.0% mgmt
Financing live
Cash to close
- Down payment
- $39,975
- Closing costs
- $4,797
- Reserves months
- —
- Total cash needed
- —
Loan-product check · same deal, 3 products live
Conventional
25% down · 7.5% · 30yr
- Down + closing
- —
- Monthly P&I
- —
- Monthly cashflow
- —
- DSCR
- —
- Eligible?
- —
Personal DTI + credit; lowest rate.
DSCR
20% down · 8.5% · 30yr
- Down + closing
- —
- Monthly P&I
- —
- Monthly cashflow
- —
- DSCR
- —
- Eligible?
- —
No personal income docs; deal must DSCR.
Hard money
10% down · 12.0% · 12mo
- Down + closing
- —
- Monthly P&I
- —
- Monthly cashflow
- —
- DSCR
- —
- Eligible?
- —
Short-term bridge; refi at stabilization.
Rent comps 1 comps
| Address | Beds | Baths | Sqft | Rent | $/sqft | DOM | Units | Dist |
|---|---|---|---|---|---|---|---|---|
| 5001 South Ave Toledo, OH | 3.0 | 2.0 | 1312 | $1,424 | $1.09 | 15d | 1 | 0.91mi |
Listing history 25 events
-
2026-06-14status $159,900 Pending 26 DOM
-
2026-06-10days on market $159,900 Active 26 DOM
-
2026-06-09days on market $159,900 Active 25 DOM
-
2026-06-08days on market $159,900 Active 24 DOM
-
2026-06-07days on market $159,900 Active 23 DOM
-
2026-06-05days on market $159,900 Active 20 DOM
-
2026-06-03days on market $159,900 Active 19 DOM
-
2026-06-02days on market $159,900 Active 18 DOM
-
2026-06-01days on market $159,900 Active 17 DOM
-
2026-05-31days on market $159,900 Active 16 DOM
-
2026-05-30days on market $159,900 Active 15 DOM
-
2026-05-15$159,900 Active 992-char remark
-
2017-07-03soldstatus $78,900
-
2017-06-16soldstatus $78,900
-
2017-03-31$78,900
-
2017-03-30historical
-
2017-01-26historical
-
2017-01-23$78,800
-
2016-06-14$78,800
-
2016-03-17historical
-
2014-08-23$79,400
-
2009-08-31historical
-
2009-05-05$99,900
-
2009-03-25historical
-
2008-09-25$99,900
ⓘ Source: listings_history table (triggers on properties + properties_extension) + one-shot
backfill from property_details.listing_events for pre-trigger history.
Tax reassessment forecast OH · Partial reset (capped growth)
- Current annual tax
- $3,233 · $269/mo
- Projected year-2 tax
- $3,233 · $269/mo
- Expected delta
- $0/yr ($0/mo · 0.0%)
ⓘ Screening estimate from a state-policy table — verify with the county assessor before closing.
Climate risk First Street
- Flood 1/10 Low FEMA zone X (unshaded) · 0% chance over 30 yrs
- Wildfire 1/10 Low
- Heat 4/10 Moderate 7 d/yr ≥100°F today · 16 d/yr by 30 yrs out
- Wind 2/10 Low
- Air quality 2/10 Low 1 unhealthy d/yr today · 2 by 30 yrs out
Nearby sold comps map
Loading sold comps map…
Walkable amenities ~0.75 mi
Loading nearby amenities…
Taxation est. · year 1
- Rental income
- $25,176
- − Mortgage interest
- −$8,957
- − Property taxes
- −$3,233
- − Insurance
- −$800
- − Repairs & maintenance
- −$2,014
- − Management
- −$2,014
- − Depreciation
- −$4,652
- Taxable income
- $3,507
- Est. tax owed @ 24.0%
- −$842
- After-tax cash flow
- $4,953/yr
For passive investors: Depreciation is non-cash, so a rental often shows a tax loss while cash-flowing — sheltering income. Rental losses are passive: they offset passive income freely, and up to $25,000/yr can offset ordinary (W-2) income if you actively participate and your MAGI is under $100k (phasing out to $0 by $150k); unused losses carry forward. On sale, claimed depreciation is recaptured at up to 25%, and gains may owe capital-gains tax (a 1031 exchange can defer both). Figures are a year-1 estimate at your 24.0% rate — not tax advice; consult a CPA.
Schools (NCES district)
- District
- Toledo City
- NCES district ID
- 3904490
- Math proficiency
- 15% ▼ -16.00%
- Reading proficiency
- 24% ▼ -13.00%
- Median HH income
- $32,137
- Composite
- 15.76/100
- National rank
- #9276
- State rank
- #634 of 656 in OH
Livability — Toledo
- Score
- 66/100
- State rank
- #645
- US rank
- #11442
Category grades
Schools grade is shown separately in the Schools card above.
Census & demographics
- Census place
- Toledo, OH
- County
- Lucas County · 380,724 people
- City population
- 280,811
- Metro
- Toledo, OH
- Population (ZIP)
- 40,146
- Household income
- $57,713
- Rent vs Own
- Severe rent burden
- 1683.0
Population outlook (Lucas County) Hauer SSP2
- Today (2025)
- 420,751 people
- By 2030
- 410,187 · -2.5%
- By 2040
- 384,019 · -8.7%
- By 2050
- 355,125 · -15.6%
- By 2075
- 291,683 · -30.7%
- By 2100
- 233,670 · -44.5%
Race, ethnicity, and origin ACS 2023
- Neighborhood character
- Majority White (62%)
- Race & ethnicity
- White 62% Black 26% Two or more races 6% Hispanic / Latino 4% Asian 3%
- Common ancestry
- Romanian 7% Lithuanian 3% Slovak 2%
- Foreign-born
- 5% · China, Canada
- Languages at home
- 93% English-only · Arabic 2% Spanish 1% Chinese 1%
Political lean MEDSL · Lucas
- 2024 margin
- D (+12.6) · D 55.8% · R 43.2%
- 2008→2024 swing
- -18.9pp toward R · 2008: 31.4pp · 2024: 12.6pp
- All cycles
- 2024: D+12.6 2020: D+16.8 2016: D+17.4 2012: D+30.4 2008: D+31.4
Not yet ingested
- Civics
- —
Market trends
- HPI YoY
- ▼ -96.44%
- Current HPI
- 205.95
- Rent YoY
- ▲ 2.59%
- Metro
- Toledo, OH
- State GDP YoY
- ▲ 1.98%
- F500 in state
- 48
Industry mix (Fortune 500 HQ in OH)
| Industry | F500 HQs | Revenue |
|---|---|---|
| Insurance | 3 | $145B |
|
||
| Industrial Machinery | 3 | $49B |
|
||
| Financial Services | 3 | $24B |
|
||
| Consumer Goods | 2 | $93B |
|
||
| Aerospace / Defense | 2 | $47B |
|
||
| Utilities | 2 | $33B |
|
||
Price history
+60.1% since first listed17 events — show timeline
- 2026-06-10 Pending — NORIS
- 2026-05-27 Relisted — NORIS
- 2026-05-27 Contingent — NORIS
- 2026-05-15 Listed $159,900 NORIS
- 2017-07-03 Sold (Public Records) $78,900 Public Records
- 2017-06-16 Sold (MLS) $78,900 NORIS
- 2017-03-31 Listed $78,900 NORIS
- 2017-03-30 Listing Removed — NORIS
- 2017-01-26 Listing Removed — NORIS
- 2017-01-23 Listed $78,800 NORIS
- 2016-06-14 Listed $78,800 NORIS
- 2016-03-17 Listing Removed — NORIS
- 2014-08-23 Listed $79,400 NORIS
- 2009-08-31 Listing Removed — NORIS
- 2009-05-05 Listed $99,900 NORIS
- 2009-03-25 Listing Removed — NORIS
- 2008-09-25 Listed $99,900 NORIS
Property tax history
+2.4%/yrLatest (2025): $3,233 · -0.4% YoY. Source: county tax records.
Cash-flow waterfall
monthlySold comps — $/sqft
last 12 mo · ≤1 miLoading sold comps…